
|
|||||
|
 | |
| |
| |
| |
| |
| |
|
Gene: CLASP2 |
Gene summary for CLASP2 |
| Gene information | Species | Human | Gene symbol | CLASP2 | Gene ID | 23122 |
| Gene name | cytoplasmic linker associated protein 2 | |
| Gene Alias | CLASP2 | |
| Cytomap | 3p22.3 | |
| Gene Type | protein-coding | GO ID | GO:0000226 | UniProtAcc | O75122 |
Top |
Malignant transformation analysis |
| Identification of the aberrant gene expression in precancerous and cancerous lesions by comparing the gene expression of stem-like cells in diseased tissues with normal stem cells |
| Entrez ID | Symbol | Replicates | Species | Organ | Tissue | Adj P-value | Log2FC | Malignancy |
| 23122 | CLASP2 | CCI_2 | Human | Cervix | CC | 5.33e-04 | 6.80e-01 | 0.5249 |
| 23122 | CLASP2 | CCI_3 | Human | Cervix | CC | 1.79e-13 | 8.49e-01 | 0.516 |
| 23122 | CLASP2 | HTA11_3410_2000001011 | Human | Colorectum | AD | 5.80e-09 | -3.32e-01 | 0.0155 |
| 23122 | CLASP2 | HTA11_3361_2000001011 | Human | Colorectum | AD | 4.94e-06 | -4.43e-01 | -0.1207 |
| 23122 | CLASP2 | HTA11_5212_2000001011 | Human | Colorectum | AD | 1.36e-02 | -4.70e-01 | -0.2061 |
| 23122 | CLASP2 | HTA11_866_3004761011 | Human | Colorectum | AD | 1.77e-04 | -2.49e-01 | 0.096 |
| 23122 | CLASP2 | F007 | Human | Colorectum | FAP | 5.10e-03 | -2.64e-01 | 0.1176 |
| 23122 | CLASP2 | A001-C-207 | Human | Colorectum | FAP | 1.01e-02 | -1.35e-01 | 0.1278 |
| 23122 | CLASP2 | A015-C-203 | Human | Colorectum | FAP | 1.78e-26 | -2.89e-01 | -0.1294 |
| 23122 | CLASP2 | A015-C-204 | Human | Colorectum | FAP | 5.98e-09 | -3.28e-01 | -0.0228 |
| 23122 | CLASP2 | A014-C-040 | Human | Colorectum | FAP | 1.49e-02 | -1.90e-01 | -0.1184 |
| 23122 | CLASP2 | A002-C-201 | Human | Colorectum | FAP | 5.94e-17 | -3.25e-01 | 0.0324 |
| 23122 | CLASP2 | A002-C-203 | Human | Colorectum | FAP | 7.13e-03 | -1.04e-01 | 0.2786 |
| 23122 | CLASP2 | A001-C-119 | Human | Colorectum | FAP | 1.01e-05 | -9.76e-02 | -0.1557 |
| 23122 | CLASP2 | A001-C-108 | Human | Colorectum | FAP | 1.85e-17 | -1.99e-01 | -0.0272 |
| 23122 | CLASP2 | A002-C-205 | Human | Colorectum | FAP | 5.98e-27 | -4.16e-01 | -0.1236 |
| 23122 | CLASP2 | A015-C-005 | Human | Colorectum | FAP | 4.19e-02 | -8.08e-02 | -0.0336 |
| 23122 | CLASP2 | A015-C-006 | Human | Colorectum | FAP | 1.63e-16 | -3.93e-01 | -0.0994 |
| 23122 | CLASP2 | A015-C-106 | Human | Colorectum | FAP | 8.85e-09 | -1.16e-01 | -0.0511 |
| 23122 | CLASP2 | A002-C-114 | Human | Colorectum | FAP | 2.34e-19 | -3.36e-01 | -0.1561 |
| Page: 1 2 3 4 |
| Tissue | Expression Dynamics | Abbreviation |
| Cervix | 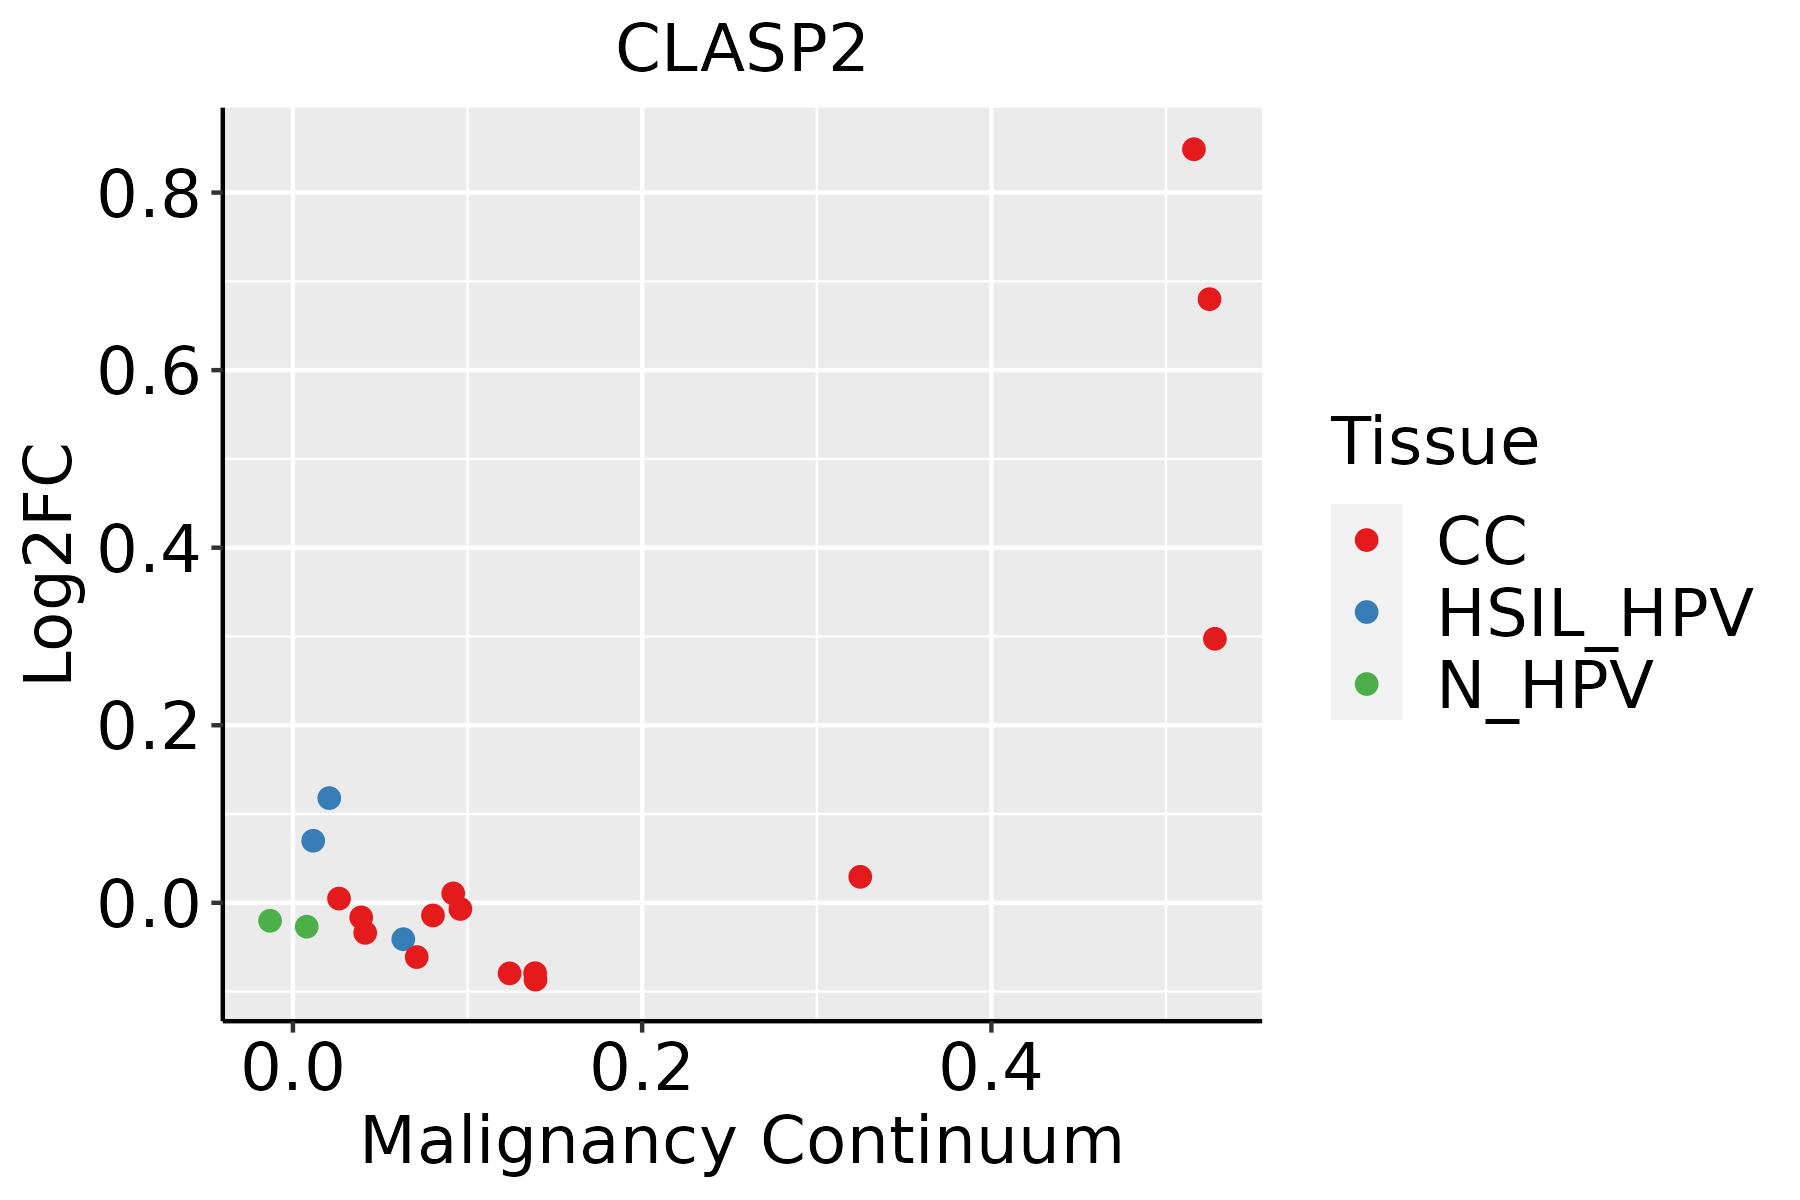 | CC: Cervix cancer |
| HSIL_HPV: HPV-infected high-grade squamous intraepithelial lesions | ||
| N_HPV: HPV-infected normal cervix | ||
| Colorectum (GSE201348) | 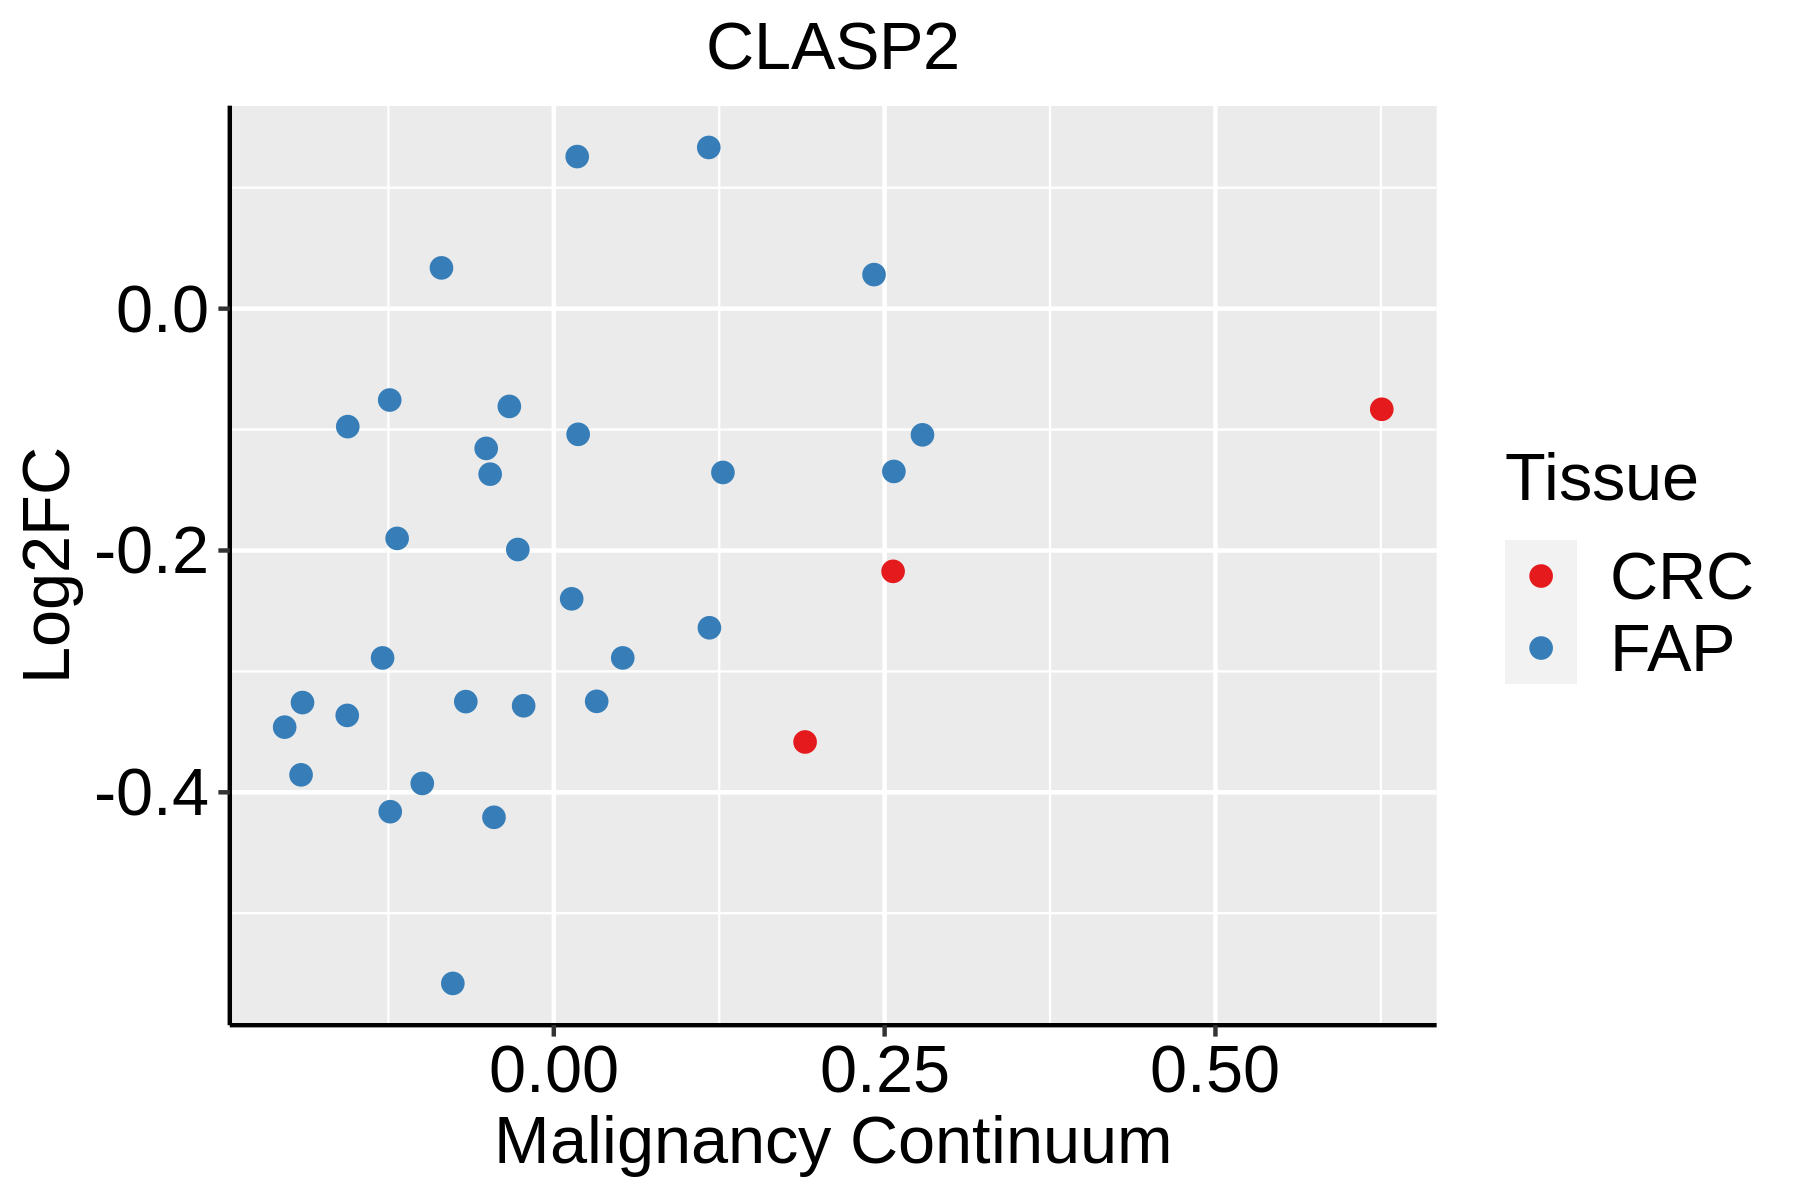 | FAP: Familial adenomatous polyposis |
| CRC: Colorectal cancer | ||
| Colorectum (HTA11) | 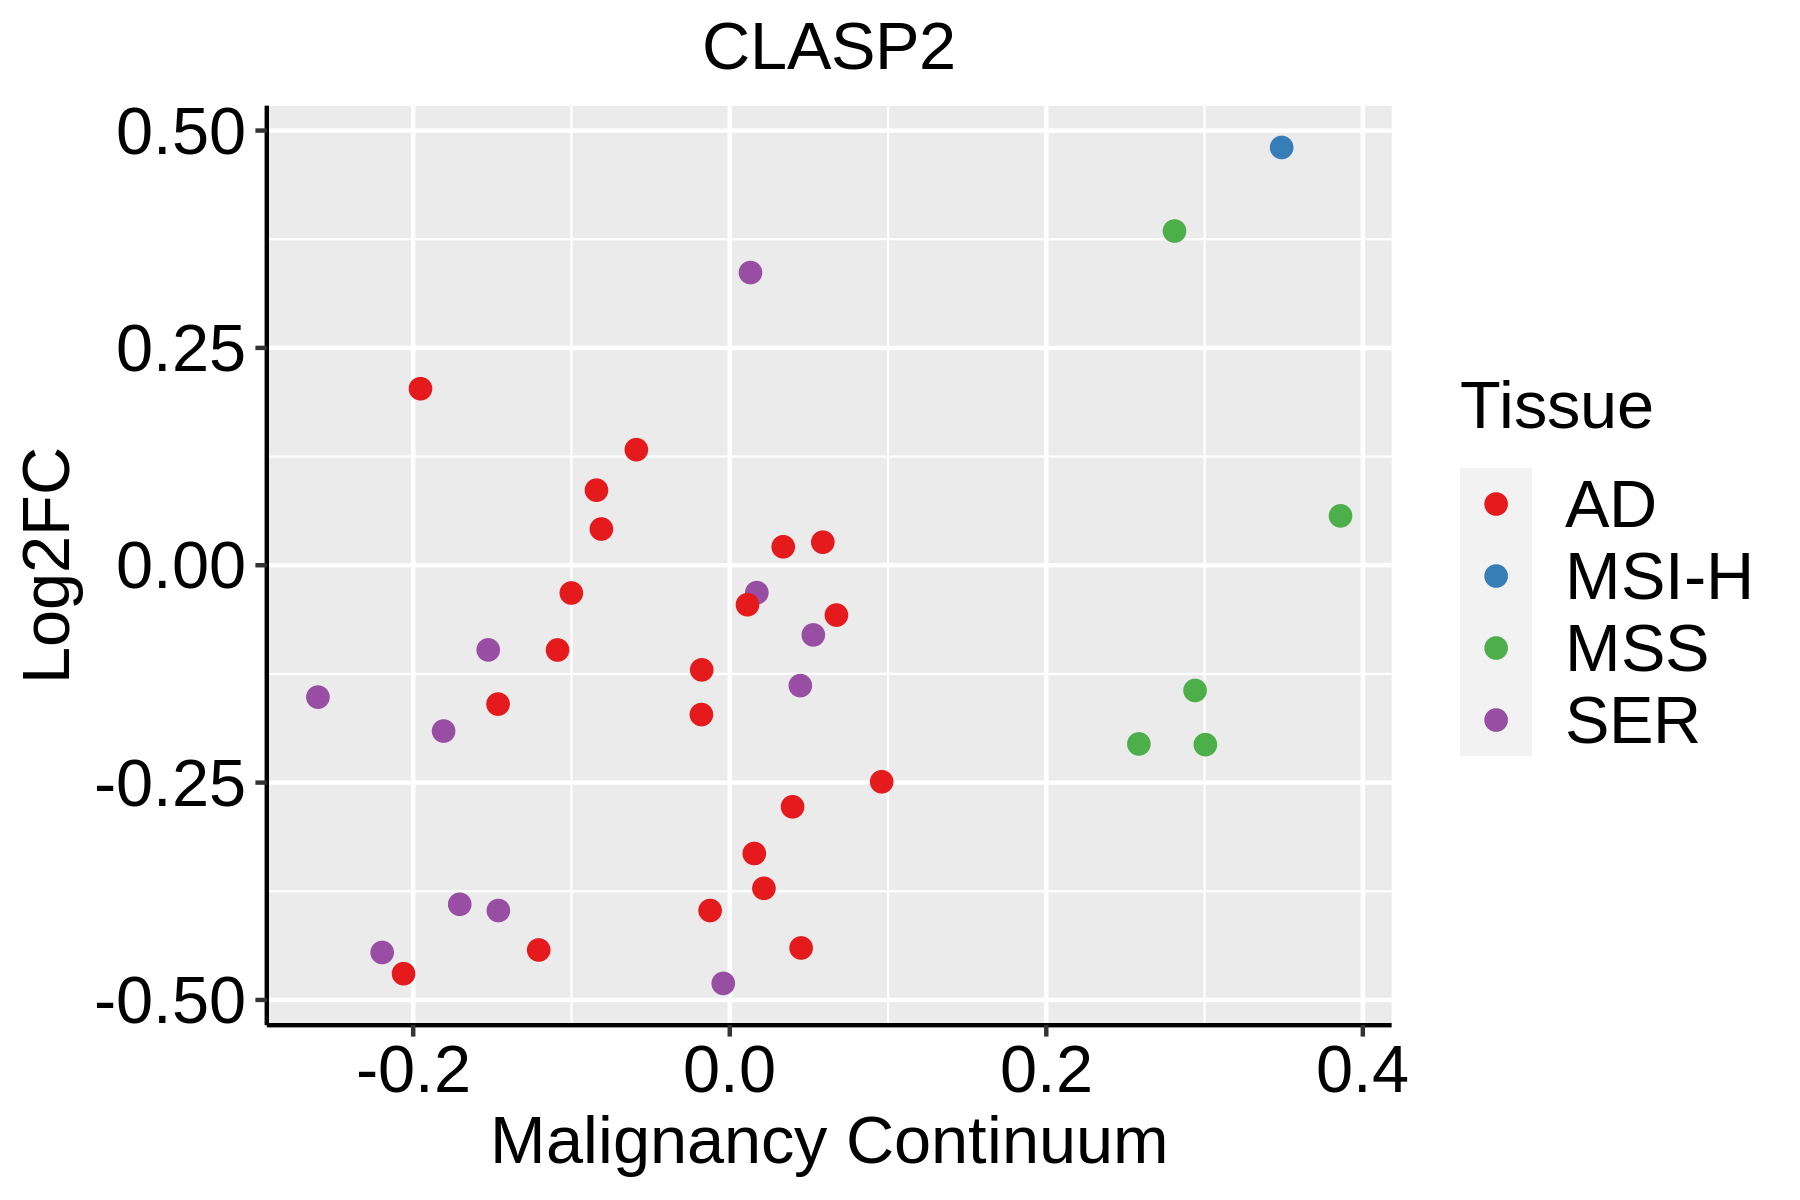 | AD: Adenomas |
| SER: Sessile serrated lesions | ||
| MSI-H: Microsatellite-high colorectal cancer | ||
| MSS: Microsatellite stable colorectal cancer | ||
| Endometrium | 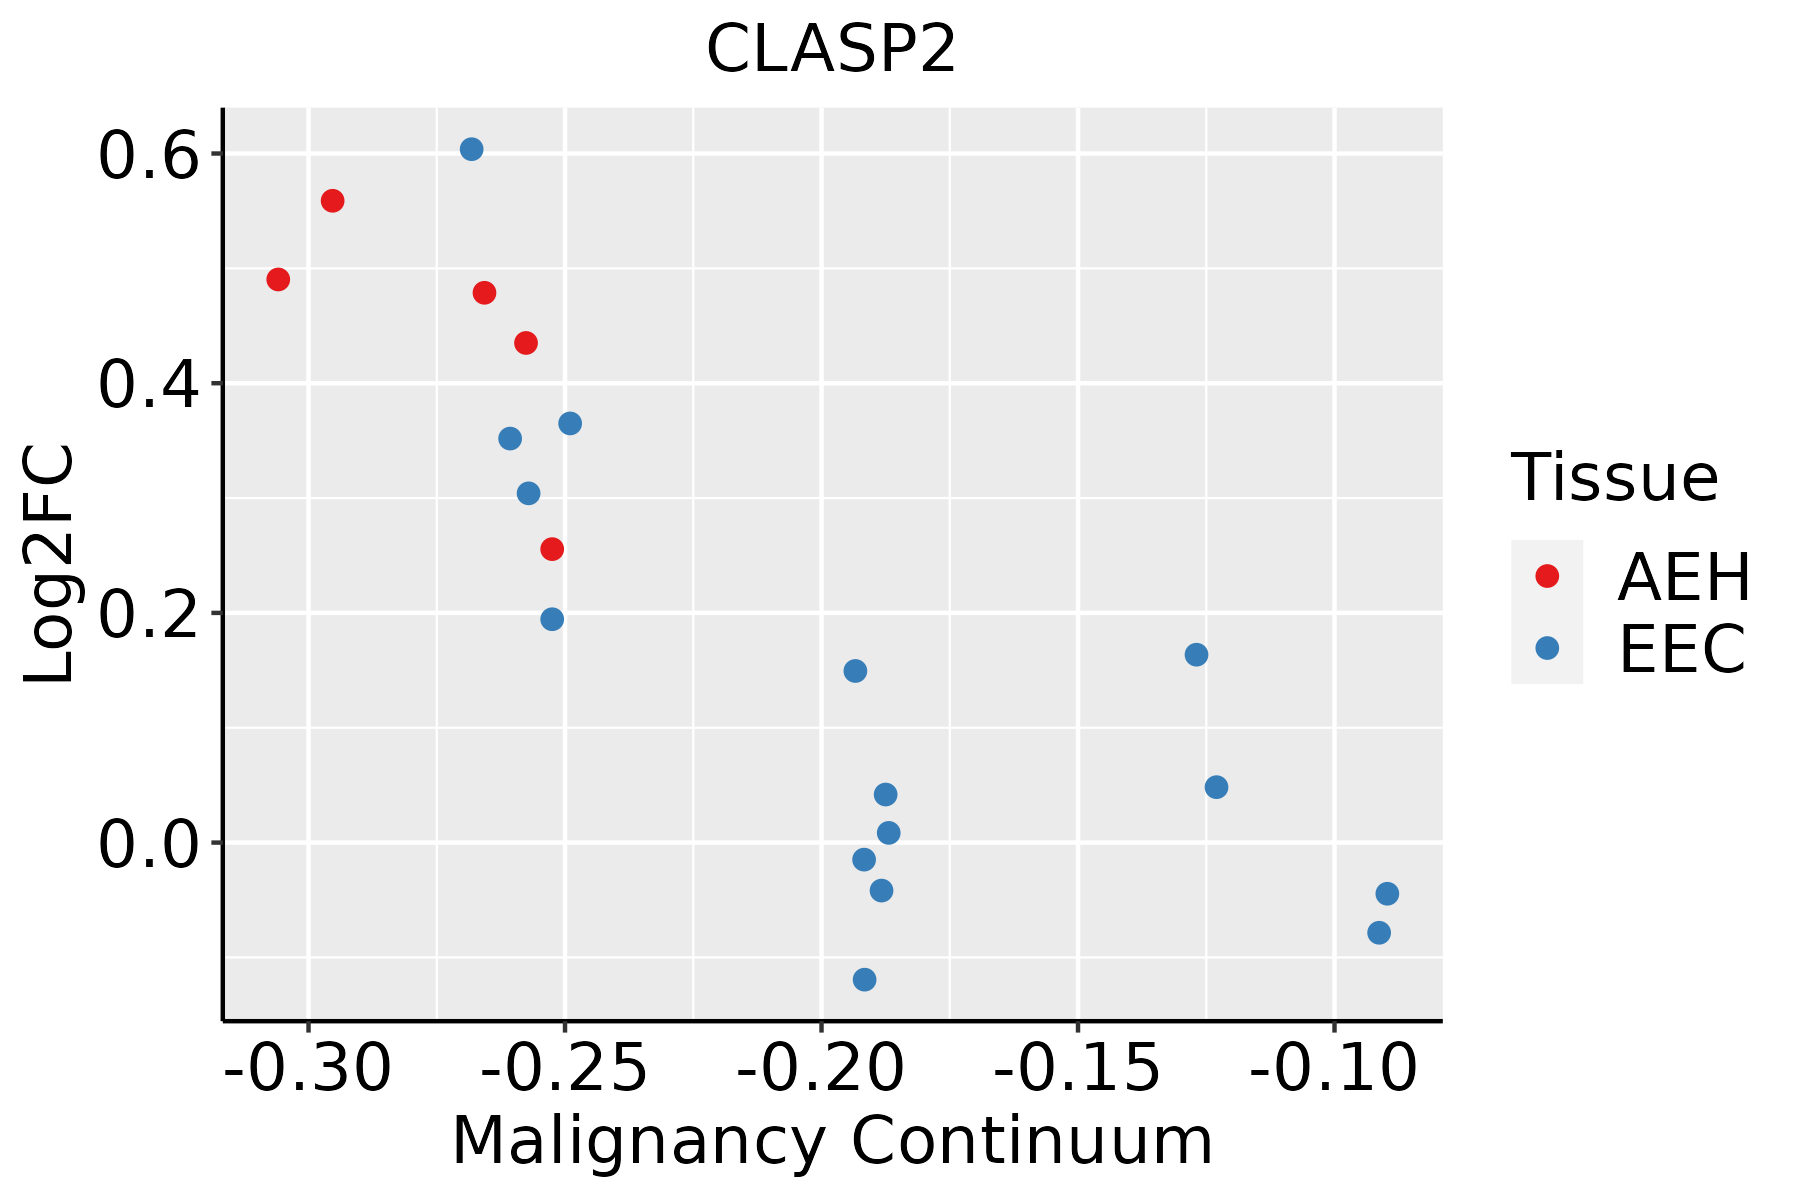 | AEH: Atypical endometrial hyperplasia |
| EEC: Endometrioid Cancer | ||
| Lung | 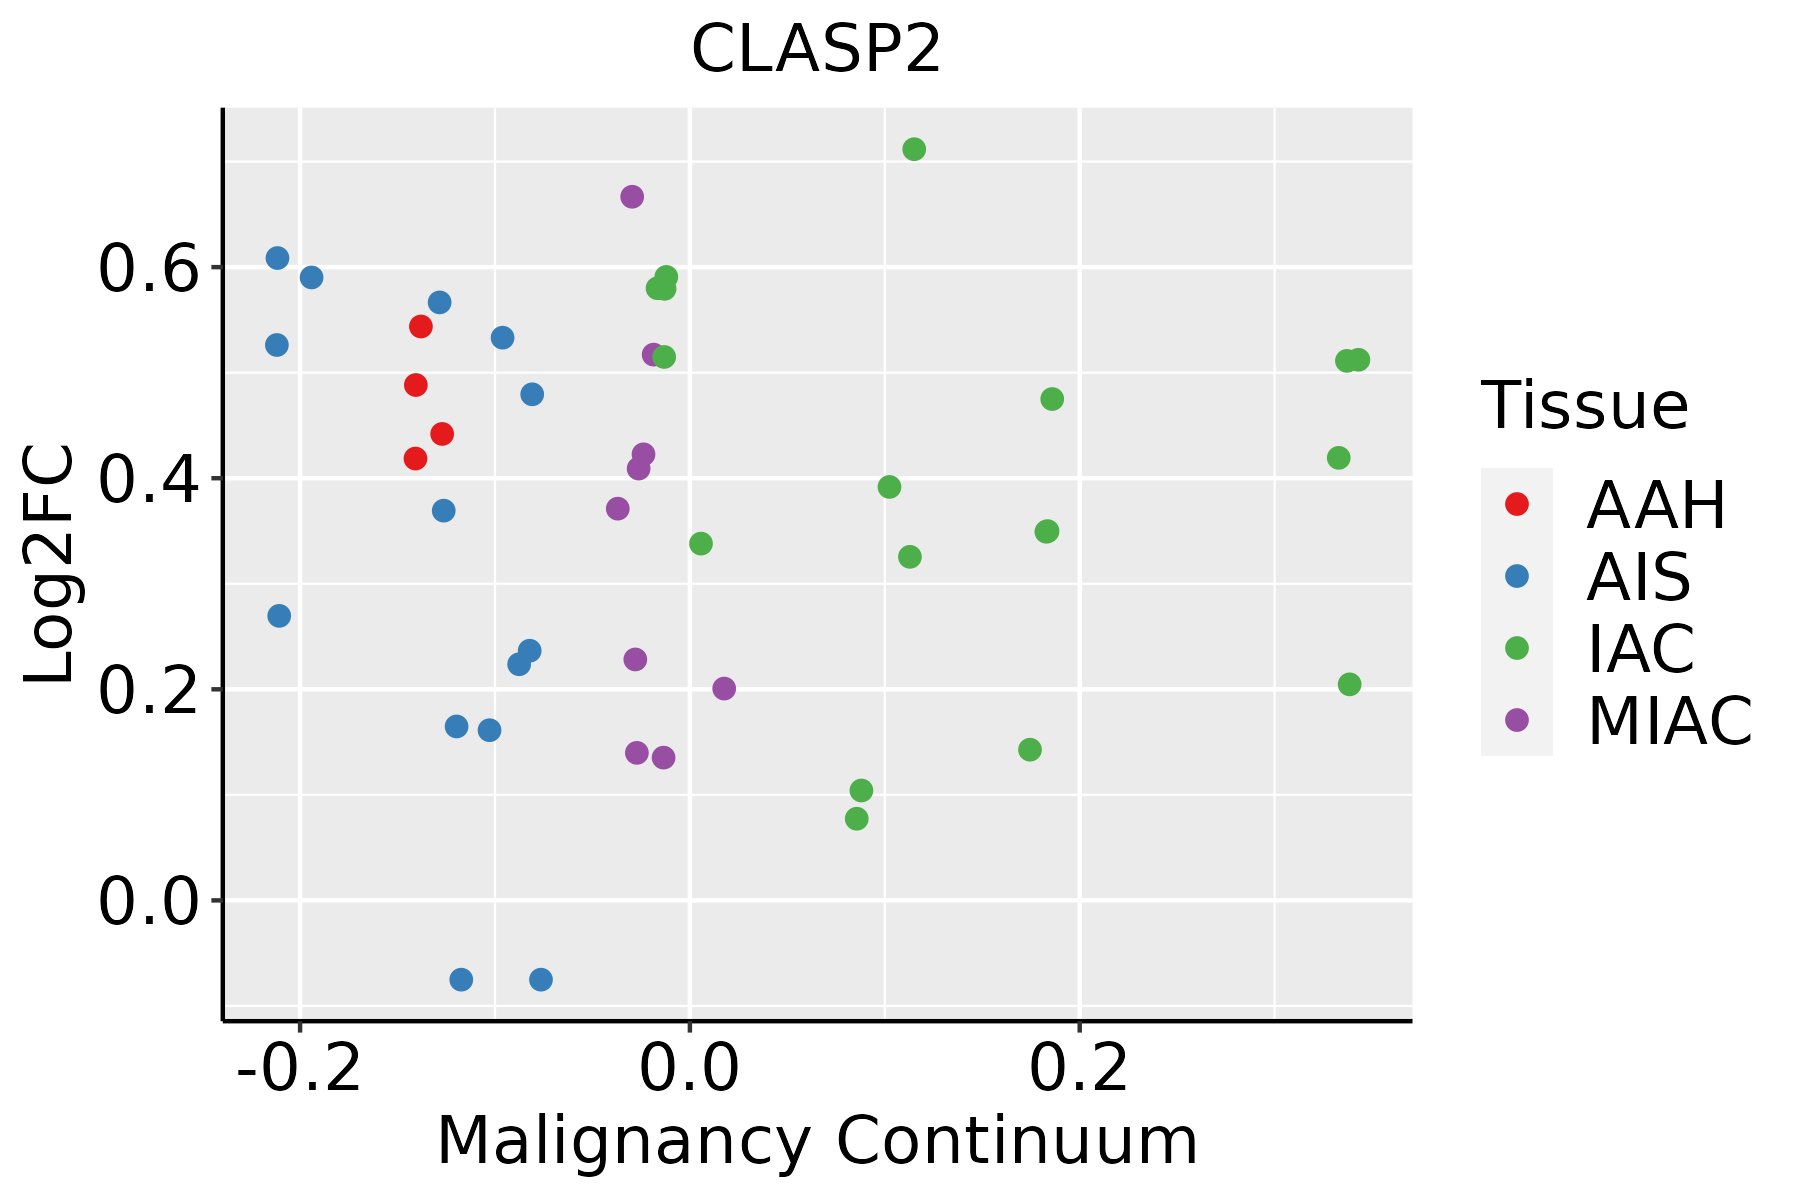 | AAH: Atypical adenomatous hyperplasia |
| AIS: Adenocarcinoma in situ | ||
| IAC: Invasive lung adenocarcinoma | ||
| MIA: Minimally invasive adenocarcinoma | ||
| Skin |  | AK: Actinic keratosis |
| cSCC: Cutaneous squamous cell carcinoma | ||
| SCCIS:squamous cell carcinoma in situ |
| ∗log2FC in expression of this searched gene in stem-like cells from each diseased tissue sample relative to stem-like cells in normal samples in each tissue plotted against the malignancy continuum. Samples are colored based on if they are from different disease stage. |
Top |
Malignant transformation related pathway analysis |
| Find out the enriched GO biological processes and KEGG pathways involved in transition from healthy to precancer to cancer |
| Tissue | Disease Stage | Enriched GO biological Processes |
| Colorectum | AD |  |
| Colorectum | SER |  |
| Colorectum | MSS |  |
| Colorectum | MSI-H |  |
| Colorectum | FAP |  |
| ∗Top 15 enriched GO BP terms are showed in the bar plot of each disease state in each tissue. Each row represents a significant GO biological process which is colored according to the -log10(p.adjust). |
| Page: 1 2 3 4 5 6 7 8 9 |
| GO ID | Tissue | Disease Stage | Description | Gene Ratio | Bg Ratio | pvalue | p.adjust | Count |
| GO:00905054 | Endometrium | AEH | epiboly involved in wound healing | 11/2100 | 34/18723 | 8.45e-04 | 7.82e-03 | 11 |
| GO:00516507 | Endometrium | AEH | establishment of vesicle localization | 32/2100 | 161/18723 | 8.99e-04 | 8.24e-03 | 32 |
| GO:00069035 | Endometrium | AEH | vesicle targeting | 13/2100 | 45/18723 | 9.84e-04 | 8.90e-03 | 13 |
| GO:00905044 | Endometrium | AEH | epiboly | 11/2100 | 35/18723 | 1.11e-03 | 9.71e-03 | 11 |
| GO:00514949 | Endometrium | AEH | negative regulation of cytoskeleton organization | 32/2100 | 163/18723 | 1.12e-03 | 9.74e-03 | 32 |
| GO:190303410 | Endometrium | AEH | regulation of response to wounding | 32/2100 | 167/18723 | 1.69e-03 | 1.36e-02 | 32 |
| GO:00610419 | Endometrium | AEH | regulation of wound healing | 27/2100 | 134/18723 | 1.77e-03 | 1.41e-02 | 27 |
| GO:00447726 | Endometrium | AEH | mitotic cell cycle phase transition | 67/2100 | 424/18723 | 2.37e-03 | 1.78e-02 | 67 |
| GO:19028504 | Endometrium | AEH | microtubule cytoskeleton organization involved in mitosis | 28/2100 | 147/18723 | 3.46e-03 | 2.39e-02 | 28 |
| GO:00020112 | Endometrium | AEH | morphogenesis of an epithelial sheet | 14/2100 | 57/18723 | 3.48e-03 | 2.39e-02 | 14 |
| GO:00322325 | Endometrium | AEH | negative regulation of actin filament bundle assembly | 10/2100 | 35/18723 | 4.04e-03 | 2.69e-02 | 10 |
| GO:00516487 | Endometrium | AEH | vesicle localization | 32/2100 | 177/18723 | 4.33e-03 | 2.86e-02 | 32 |
| GO:00903074 | Endometrium | AEH | mitotic spindle assembly | 15/2100 | 65/18723 | 4.80e-03 | 3.04e-02 | 15 |
| GO:00071627 | Endometrium | AEH | negative regulation of cell adhesion | 49/2100 | 303/18723 | 5.43e-03 | 3.37e-02 | 49 |
| GO:00070524 | Endometrium | AEH | mitotic spindle organization | 23/2100 | 120/18723 | 7.01e-03 | 4.07e-02 | 23 |
| GO:00514975 | Endometrium | AEH | negative regulation of stress fiber assembly | 9/2100 | 32/18723 | 7.02e-03 | 4.07e-02 | 9 |
| GO:00705075 | Endometrium | AEH | regulation of microtubule cytoskeleton organization | 27/2100 | 148/18723 | 7.34e-03 | 4.18e-02 | 27 |
| GO:00108123 | Endometrium | AEH | negative regulation of cell-substrate adhesion | 15/2100 | 68/18723 | 7.45e-03 | 4.23e-02 | 15 |
| GO:001081016 | Endometrium | EEC | regulation of cell-substrate adhesion | 63/2168 | 221/18723 | 5.17e-12 | 8.85e-10 | 63 |
| GO:003158915 | Endometrium | EEC | cell-substrate adhesion | 87/2168 | 363/18723 | 1.95e-11 | 3.00e-09 | 87 |
| Page: 1 2 3 4 5 6 7 8 9 10 11 12 13 14 15 16 17 18 19 20 21 22 23 24 25 26 27 28 29 30 31 32 33 34 35 36 37 |
| Pathway ID | Tissue | Disease Stage | Description | Gene Ratio | Bg Ratio | pvalue | p.adjust | qvalue | Count |
| Page: 1 |
Top |
Cell-cell communication analysis |
| Identification of potential cell-cell interactions between two cell types and their ligand-receptor pairs for different disease states |
| Ligand | Receptor | LRpair | Pathway | Tissue | Disease Stage |
| Page: 1 |
Top |
Single-cell gene regulatory network inference analysis |
| Find out the significant the regulons (TFs) and the target genes of each regulon across cell types for different disease states |
| TF | Cell Type | Tissue | Disease Stage | Target Gene | RSS | Regulon Activity |
| ∗The dot plots of a searched regulon are shown for all cell subpopulations in each disease state of each tissue based on the regulon specific score inferred using pySCENIC and by calculating the average expression. |
| Page: 1 |
Top |
Somatic mutation of malignant transformation related genes |
| Annotation of somatic variants for genes involved in malignant transformation |
| Hugo Symbol | Variant Class | Variant Classification | dbSNP RS | HGVSc | HGVSp | HGVSp Short | SWISSPROT | BIOTYPE | SIFT | PolyPhen | Tumor Sample Barcode | Tissue | Histology | Sex | Age | Stage | Therapy Types | Drugs | Outcome |
| CLASP2 | SNV | Missense_Mutation | c.1111N>A | p.Asp371Asn | p.D371N | protein_coding | deleterious(0.02) | probably_damaging(0.993) | TCGA-A2-A0CT-01 | Breast | breast invasive carcinoma | Female | >=65 | I/II | Chemotherapy | cytoxan | SD | ||
| CLASP2 | SNV | Missense_Mutation | c.293N>C | p.Ile98Thr | p.I98T | protein_coding | tolerated(0.23) | benign(0.234) | TCGA-A8-A09A-01 | Breast | breast invasive carcinoma | Female | <65 | I/II | Hormone Therapy | tamoxiphen | SD | ||
| CLASP2 | SNV | Missense_Mutation | c.1355T>C | p.Val452Ala | p.V452A | protein_coding | tolerated(0.06) | probably_damaging(0.954) | TCGA-A8-A09Z-01 | Breast | breast invasive carcinoma | Female | >=65 | I/II | Unknown | Unknown | SD | ||
| CLASP2 | SNV | Missense_Mutation | rs554149266 | c.1343N>A | p.Arg448Gln | p.R448Q | protein_coding | deleterious(0.01) | probably_damaging(0.964) | TCGA-AN-A046-01 | Breast | breast invasive carcinoma | Female | >=65 | I/II | Unknown | Unknown | SD | |
| CLASP2 | SNV | Missense_Mutation | novel | c.3842G>T | p.Gly1281Val | p.G1281V | protein_coding | deleterious(0.03) | possibly_damaging(0.531) | TCGA-AR-A2LE-01 | Breast | breast invasive carcinoma | Female | >=65 | I/II | Hormone Therapy | tamoxiphen | PD | |
| CLASP2 | SNV | Missense_Mutation | novel | c.179N>A | p.Gly60Glu | p.G60E | protein_coding | deleterious(0.01) | probably_damaging(0.998) | TCGA-B6-A0I8-01 | Breast | breast invasive carcinoma | Female | <65 | I/II | Unknown | Unknown | PD | |
| CLASP2 | SNV | Missense_Mutation | c.2793N>A | p.Met931Ile | p.M931I | protein_coding | deleterious(0.01) | benign(0.233) | TCGA-BH-A18T-01 | Breast | breast invasive carcinoma | Female | >=65 | I/II | Unknown | Unknown | PD | ||
| CLASP2 | SNV | Missense_Mutation | c.2897C>G | p.Ser966Cys | p.S966C | protein_coding | deleterious(0.03) | possibly_damaging(0.54) | TCGA-D8-A73U-01 | Breast | breast invasive carcinoma | Female | >=65 | I/II | Hormone Therapy | tamoxiphen | SD | ||
| CLASP2 | SNV | Missense_Mutation | novel | c.2311N>G | p.Leu771Val | p.L771V | protein_coding | tolerated(0.17) | possibly_damaging(0.875) | TCGA-E2-A14V-01 | Breast | breast invasive carcinoma | Female | <65 | I/II | Chemotherapy | cyclophosphamide | SD | |
| CLASP2 | insertion | Nonsense_Mutation | novel | c.2873_2874insCTAGGGATGAGGCCTACATGACCATGGTG | p.Met958IlefsTer2 | p.M958Ifs*2 | protein_coding | TCGA-AO-A03R-01 | Breast | breast invasive carcinoma | Female | <65 | I/II | Chemotherapy | doxorubicin | SD |
| Page: 1 2 3 4 5 6 7 8 9 10 11 12 13 14 15 |
Top |
Related drugs of malignant transformation related genes |
| Identification of chemicals and drugs interact with genes involved in malignant transfromation |
| (DGIdb 4.0) |
| Entrez ID | Symbol | Category | Interaction Types | Drug Claim Name | Drug Name | PMIDs |
| Page: 1 |

Copyright 2023-Present -The University of Texas Health Science Center at Houston |