
|
|||||
|
 | |
| |
| |
| |
| |
| |
|
Gene: ARL6IP5 |
Gene summary for ARL6IP5 |
| Gene information | Species | Human | Gene symbol | ARL6IP5 | Gene ID | 10550 |
| Gene name | ADP ribosylation factor like GTPase 6 interacting protein 5 | |
| Gene Alias | DERP11 | |
| Cytomap | 3p14.1 | |
| Gene Type | protein-coding | GO ID | GO:0000165 | UniProtAcc | A0A024R371 |
Top |
Malignant transformation analysis |
| Identification of the aberrant gene expression in precancerous and cancerous lesions by comparing the gene expression of stem-like cells in diseased tissues with normal stem cells |
| Entrez ID | Symbol | Replicates | Species | Organ | Tissue | Adj P-value | Log2FC | Malignancy |
| 10550 | ARL6IP5 | GSM4909285 | Human | Breast | IDC | 8.05e-05 | 3.47e-01 | 0.21 |
| 10550 | ARL6IP5 | GSM4909286 | Human | Breast | IDC | 8.27e-14 | -3.38e-01 | 0.1081 |
| 10550 | ARL6IP5 | GSM4909291 | Human | Breast | IDC | 1.36e-05 | -4.21e-01 | 0.1753 |
| 10550 | ARL6IP5 | GSM4909294 | Human | Breast | IDC | 7.19e-05 | -2.15e-01 | 0.2022 |
| 10550 | ARL6IP5 | GSM4909296 | Human | Breast | IDC | 7.35e-21 | -4.30e-01 | 0.1524 |
| 10550 | ARL6IP5 | GSM4909297 | Human | Breast | IDC | 1.84e-23 | -3.04e-01 | 0.1517 |
| 10550 | ARL6IP5 | GSM4909301 | Human | Breast | IDC | 4.28e-07 | -3.57e-01 | 0.1577 |
| 10550 | ARL6IP5 | GSM4909309 | Human | Breast | IDC | 3.05e-03 | -2.72e-01 | 0.0483 |
| 10550 | ARL6IP5 | GSM4909311 | Human | Breast | IDC | 3.91e-46 | -4.77e-01 | 0.1534 |
| 10550 | ARL6IP5 | GSM4909312 | Human | Breast | IDC | 3.05e-15 | -2.26e-01 | 0.1552 |
| 10550 | ARL6IP5 | GSM4909313 | Human | Breast | IDC | 6.07e-04 | -9.69e-02 | 0.0391 |
| 10550 | ARL6IP5 | GSM4909316 | Human | Breast | IDC | 1.50e-02 | -3.89e-01 | 0.21 |
| 10550 | ARL6IP5 | GSM4909318 | Human | Breast | IDC | 2.87e-07 | -6.06e-01 | 0.2031 |
| 10550 | ARL6IP5 | GSM4909319 | Human | Breast | IDC | 3.42e-46 | -5.26e-01 | 0.1563 |
| 10550 | ARL6IP5 | GSM4909320 | Human | Breast | IDC | 2.28e-12 | -4.88e-01 | 0.1575 |
| 10550 | ARL6IP5 | GSM4909321 | Human | Breast | IDC | 1.27e-27 | -5.22e-01 | 0.1559 |
| 10550 | ARL6IP5 | brca10 | Human | Breast | Precancer | 1.43e-02 | -3.06e-01 | -0.0029 |
| 10550 | ARL6IP5 | M2 | Human | Breast | IDC | 1.03e-02 | -4.58e-01 | 0.21 |
| 10550 | ARL6IP5 | NCCBC11 | Human | Breast | DCIS | 1.87e-04 | -1.11e-01 | 0.1232 |
| 10550 | ARL6IP5 | NCCBC14 | Human | Breast | DCIS | 1.86e-18 | -5.66e-02 | 0.2021 |
| Page: 1 2 3 4 5 6 7 8 9 10 11 |
| Tissue | Expression Dynamics | Abbreviation |
| Breast | 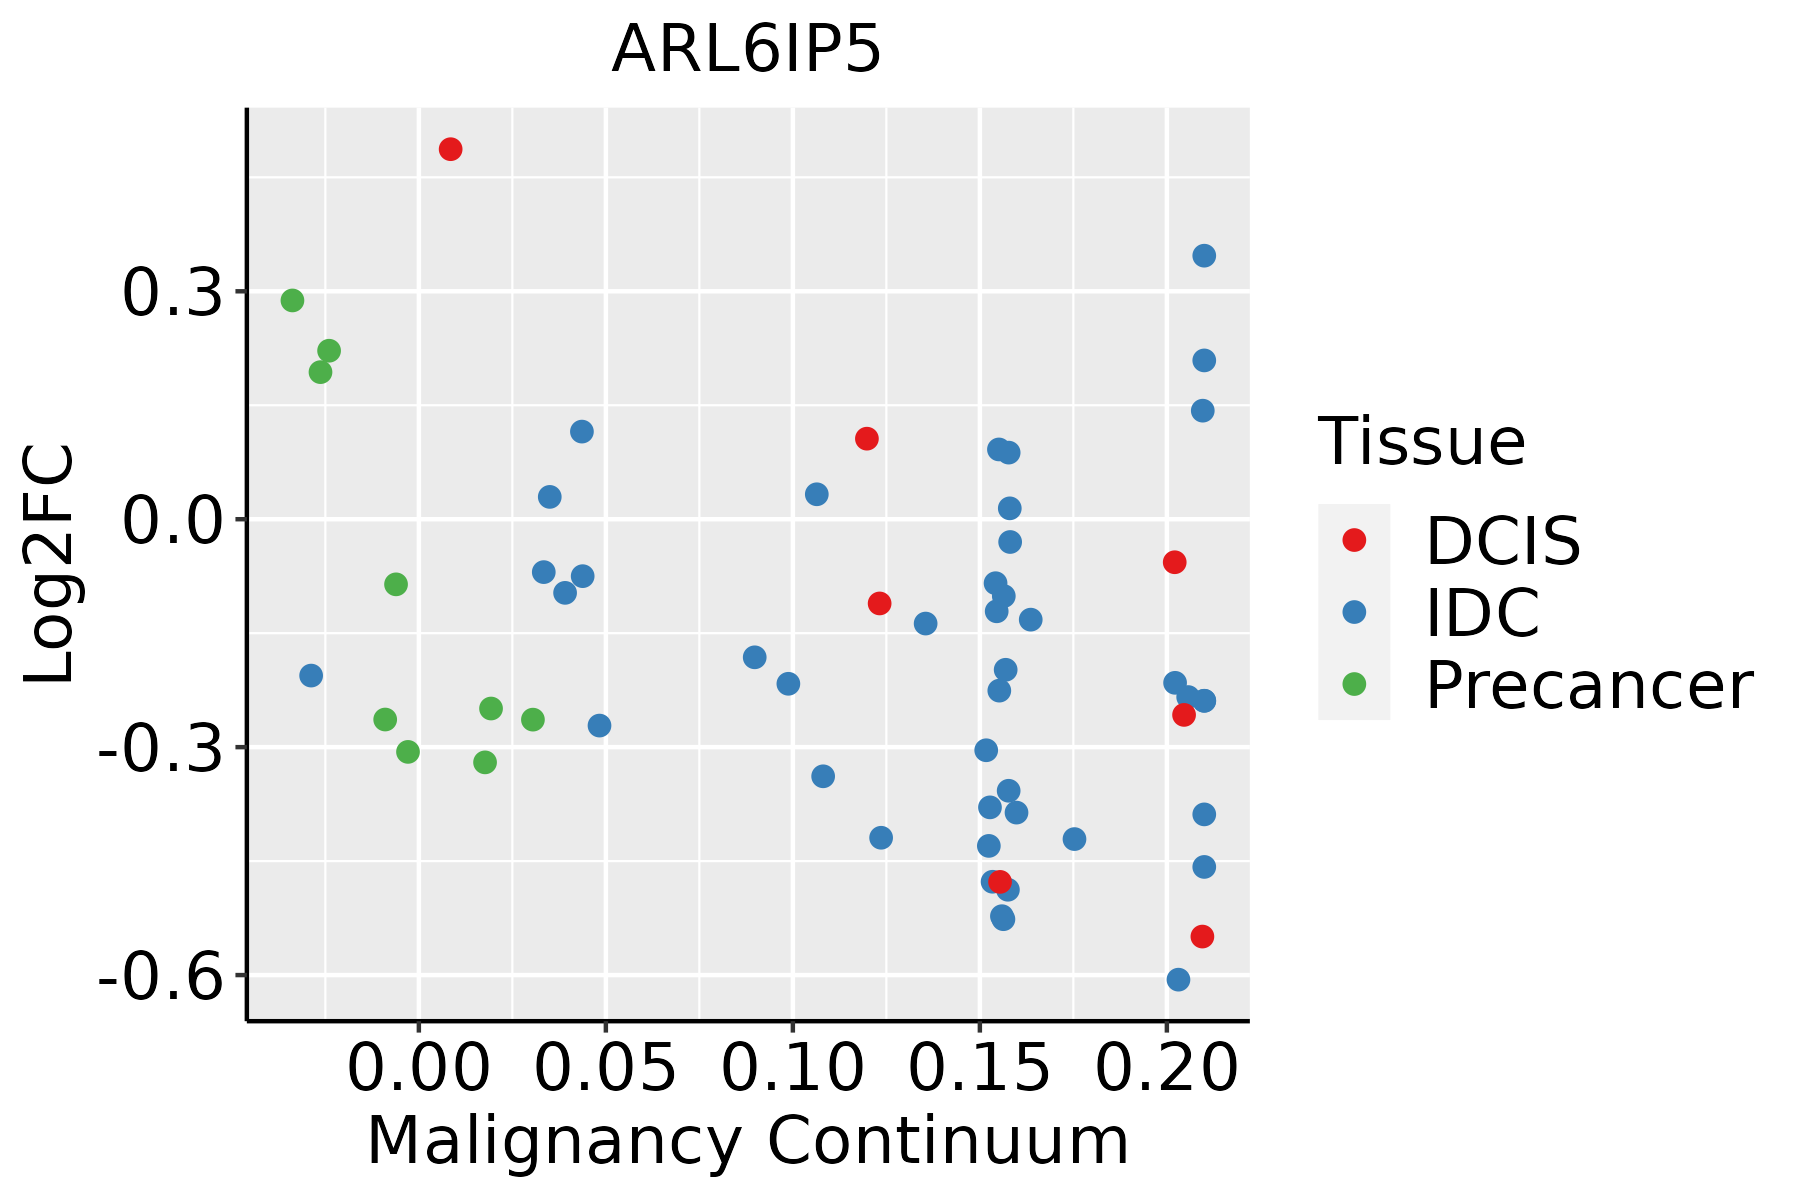 | IDC: Invasive ductal carcinoma |
| DCIS: Ductal carcinoma in situ | ||
| Precancer(BRCA1-mut): Precancerous lesion from BRCA1 mutation carriers | ||
| Cervix |  | CC: Cervix cancer |
| HSIL_HPV: HPV-infected high-grade squamous intraepithelial lesions | ||
| N_HPV: HPV-infected normal cervix | ||
| Colorectum (GSE201348) |  | FAP: Familial adenomatous polyposis |
| CRC: Colorectal cancer | ||
| Colorectum (HTA11) | 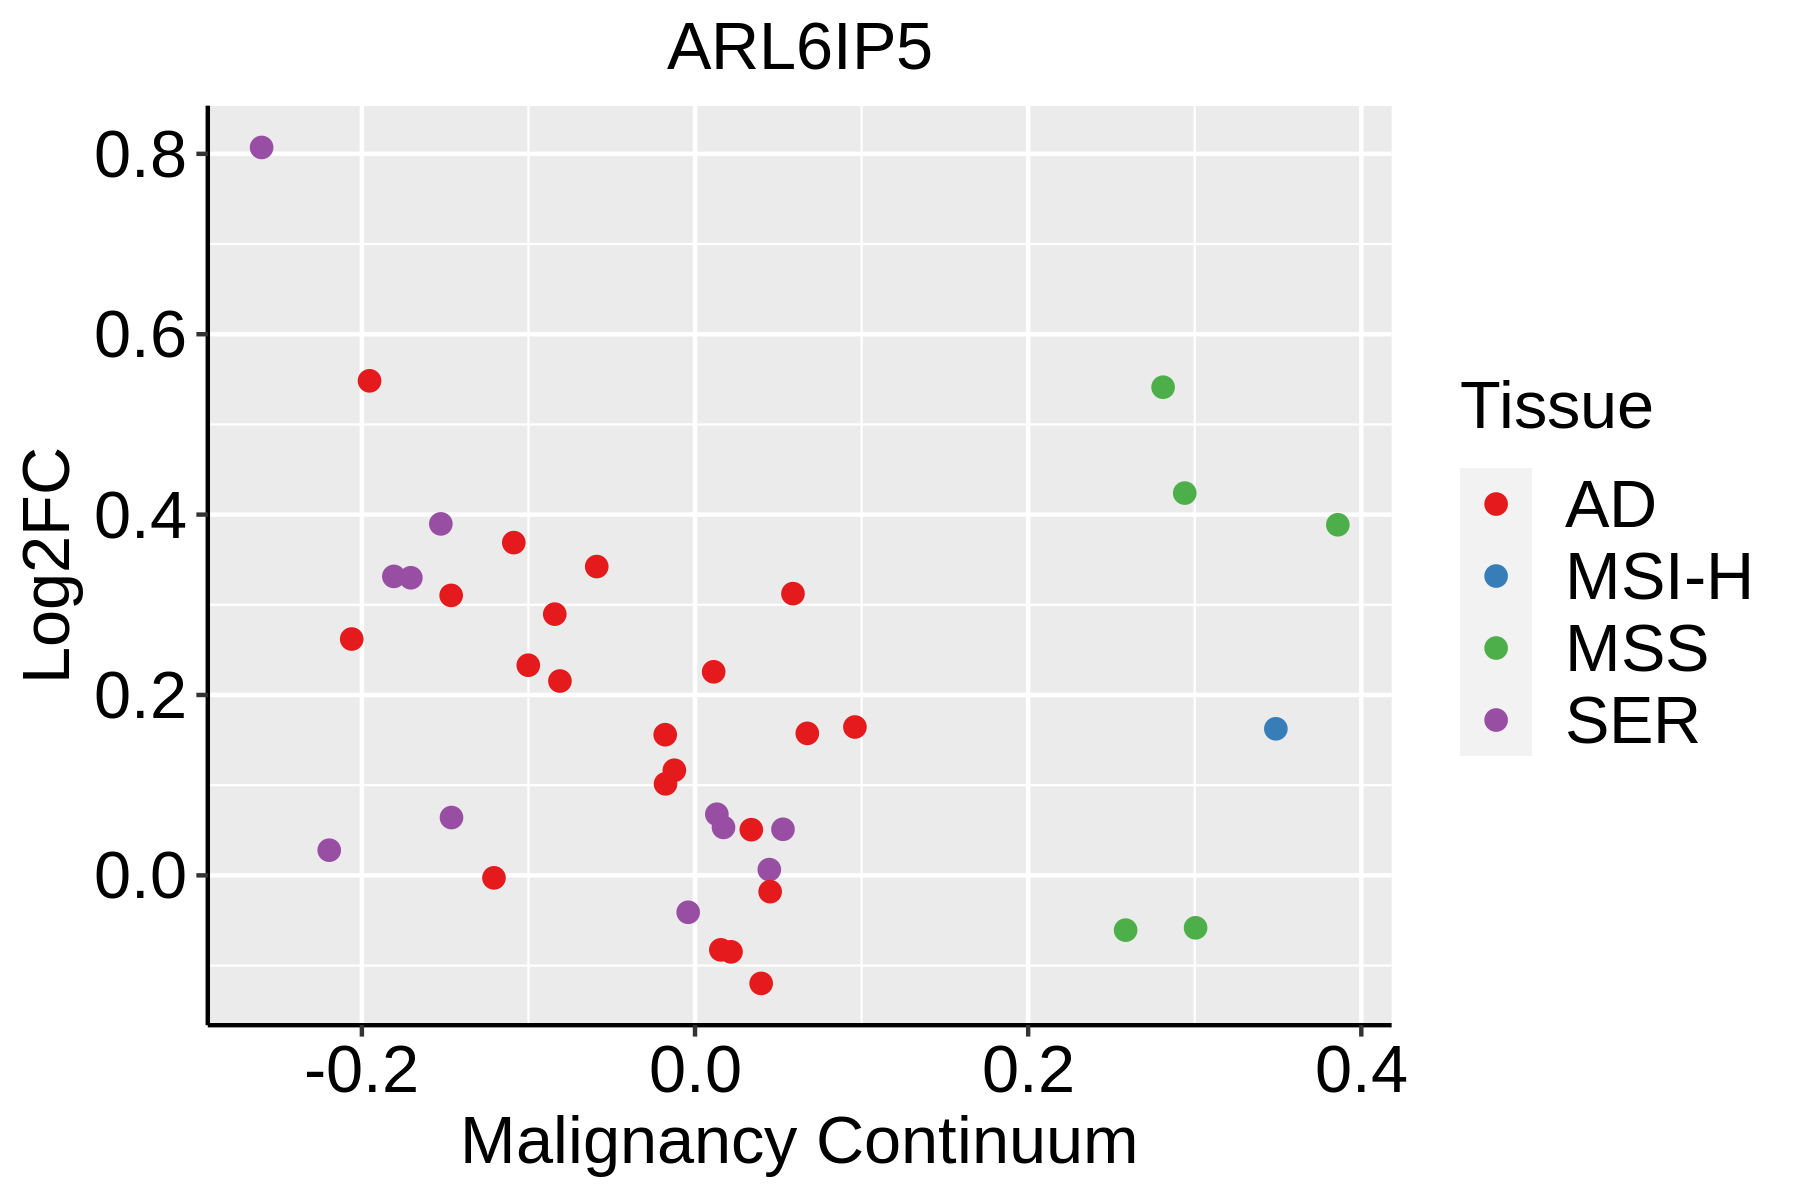 | AD: Adenomas |
| SER: Sessile serrated lesions | ||
| MSI-H: Microsatellite-high colorectal cancer | ||
| MSS: Microsatellite stable colorectal cancer | ||
| Endometrium | 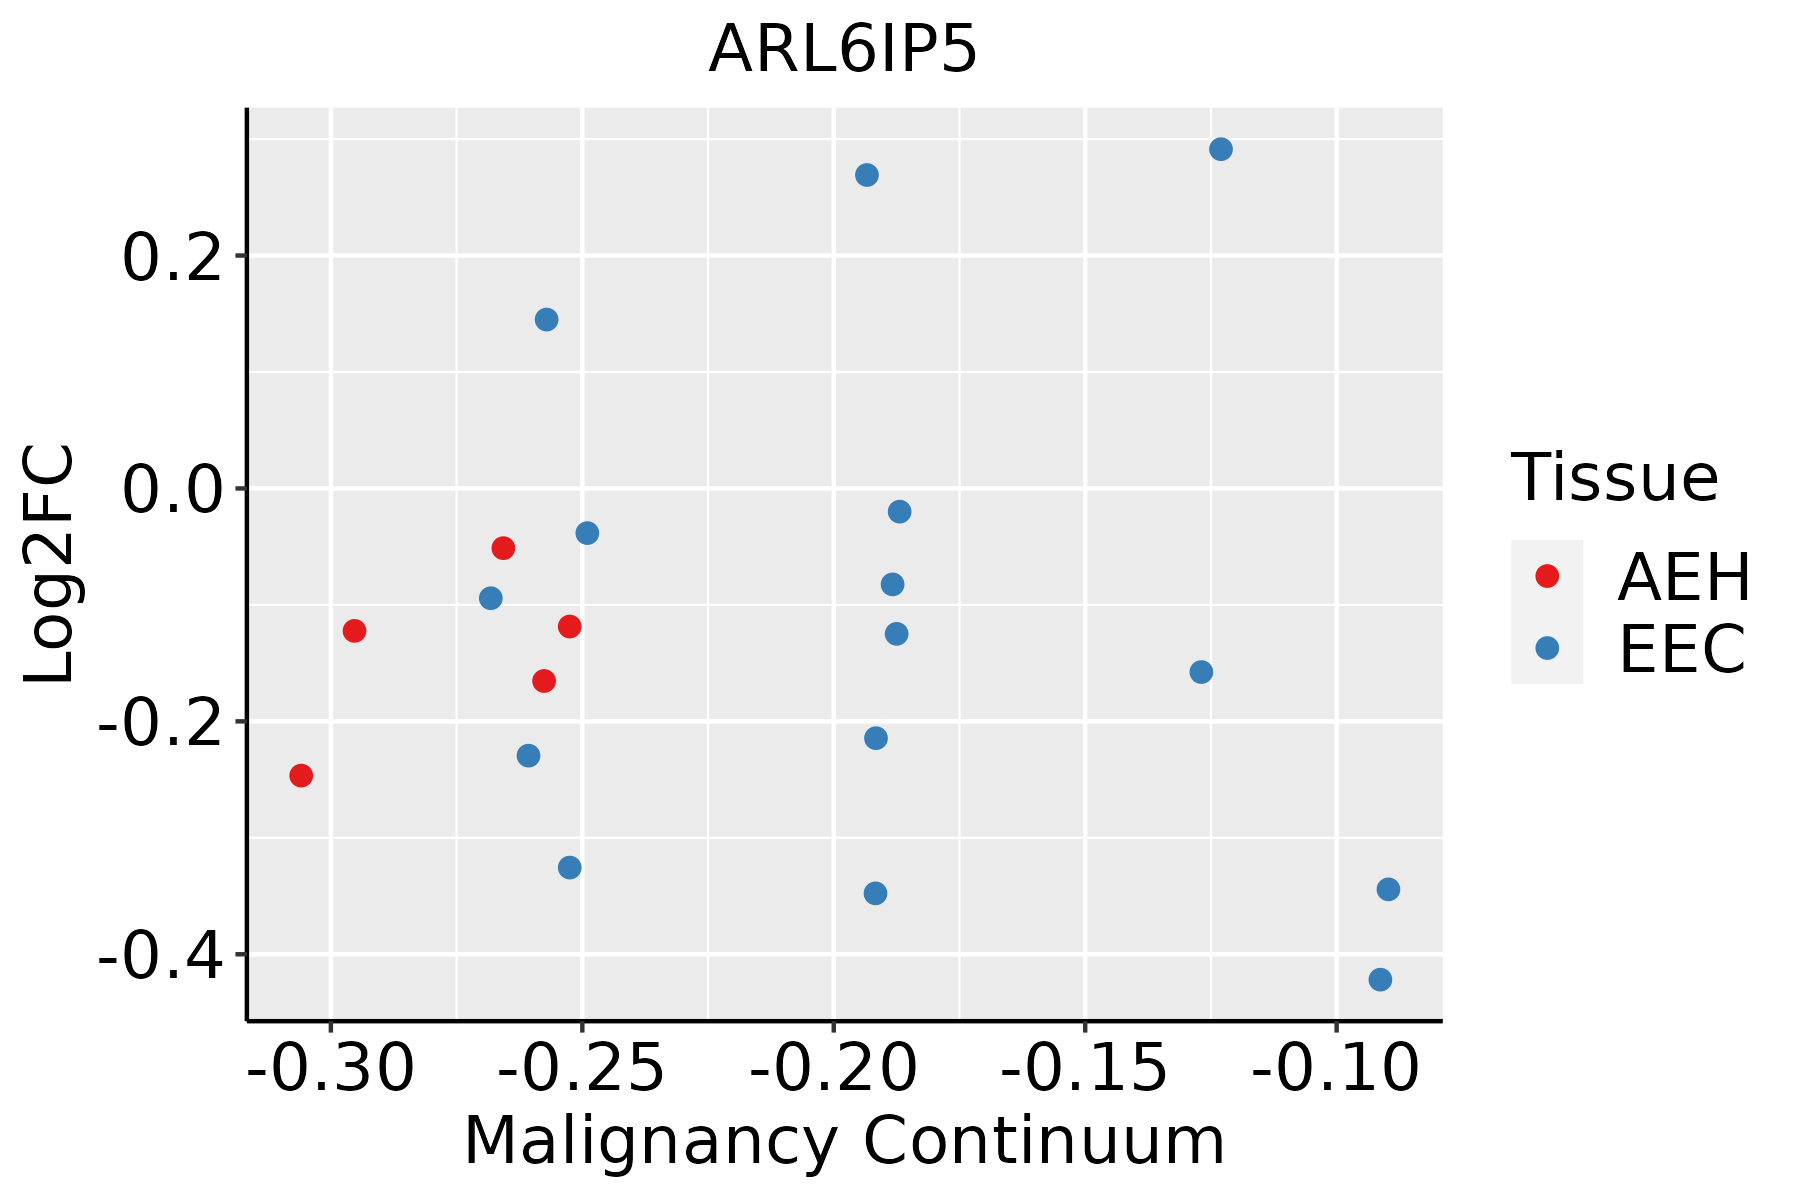 | AEH: Atypical endometrial hyperplasia |
| EEC: Endometrioid Cancer | ||
| Esophagus |  | ESCC: Esophageal squamous cell carcinoma |
| HGIN: High-grade intraepithelial neoplasias | ||
| LGIN: Low-grade intraepithelial neoplasias | ||
| Liver | 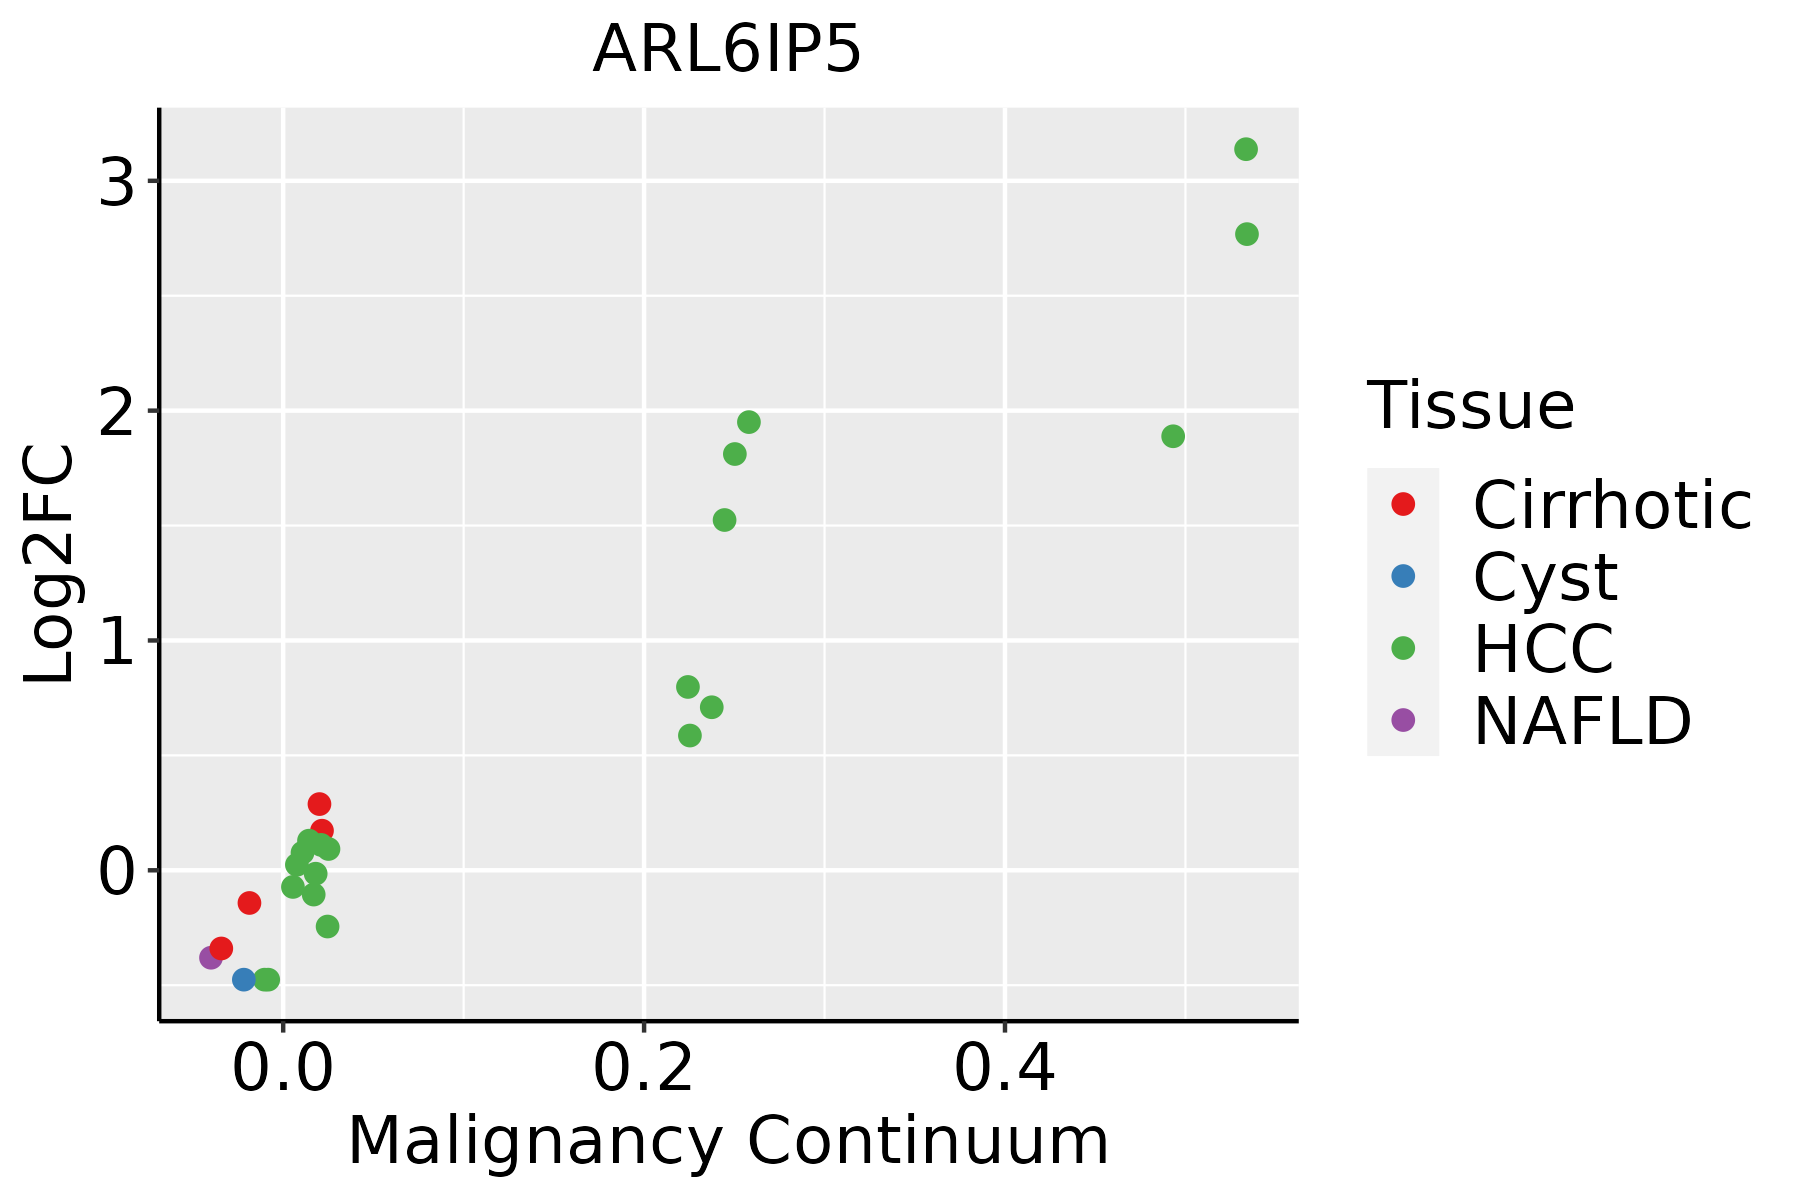 | HCC: Hepatocellular carcinoma |
| NAFLD: Non-alcoholic fatty liver disease | ||
| Oral Cavity | 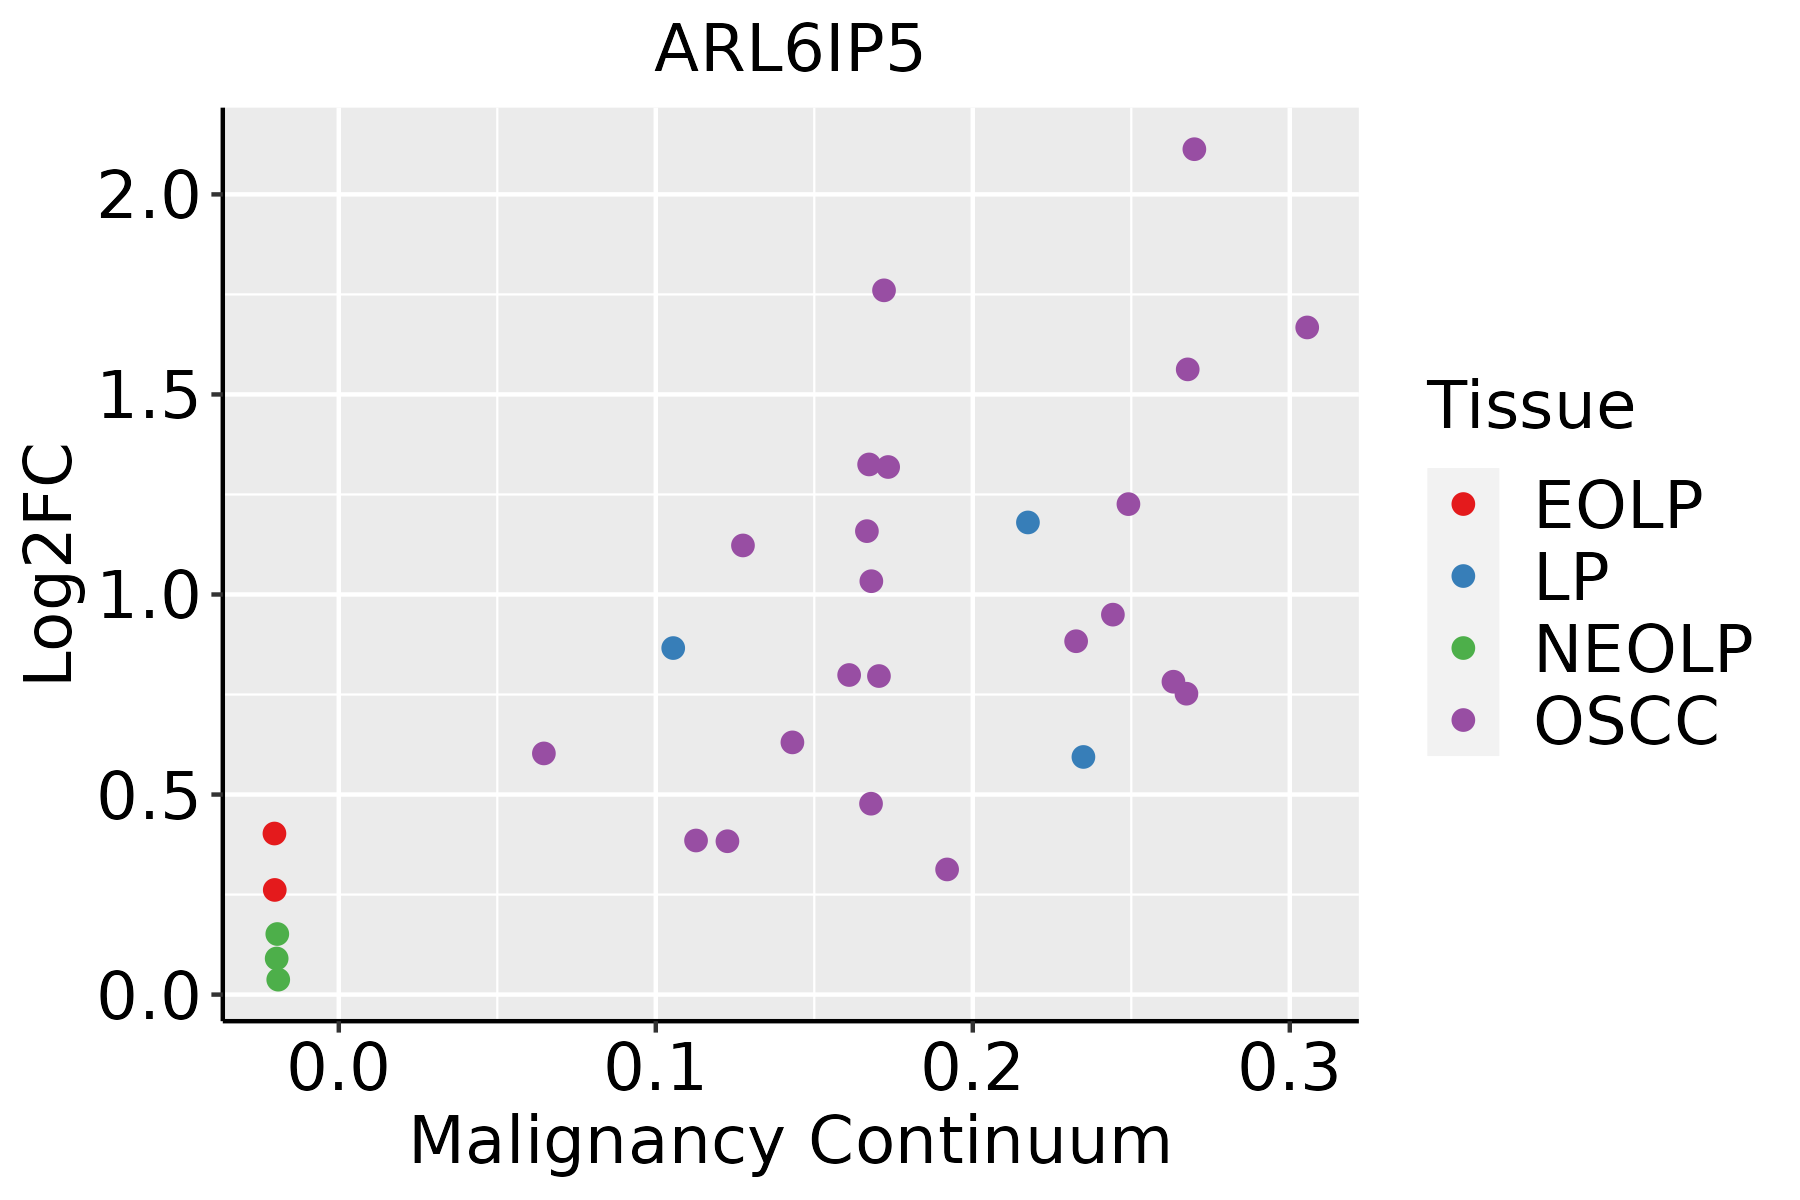 | EOLP: Erosive Oral lichen planus |
| LP: leukoplakia | ||
| NEOLP: Non-erosive oral lichen planus | ||
| OSCC: Oral squamous cell carcinoma | ||
| Prostate |  | BPH: Benign Prostatic Hyperplasia |
| Skin |  | AK: Actinic keratosis |
| cSCC: Cutaneous squamous cell carcinoma | ||
| SCCIS:squamous cell carcinoma in situ | ||
| Thyroid | 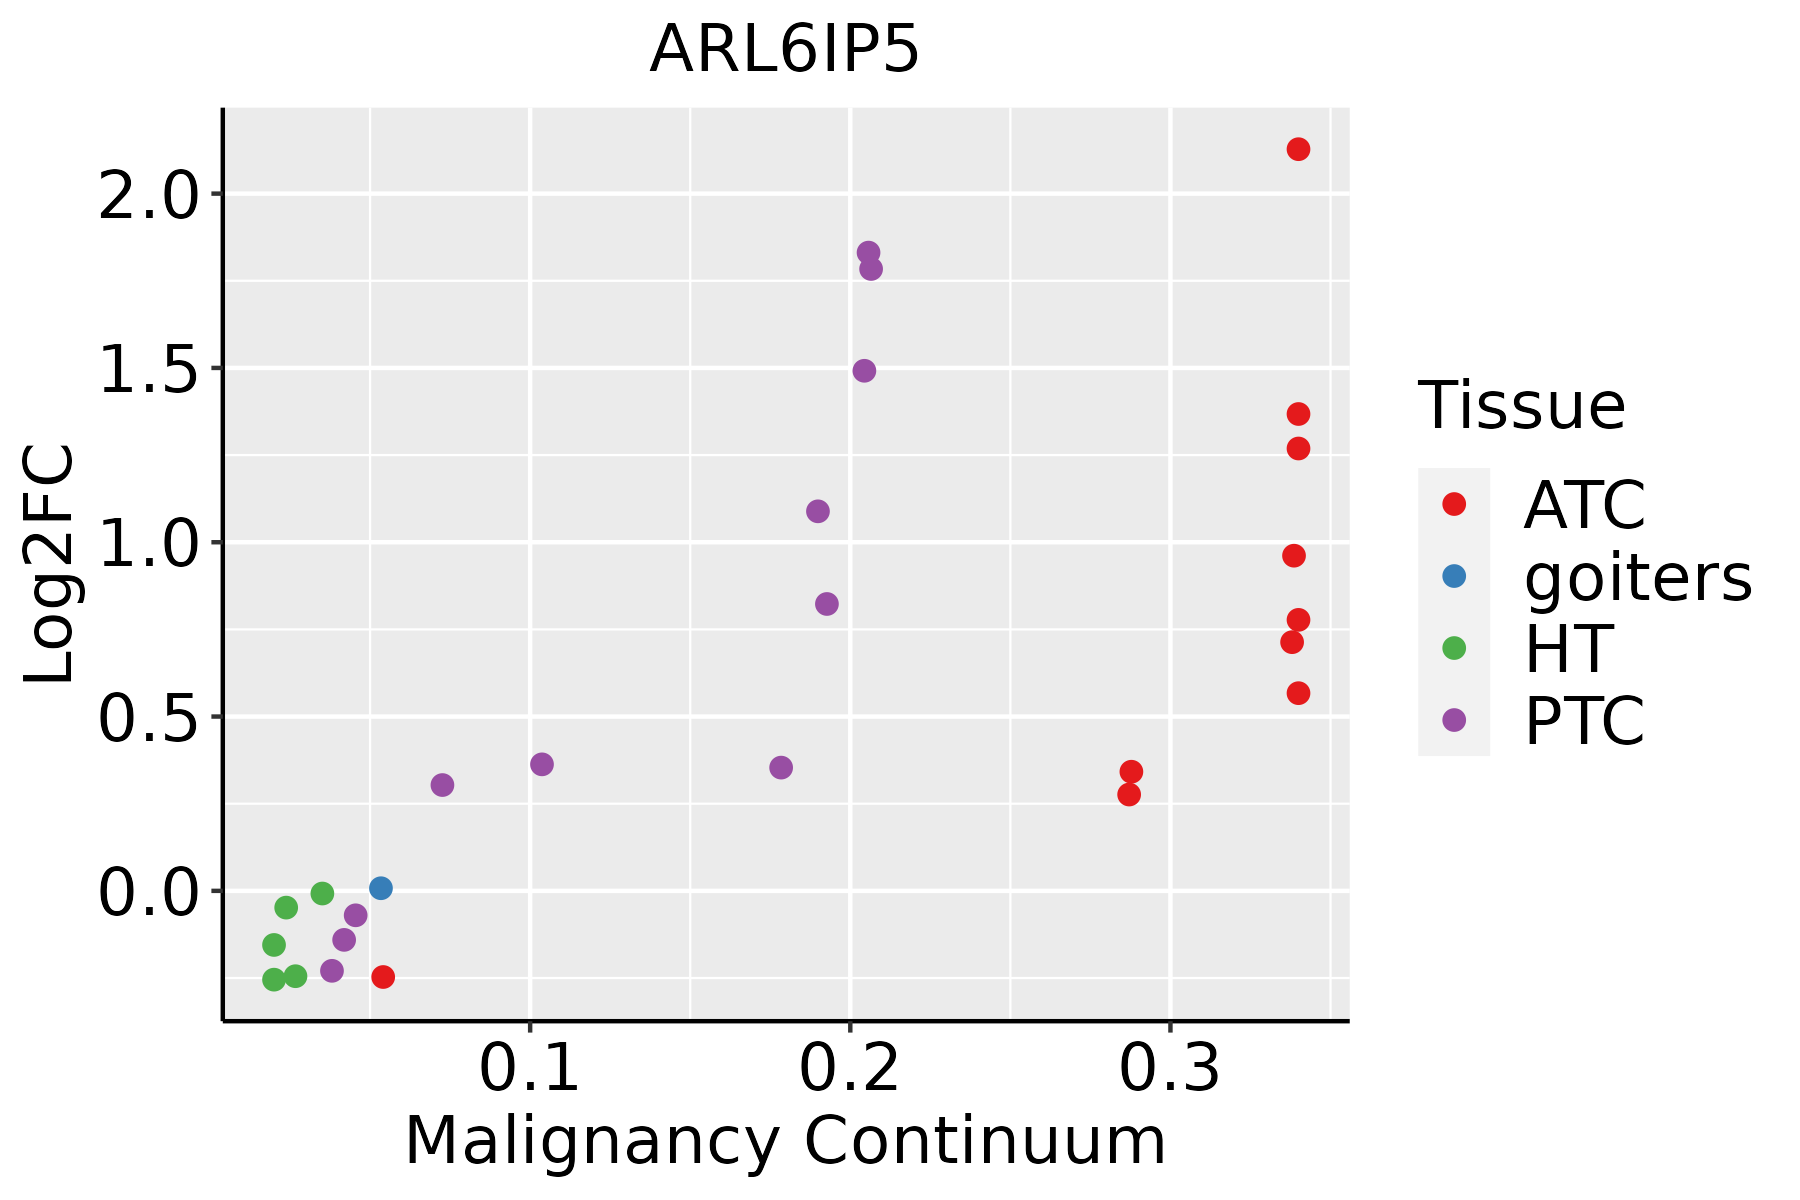 | ATC: Anaplastic thyroid cancer |
| HT: Hashimoto's thyroiditis | ||
| PTC: Papillary thyroid cancer |
| ∗log2FC in expression of this searched gene in stem-like cells from each diseased tissue sample relative to stem-like cells in normal samples in each tissue plotted against the malignancy continuum. Samples are colored based on if they are from different disease stage. |
Top |
Malignant transformation related pathway analysis |
| Find out the enriched GO biological processes and KEGG pathways involved in transition from healthy to precancer to cancer |
| Tissue | Disease Stage | Enriched GO biological Processes |
| Colorectum | AD |  |
| Colorectum | SER |  |
| Colorectum | MSS |  |
| Colorectum | MSI-H |  |
| Colorectum | FAP |  |
| ∗Top 15 enriched GO BP terms are showed in the bar plot of each disease state in each tissue. Each row represents a significant GO biological process which is colored according to the -log10(p.adjust). |
| Page: 1 2 3 4 5 6 7 8 9 |
| GO ID | Tissue | Disease Stage | Description | Gene Ratio | Bg Ratio | pvalue | p.adjust | Count |
| GO:003109812 | Liver | Cirrhotic | stress-activated protein kinase signaling cascade | 83/4634 | 247/18723 | 1.04e-03 | 7.28e-03 | 83 |
| GO:005140312 | Liver | Cirrhotic | stress-activated MAPK cascade | 80/4634 | 239/18723 | 1.43e-03 | 9.54e-03 | 80 |
| GO:00067494 | Liver | Cirrhotic | glutathione metabolic process | 27/4634 | 64/18723 | 1.63e-03 | 1.05e-02 | 27 |
| GO:00518815 | Liver | Cirrhotic | regulation of mitochondrial membrane potential | 30/4634 | 74/18723 | 1.97e-03 | 1.23e-02 | 30 |
| GO:00510514 | Liver | Cirrhotic | negative regulation of transport | 141/4634 | 470/18723 | 5.06e-03 | 2.62e-02 | 141 |
| GO:007030212 | Liver | Cirrhotic | regulation of stress-activated protein kinase signaling cascade | 64/4634 | 195/18723 | 6.61e-03 | 3.27e-02 | 64 |
| GO:003287212 | Liver | Cirrhotic | regulation of stress-activated MAPK cascade | 62/4634 | 192/18723 | 1.08e-02 | 4.77e-02 | 62 |
| GO:000697922 | Liver | HCC | response to oxidative stress | 281/7958 | 446/18723 | 9.75e-19 | 1.24e-16 | 281 |
| GO:006219722 | Liver | HCC | cellular response to chemical stress | 216/7958 | 337/18723 | 6.86e-16 | 5.44e-14 | 216 |
| GO:004586222 | Liver | HCC | positive regulation of proteolysis | 232/7958 | 372/18723 | 5.66e-15 | 3.98e-13 | 232 |
| GO:000679021 | Liver | HCC | sulfur compound metabolic process | 212/7958 | 339/18723 | 5.60e-14 | 3.39e-12 | 212 |
| GO:009719322 | Liver | HCC | intrinsic apoptotic signaling pathway | 184/7958 | 288/18723 | 1.50e-13 | 8.32e-12 | 184 |
| GO:003459922 | Liver | HCC | cellular response to oxidative stress | 183/7958 | 288/18723 | 3.65e-13 | 1.93e-11 | 183 |
| GO:007265921 | Liver | HCC | protein localization to plasma membrane | 177/7958 | 284/18723 | 1.02e-11 | 4.18e-10 | 177 |
| GO:199077821 | Liver | HCC | protein localization to cell periphery | 200/7958 | 333/18723 | 6.07e-11 | 2.23e-09 | 200 |
| GO:000657521 | Liver | HCC | cellular modified amino acid metabolic process | 119/7958 | 188/18723 | 6.47e-09 | 1.67e-07 | 119 |
| GO:007099722 | Liver | HCC | neuron death | 202/7958 | 361/18723 | 1.44e-07 | 2.70e-06 | 202 |
| GO:004328112 | Liver | HCC | regulation of cysteine-type endopeptidase activity involved in apoptotic process | 125/7958 | 209/18723 | 3.12e-07 | 5.42e-06 | 125 |
| GO:200011612 | Liver | HCC | regulation of cysteine-type endopeptidase activity | 137/7958 | 235/18723 | 6.91e-07 | 1.08e-05 | 137 |
| GO:005254722 | Liver | HCC | regulation of peptidase activity | 247/7958 | 461/18723 | 8.28e-07 | 1.27e-05 | 247 |
| Page: 1 2 3 4 5 6 7 8 9 10 11 12 13 14 15 16 17 18 19 20 21 22 23 24 25 26 27 28 29 30 31 |
| Pathway ID | Tissue | Disease Stage | Description | Gene Ratio | Bg Ratio | pvalue | p.adjust | qvalue | Count |
| Page: 1 |
Top |
Cell-cell communication analysis |
| Identification of potential cell-cell interactions between two cell types and their ligand-receptor pairs for different disease states |
| Ligand | Receptor | LRpair | Pathway | Tissue | Disease Stage |
| Page: 1 |
Top |
Single-cell gene regulatory network inference analysis |
| Find out the significant the regulons (TFs) and the target genes of each regulon across cell types for different disease states |
| TF | Cell Type | Tissue | Disease Stage | Target Gene | RSS | Regulon Activity |
| ∗The dot plots of a searched regulon are shown for all cell subpopulations in each disease state of each tissue based on the regulon specific score inferred using pySCENIC and by calculating the average expression. |
| Page: 1 |
Top |
Somatic mutation of malignant transformation related genes |
| Annotation of somatic variants for genes involved in malignant transformation |
| Hugo Symbol | Variant Class | Variant Classification | dbSNP RS | HGVSc | HGVSp | HGVSp Short | SWISSPROT | BIOTYPE | SIFT | PolyPhen | Tumor Sample Barcode | Tissue | Histology | Sex | Age | Stage | Therapy Types | Drugs | Outcome |
| ARL6IP5 | SNV | Missense_Mutation | c.15C>G | p.Ile5Met | p.I5M | O75915 | protein_coding | deleterious(0.05) | benign(0.275) | TCGA-IR-A3LA-01 | Cervix | cervical & endocervical cancer | Female | <65 | I/II | Chemotherapy | cisplatin | CR | |
| ARL6IP5 | SNV | Missense_Mutation | novel | c.524G>A | p.Gly175Asp | p.G175D | O75915 | protein_coding | tolerated(0.45) | benign(0.007) | TCGA-AA-3949-01 | Colorectum | colon adenocarcinoma | Female | >=65 | III/IV | Unknown | Unknown | SD |
| ARL6IP5 | SNV | Missense_Mutation | c.162N>A | p.Met54Ile | p.M54I | O75915 | protein_coding | tolerated(0.67) | benign(0) | TCGA-AA-3977-01 | Colorectum | colon adenocarcinoma | Male | >=65 | I/II | Unknown | Unknown | SD | |
| ARL6IP5 | SNV | Missense_Mutation | rs757868106 | c.551N>A | p.Ser184Asn | p.S184N | O75915 | protein_coding | tolerated_low_confidence(0.06) | benign(0.003) | TCGA-CA-6717-01 | Colorectum | colon adenocarcinoma | Male | <65 | I/II | Chemotherapy | oxaliplatin | CR |
| ARL6IP5 | SNV | Missense_Mutation | rs367744231 | c.286N>T | p.Arg96Cys | p.R96C | O75915 | protein_coding | deleterious(0.02) | benign(0.276) | TCGA-A5-A0G2-01 | Endometrium | uterine corpus endometrioid carcinoma | Female | <65 | III/IV | Unknown | Unknown | SD |
| ARL6IP5 | SNV | Missense_Mutation | novel | c.155N>T | p.Ala52Val | p.A52V | O75915 | protein_coding | tolerated(1) | benign(0.014) | TCGA-A5-A1OF-01 | Endometrium | uterine corpus endometrioid carcinoma | Female | <65 | I/II | Unknown | Unknown | SD |
| ARL6IP5 | SNV | Missense_Mutation | rs774792987 | c.287G>A | p.Arg96His | p.R96H | O75915 | protein_coding | tolerated(0.18) | benign(0) | TCGA-AJ-A3EK-01 | Endometrium | uterine corpus endometrioid carcinoma | Female | <65 | I/II | Chemotherapy | carboplatin | CR |
| ARL6IP5 | SNV | Missense_Mutation | c.202N>A | p.Leu68Met | p.L68M | O75915 | protein_coding | tolerated(0.06) | benign(0.037) | TCGA-AP-A0LM-01 | Endometrium | uterine corpus endometrioid carcinoma | Female | <65 | III/IV | Chemotherapy | cisplatin | SD | |
| ARL6IP5 | SNV | Missense_Mutation | c.447N>T | p.Glu149Asp | p.E149D | O75915 | protein_coding | deleterious(0.03) | possibly_damaging(0.748) | TCGA-AX-A05Z-01 | Endometrium | uterine corpus endometrioid carcinoma | Female | <65 | III/IV | Chemotherapy | adriamycin | SD | |
| ARL6IP5 | SNV | Missense_Mutation | rs11542221 | c.413C>T | p.Ser138Leu | p.S138L | O75915 | protein_coding | deleterious(0.02) | probably_damaging(0.999) | TCGA-AX-A2HD-01 | Endometrium | uterine corpus endometrioid carcinoma | Female | >=65 | III/IV | Unknown | Unknown | SD |
| Page: 1 2 |
Top |
Related drugs of malignant transformation related genes |
| Identification of chemicals and drugs interact with genes involved in malignant transfromation |
| (DGIdb 4.0) |
| Entrez ID | Symbol | Category | Interaction Types | Drug Claim Name | Drug Name | PMIDs |
| Page: 1 |

Copyright 2023-Present -The University of Texas Health Science Center at Houston |