| Tissue | Expression Dynamics | Abbreviation |
| Cervix | 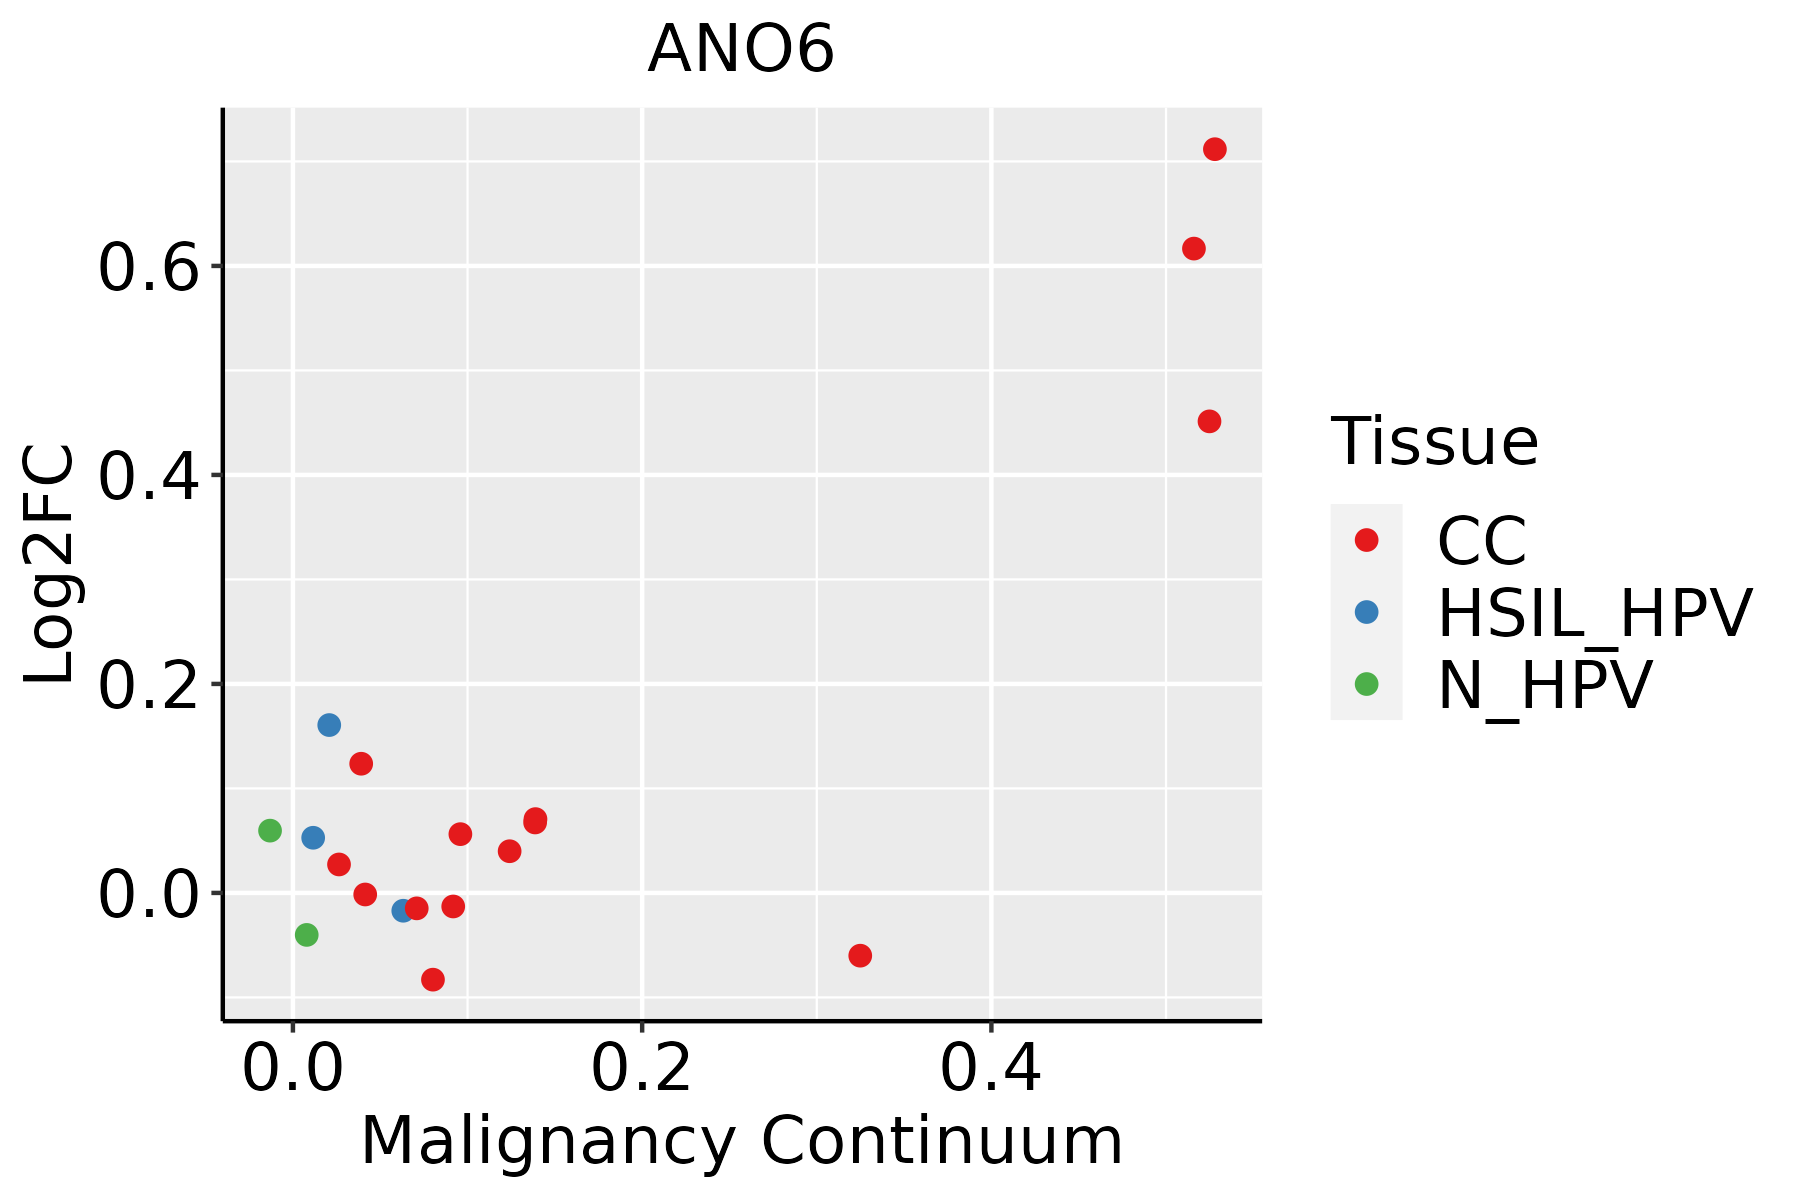 | CC: Cervix cancer |
| HSIL_HPV: HPV-infected high-grade squamous intraepithelial lesions |
| N_HPV: HPV-infected normal cervix |
| Esophagus |  | ESCC: Esophageal squamous cell carcinoma |
| HGIN: High-grade intraepithelial neoplasias |
| LGIN: Low-grade intraepithelial neoplasias |
| Liver | 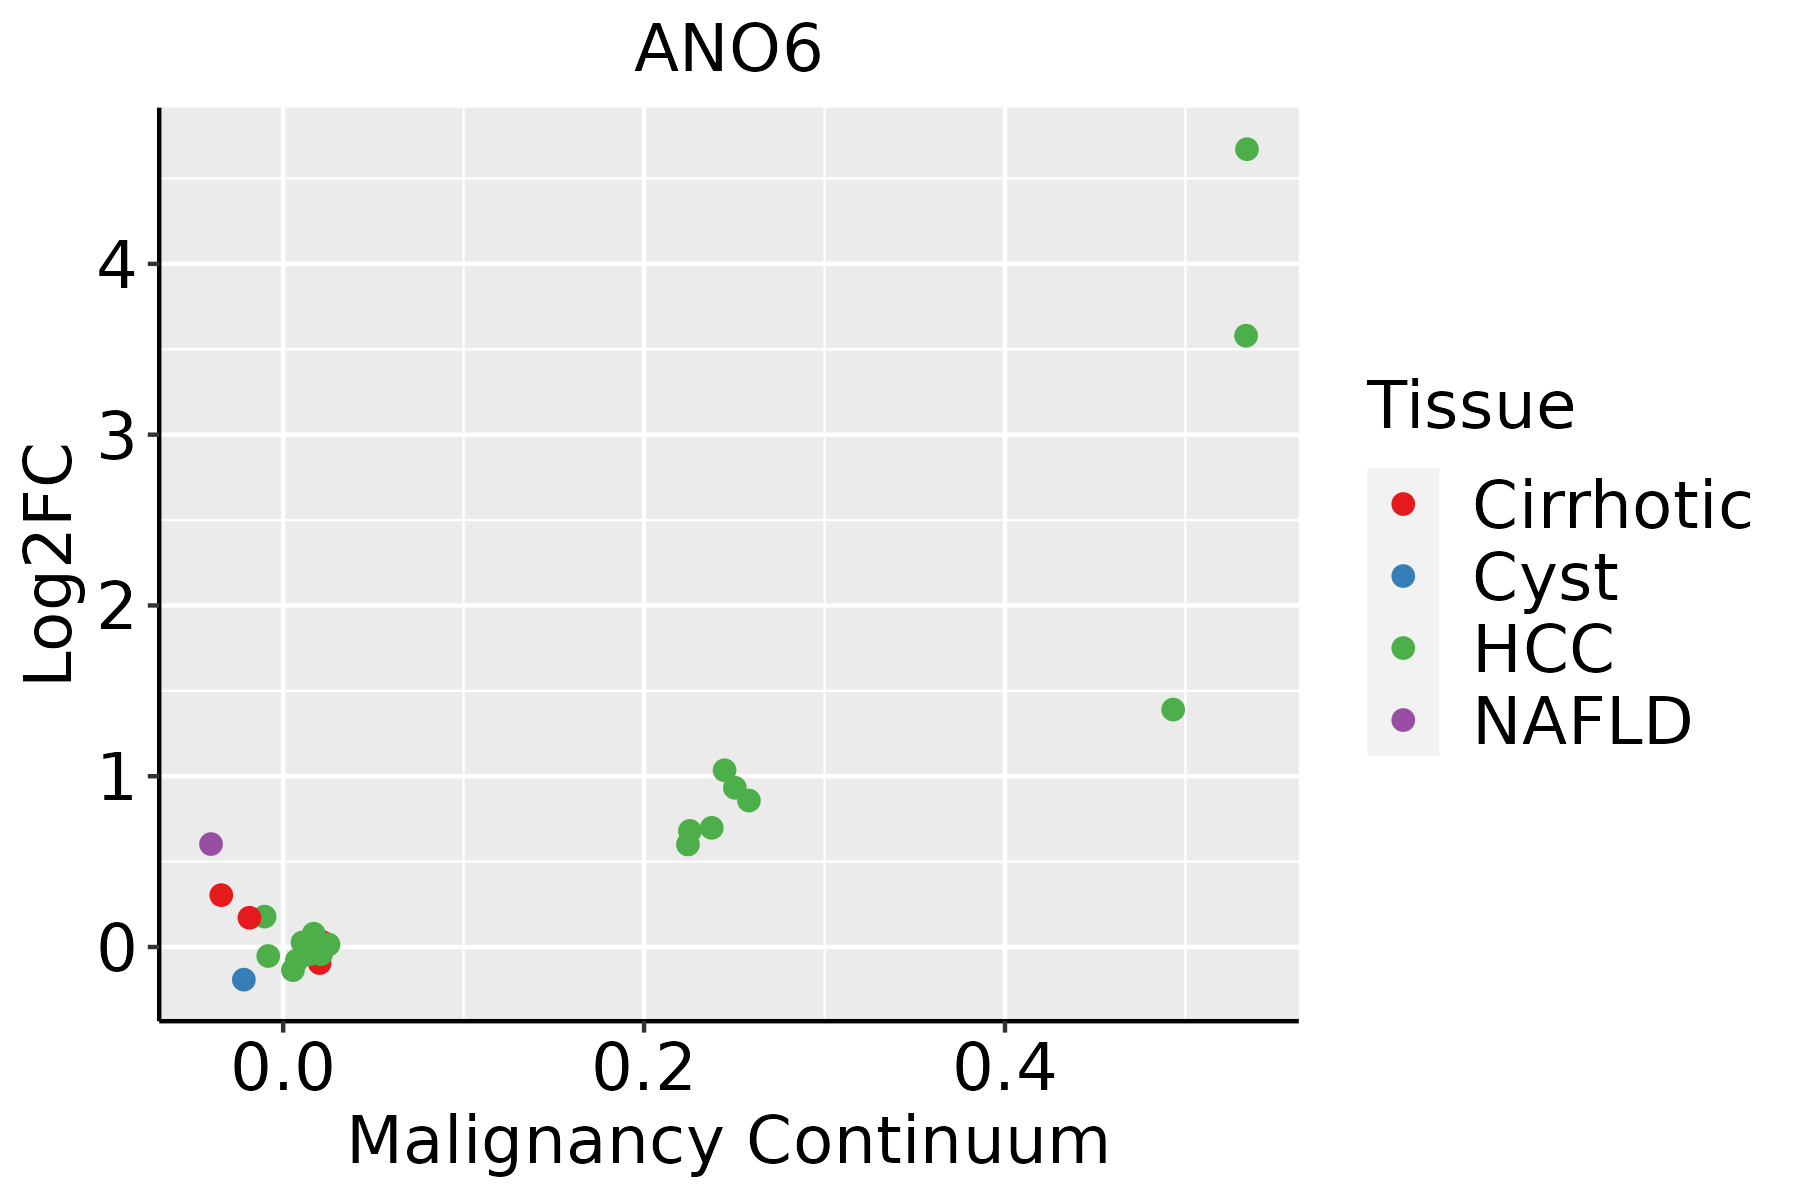 | HCC: Hepatocellular carcinoma |
| NAFLD: Non-alcoholic fatty liver disease |
| Oral Cavity | 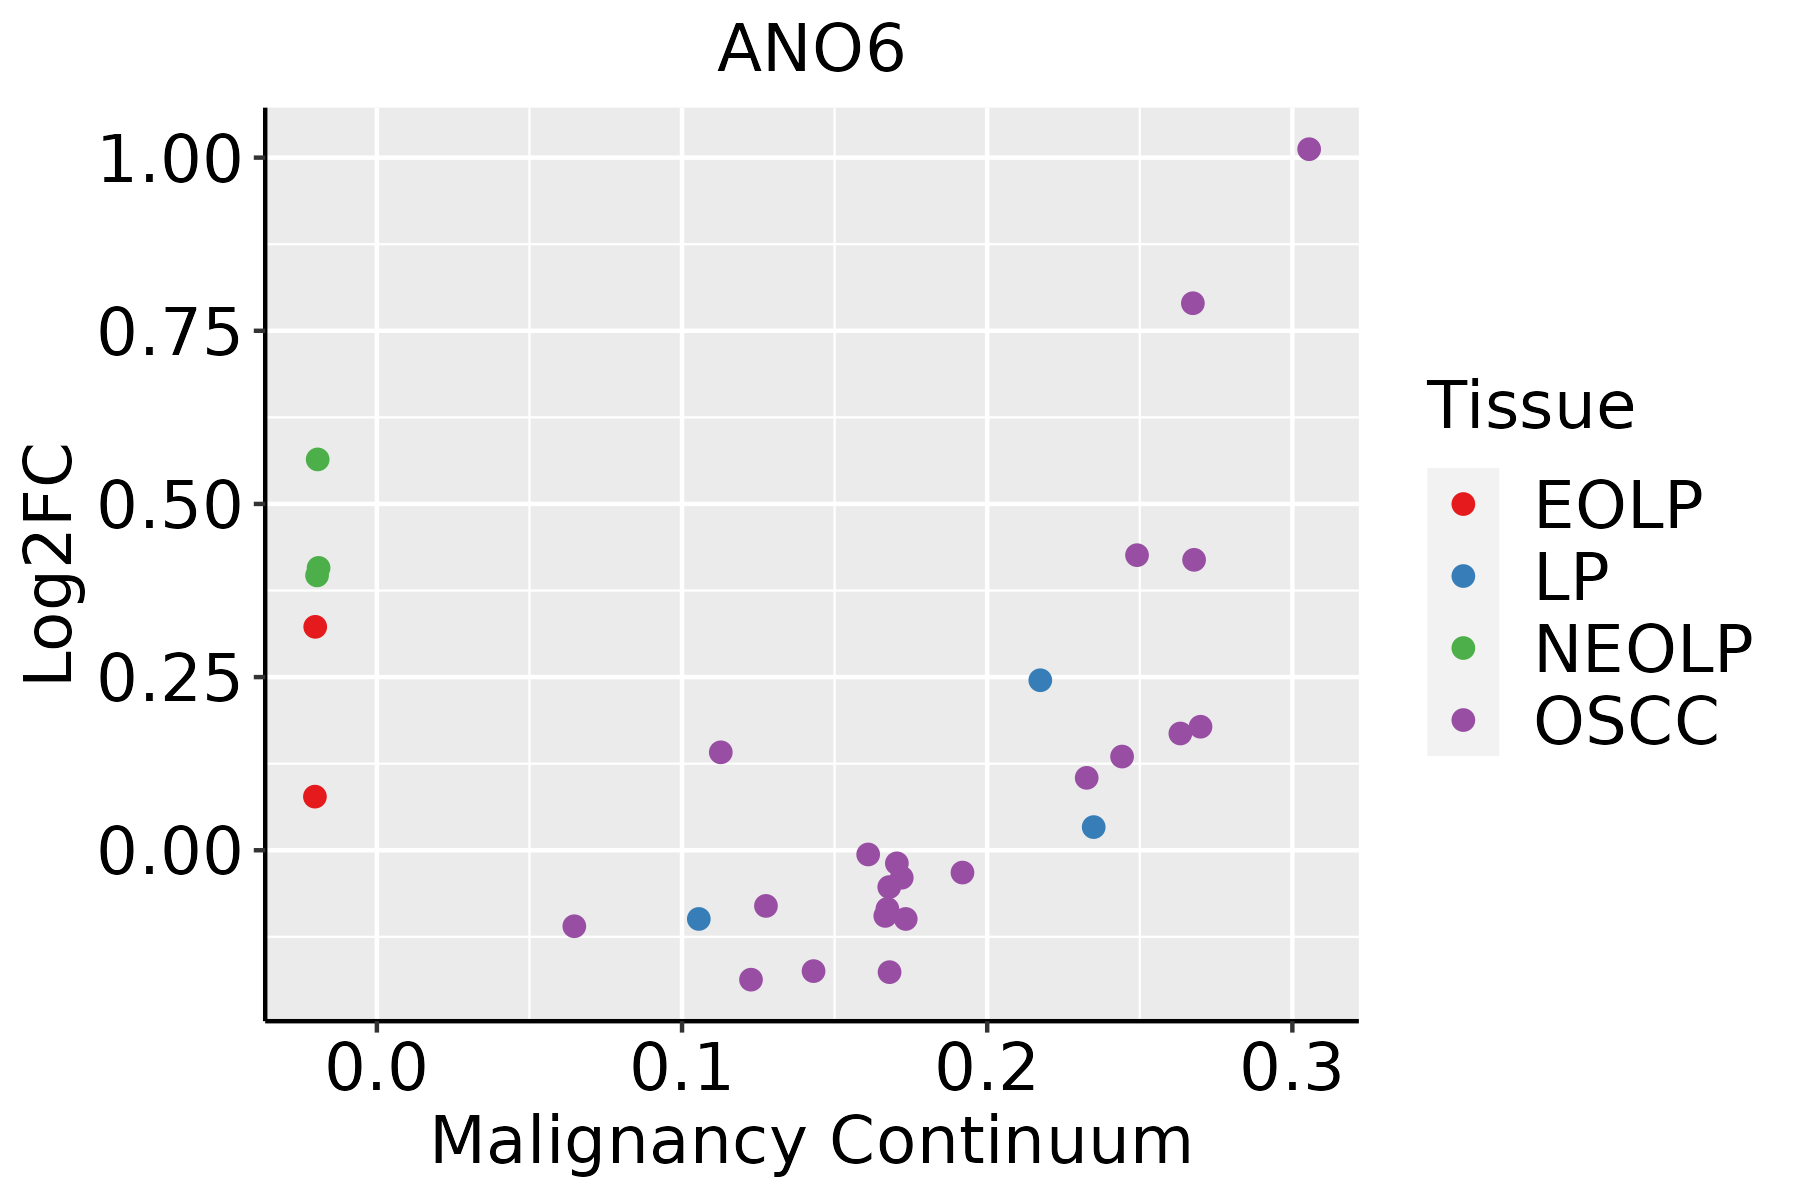 | EOLP: Erosive Oral lichen planus |
| LP: leukoplakia |
| NEOLP: Non-erosive oral lichen planus |
| OSCC: Oral squamous cell carcinoma |
| Prostate |  | BPH: Benign Prostatic Hyperplasia |
| Skin |  | AK: Actinic keratosis |
| cSCC: Cutaneous squamous cell carcinoma |
| SCCIS:squamous cell carcinoma in situ |
| Thyroid | 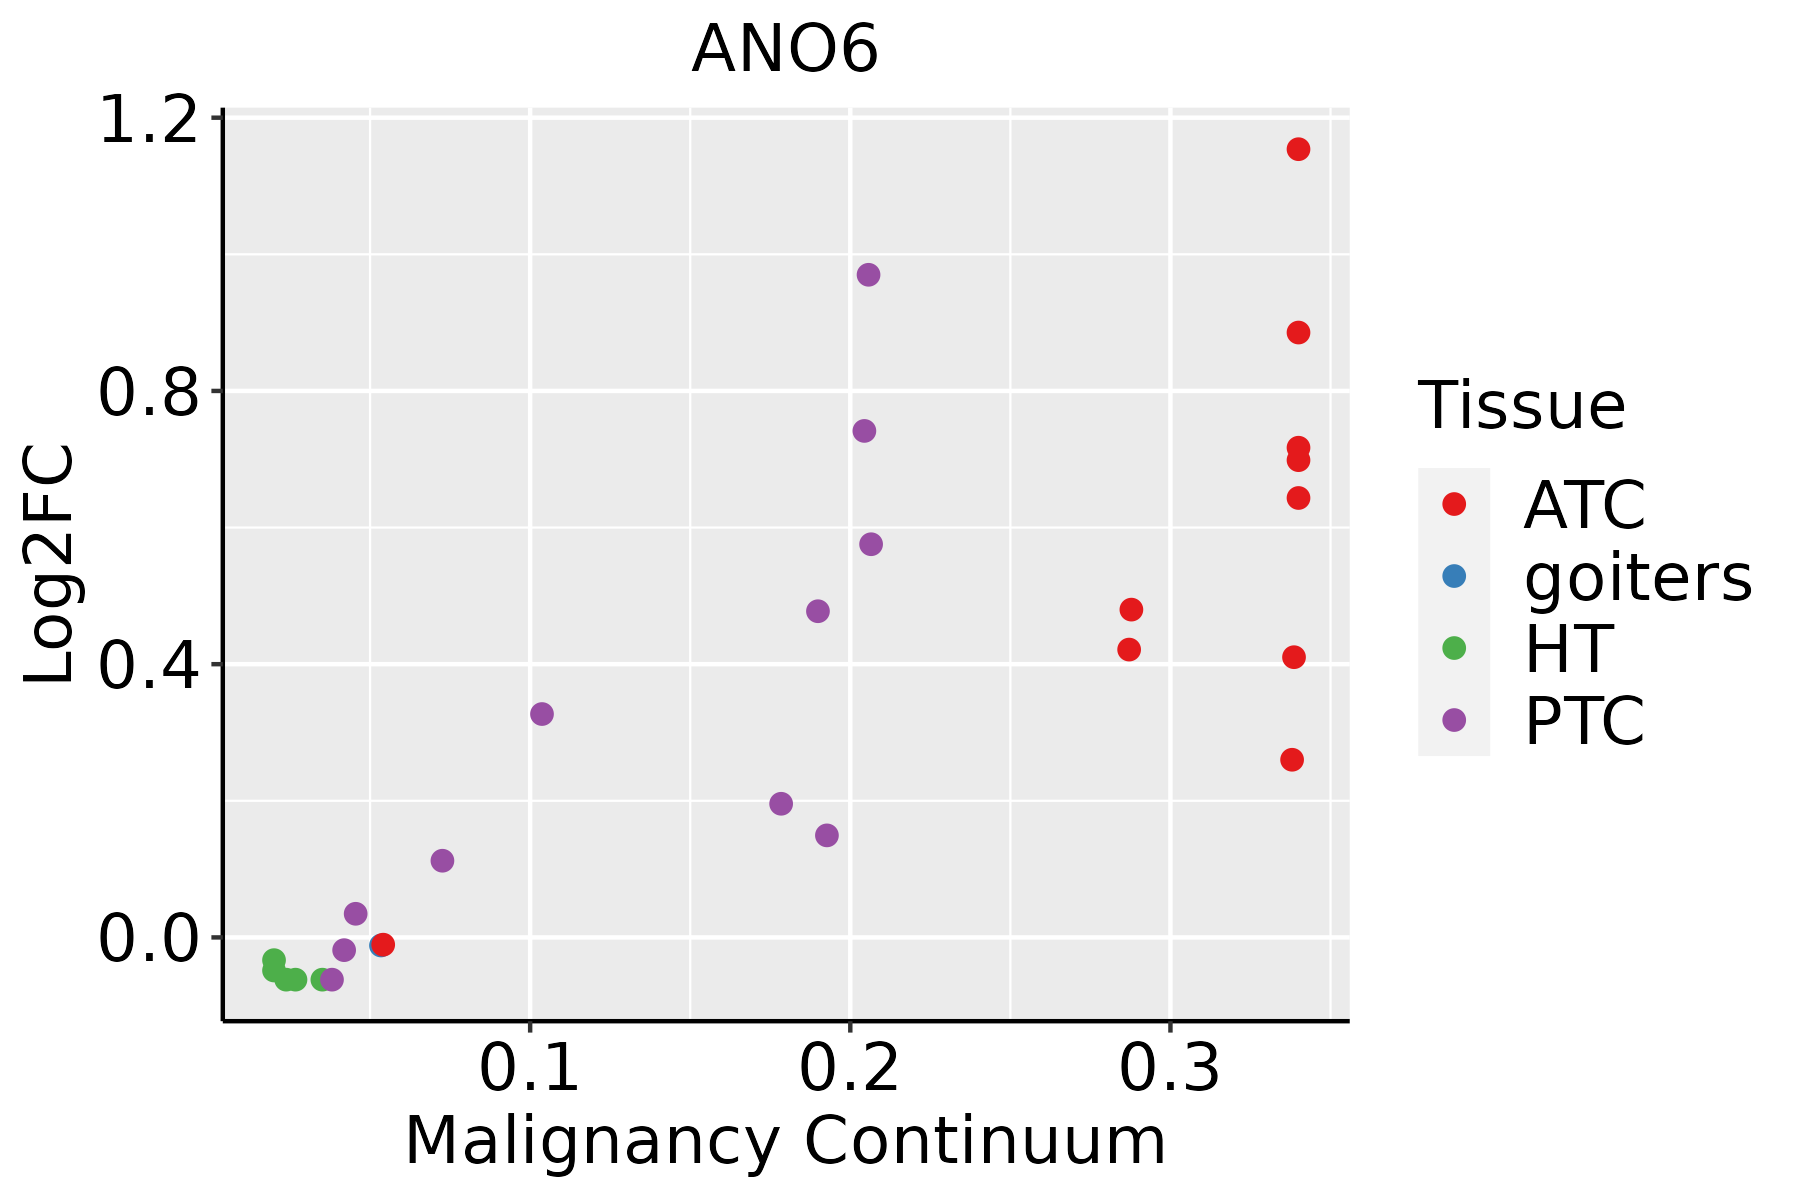 | ATC: Anaplastic thyroid cancer |
| HT: Hashimoto's thyroiditis |
| PTC: Papillary thyroid cancer |
| GO ID | Tissue | Disease Stage | Description | Gene Ratio | Bg Ratio | pvalue | p.adjust | Count |
| GO:000268516 | Skin | AK | regulation of leukocyte migration | 40/1910 | 210/18723 | 7.55e-05 | 1.06e-03 | 40 |
| GO:00716759 | Skin | AK | regulation of mononuclear cell migration | 26/1910 | 115/18723 | 7.60e-05 | 1.07e-03 | 26 |
| GO:000268716 | Skin | AK | positive regulation of leukocyte migration | 29/1910 | 135/18723 | 8.10e-05 | 1.11e-03 | 29 |
| GO:000268815 | Skin | AK | regulation of leukocyte chemotaxis | 27/1910 | 122/18723 | 8.24e-05 | 1.13e-03 | 27 |
| GO:006032610 | Skin | AK | cell chemotaxis | 53/1910 | 310/18723 | 1.20e-04 | 1.50e-03 | 53 |
| GO:003059510 | Skin | AK | leukocyte chemotaxis | 42/1910 | 230/18723 | 1.36e-04 | 1.68e-03 | 42 |
| GO:00518178 | Skin | AK | modulation of process of other organism involved in symbiotic interaction | 20/1910 | 81/18723 | 1.40e-04 | 1.70e-03 | 20 |
| GO:00026909 | Skin | AK | positive regulation of leukocyte chemotaxis | 22/1910 | 94/18723 | 1.55e-04 | 1.84e-03 | 22 |
| GO:003253524 | Skin | AK | regulation of cellular component size | 62/1910 | 383/18723 | 1.66e-04 | 1.94e-03 | 62 |
| GO:003582110 | Skin | AK | modulation of process of other organism | 23/1910 | 106/18723 | 3.64e-04 | 3.59e-03 | 23 |
| GO:009752915 | Skin | AK | myeloid leukocyte migration | 39/1910 | 220/18723 | 4.30e-04 | 4.05e-03 | 39 |
| GO:00716748 | Skin | AK | mononuclear cell migration | 35/1910 | 196/18723 | 7.20e-04 | 6.10e-03 | 35 |
| GO:005087820 | Skin | AK | regulation of body fluid levels | 58/1910 | 379/18723 | 1.11e-03 | 8.61e-03 | 58 |
| GO:003010019 | Skin | AK | regulation of endocytosis | 36/1910 | 211/18723 | 1.42e-03 | 1.05e-02 | 36 |
| GO:000759910 | Skin | AK | hemostasis | 37/1910 | 222/18723 | 1.89e-03 | 1.29e-02 | 37 |
| GO:00716777 | Skin | AK | positive regulation of mononuclear cell migration | 15/1910 | 65/18723 | 1.92e-03 | 1.31e-02 | 15 |
| GO:000759610 | Skin | AK | blood coagulation | 36/1910 | 217/18723 | 2.34e-03 | 1.54e-02 | 36 |
| GO:004580719 | Skin | AK | positive regulation of endocytosis | 20/1910 | 100/18723 | 2.43e-03 | 1.59e-02 | 20 |
| GO:005081710 | Skin | AK | coagulation | 36/1910 | 222/18723 | 3.46e-03 | 2.10e-02 | 36 |
| GO:000836110 | Skin | AK | regulation of cell size | 30/1910 | 181/18723 | 5.22e-03 | 2.91e-02 | 30 |
| Hugo Symbol | Variant Class | Variant Classification | dbSNP RS | HGVSc | HGVSp | HGVSp Short | SWISSPROT | BIOTYPE | SIFT | PolyPhen | Tumor Sample Barcode | Tissue | Histology | Sex | Age | Stage | Therapy Types | Drugs | Outcome |
| ANO6 | SNV | Missense_Mutation | | c.1075N>T | p.His359Tyr | p.H359Y | Q4KMQ2 | protein_coding | tolerated(0.07) | benign(0.067) | TCGA-AC-A23H-01 | Breast | breast invasive carcinoma | Female | >=65 | I/II | Unknown | Unknown | PD |
| ANO6 | SNV | Missense_Mutation | | c.595G>C | p.Glu199Gln | p.E199Q | Q4KMQ2 | protein_coding | deleterious(0.02) | benign(0.433) | TCGA-C8-A275-01 | Breast | breast invasive carcinoma | Female | <65 | I/II | Unknown | Unknown | SD |
| ANO6 | SNV | Missense_Mutation | rs745465915 | c.361G>A | p.Glu121Lys | p.E121K | Q4KMQ2 | protein_coding | deleterious(0) | benign(0.393) | TCGA-D8-A1JA-01 | Breast | breast invasive carcinoma | Female | <65 | III/IV | Chemotherapy | adriamycin | PD |
| ANO6 | SNV | Missense_Mutation | rs781608617 | c.1259N>A | p.Arg420His | p.R420H | Q4KMQ2 | protein_coding | deleterious(0) | possibly_damaging(0.871) | TCGA-D8-A1JF-01 | Breast | breast invasive carcinoma | Female | >=65 | III/IV | Unknown | Unknown | SD |
| ANO6 | SNV | Missense_Mutation | | c.1976N>C | p.Arg659Thr | p.R659T | Q4KMQ2 | protein_coding | tolerated(0.62) | benign(0) | TCGA-D8-A27G-01 | Breast | breast invasive carcinoma | Female | >=65 | I/II | Unknown | Unknown | SD |
| ANO6 | SNV | Missense_Mutation | novel | c.1953N>A | p.Met651Ile | p.M651I | Q4KMQ2 | protein_coding | tolerated(0.39) | benign(0.044) | TCGA-EW-A1OV-01 | Breast | breast invasive carcinoma | Female | <65 | I/II | Chemotherapy | epirubicin | SD |
| ANO6 | SNV | Missense_Mutation | novel | c.1273N>C | p.Glu425Gln | p.E425Q | Q4KMQ2 | protein_coding | tolerated(0.08) | possibly_damaging(0.593) | TCGA-EW-A3E8-01 | Breast | breast invasive carcinoma | Female | <65 | I/II | Hormone Therapy | anastrozole | SD |
| ANO6 | SNV | Missense_Mutation | novel | c.2048N>C | p.Gly683Ala | p.G683A | Q4KMQ2 | protein_coding | tolerated(0.07) | possibly_damaging(0.678) | TCGA-LL-A441-01 | Breast | breast invasive carcinoma | Female | <65 | I/II | Chemotherapy | taxotere | CR |
| ANO6 | insertion | Frame_Shift_Ins | novel | c.2465_2466insGACCAGCC | p.Asn823ThrfsTer32 | p.N823Tfs*32 | Q4KMQ2 | protein_coding | | | TCGA-B6-A0IN-01 | Breast | breast invasive carcinoma | Female | <65 | I/II | Unknown | Unknown | PD |
| ANO6 | insertion | Frame_Shift_Ins | novel | c.2466_2467insGGCCAACATGACAA | p.Asn823GlyfsTer34 | p.N823Gfs*34 | Q4KMQ2 | protein_coding | | | TCGA-B6-A0IN-01 | Breast | breast invasive carcinoma | Female | <65 | I/II | Unknown | Unknown | PD |


