
|
|||||
|
 | |
| |
| |
| |
| |
| |
|
Gene: AIF1 |
Gene summary for AIF1 |
| Gene information | Species | Human | Gene symbol | AIF1 | Gene ID | 199 |
| Gene name | allograft inflammatory factor 1 | |
| Gene Alias | AIF-1 | |
| Cytomap | 6p21.33 | |
| Gene Type | protein-coding | GO ID | GO:0000082 | UniProtAcc | I3WTX1 |
Top |
Malignant transformation analysis |
| Identification of the aberrant gene expression in precancerous and cancerous lesions by comparing the gene expression of stem-like cells in diseased tissues with normal stem cells |
| Entrez ID | Symbol | Replicates | Species | Organ | Tissue | Adj P-value | Log2FC | Malignancy |
| 199 | AIF1 | NCCBC11 | Human | Breast | DCIS | 9.00e-08 | 7.92e-01 | 0.1232 |
| 199 | AIF1 | NCCBC14 | Human | Breast | DCIS | 2.44e-08 | 5.08e-01 | 0.2021 |
| 199 | AIF1 | NCCBC3 | Human | Breast | DCIS | 1.22e-39 | 1.05e+00 | 0.1198 |
| 199 | AIF1 | NCCBC5 | Human | Breast | DCIS | 6.97e-21 | 8.38e-01 | 0.2046 |
| 199 | AIF1 | N_HPV_1 | Human | Cervix | N_HPV | 4.36e-05 | 5.04e-01 | 0.0079 |
| 199 | AIF1 | N_HPV_2 | Human | Cervix | N_HPV | 5.56e-05 | 3.83e-01 | -0.0131 |
| 199 | AIF1 | CCI_1 | Human | Cervix | CC | 3.17e-04 | -6.97e-01 | 0.528 |
| 199 | AIF1 | CCI_2 | Human | Cervix | CC | 4.44e-02 | -6.75e-01 | 0.5249 |
| 199 | AIF1 | CCI_3 | Human | Cervix | CC | 2.19e-04 | -6.81e-01 | 0.516 |
| 199 | AIF1 | CCII_1 | Human | Cervix | CC | 3.08e-09 | -6.97e-01 | 0.3249 |
| 199 | AIF1 | Tumor | Human | Cervix | CC | 3.04e-18 | -6.91e-01 | 0.1241 |
| 199 | AIF1 | sample1 | Human | Cervix | CC | 6.37e-04 | -6.42e-01 | 0.0959 |
| 199 | AIF1 | sample3 | Human | Cervix | CC | 1.02e-18 | -6.89e-01 | 0.1387 |
| 199 | AIF1 | H2 | Human | Cervix | HSIL_HPV | 2.16e-10 | -6.25e-01 | 0.0632 |
| 199 | AIF1 | T1 | Human | Cervix | CC | 3.61e-09 | -6.13e-01 | 0.0918 |
| 199 | AIF1 | T3 | Human | Cervix | CC | 3.70e-17 | -6.88e-01 | 0.1389 |
| 199 | AIF1 | S43 | Human | Liver | Cirrhotic | 1.08e-07 | -3.58e-01 | -0.0187 |
| 199 | AIF1 | HCC1_Meng | Human | Liver | HCC | 6.75e-16 | -1.84e-01 | 0.0246 |
| 199 | AIF1 | HCC2_Meng | Human | Liver | HCC | 2.01e-06 | -3.50e-01 | 0.0107 |
| 199 | AIF1 | cirrhotic1 | Human | Liver | Cirrhotic | 9.65e-05 | -2.13e-01 | 0.0202 |
| Page: 1 2 |
| Tissue | Expression Dynamics | Abbreviation |
| Breast | 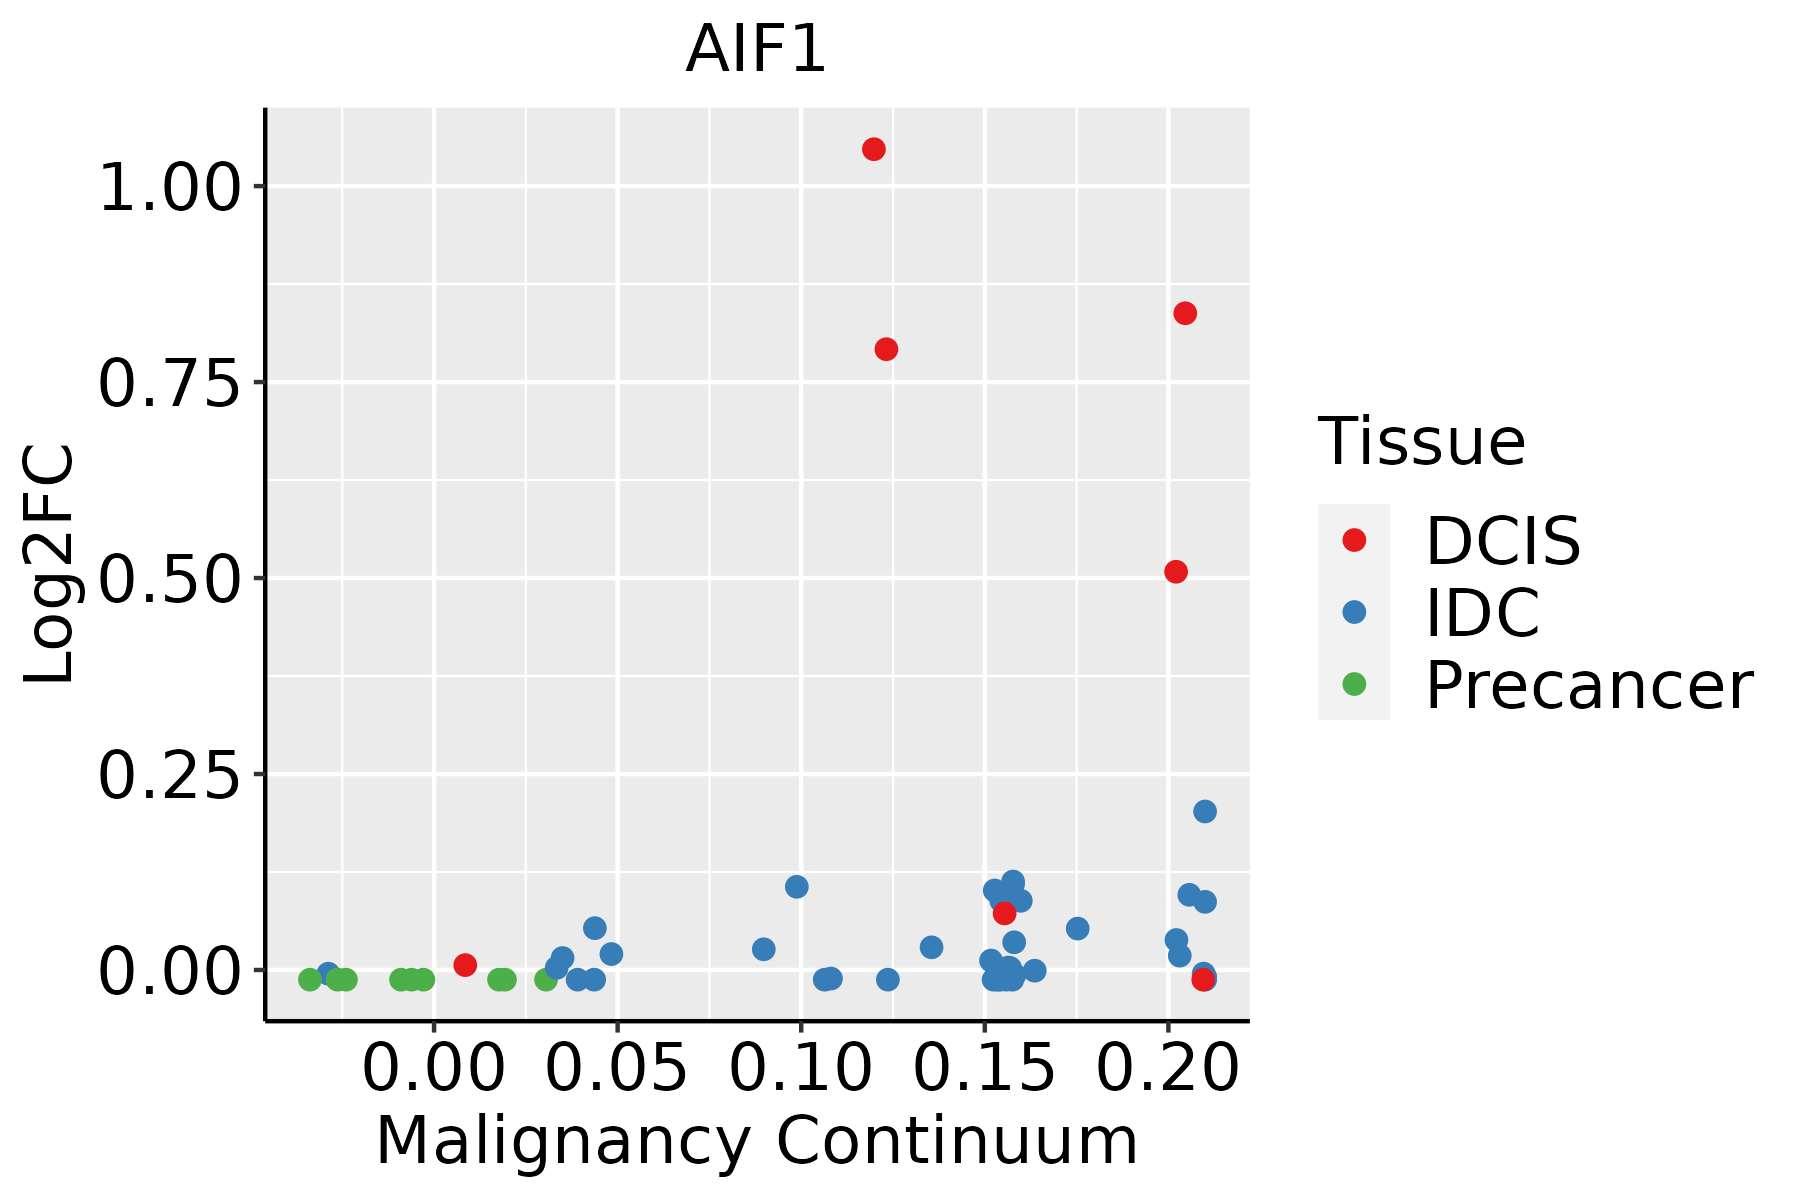 | IDC: Invasive ductal carcinoma |
| DCIS: Ductal carcinoma in situ | ||
| Precancer(BRCA1-mut): Precancerous lesion from BRCA1 mutation carriers | ||
| Cervix | 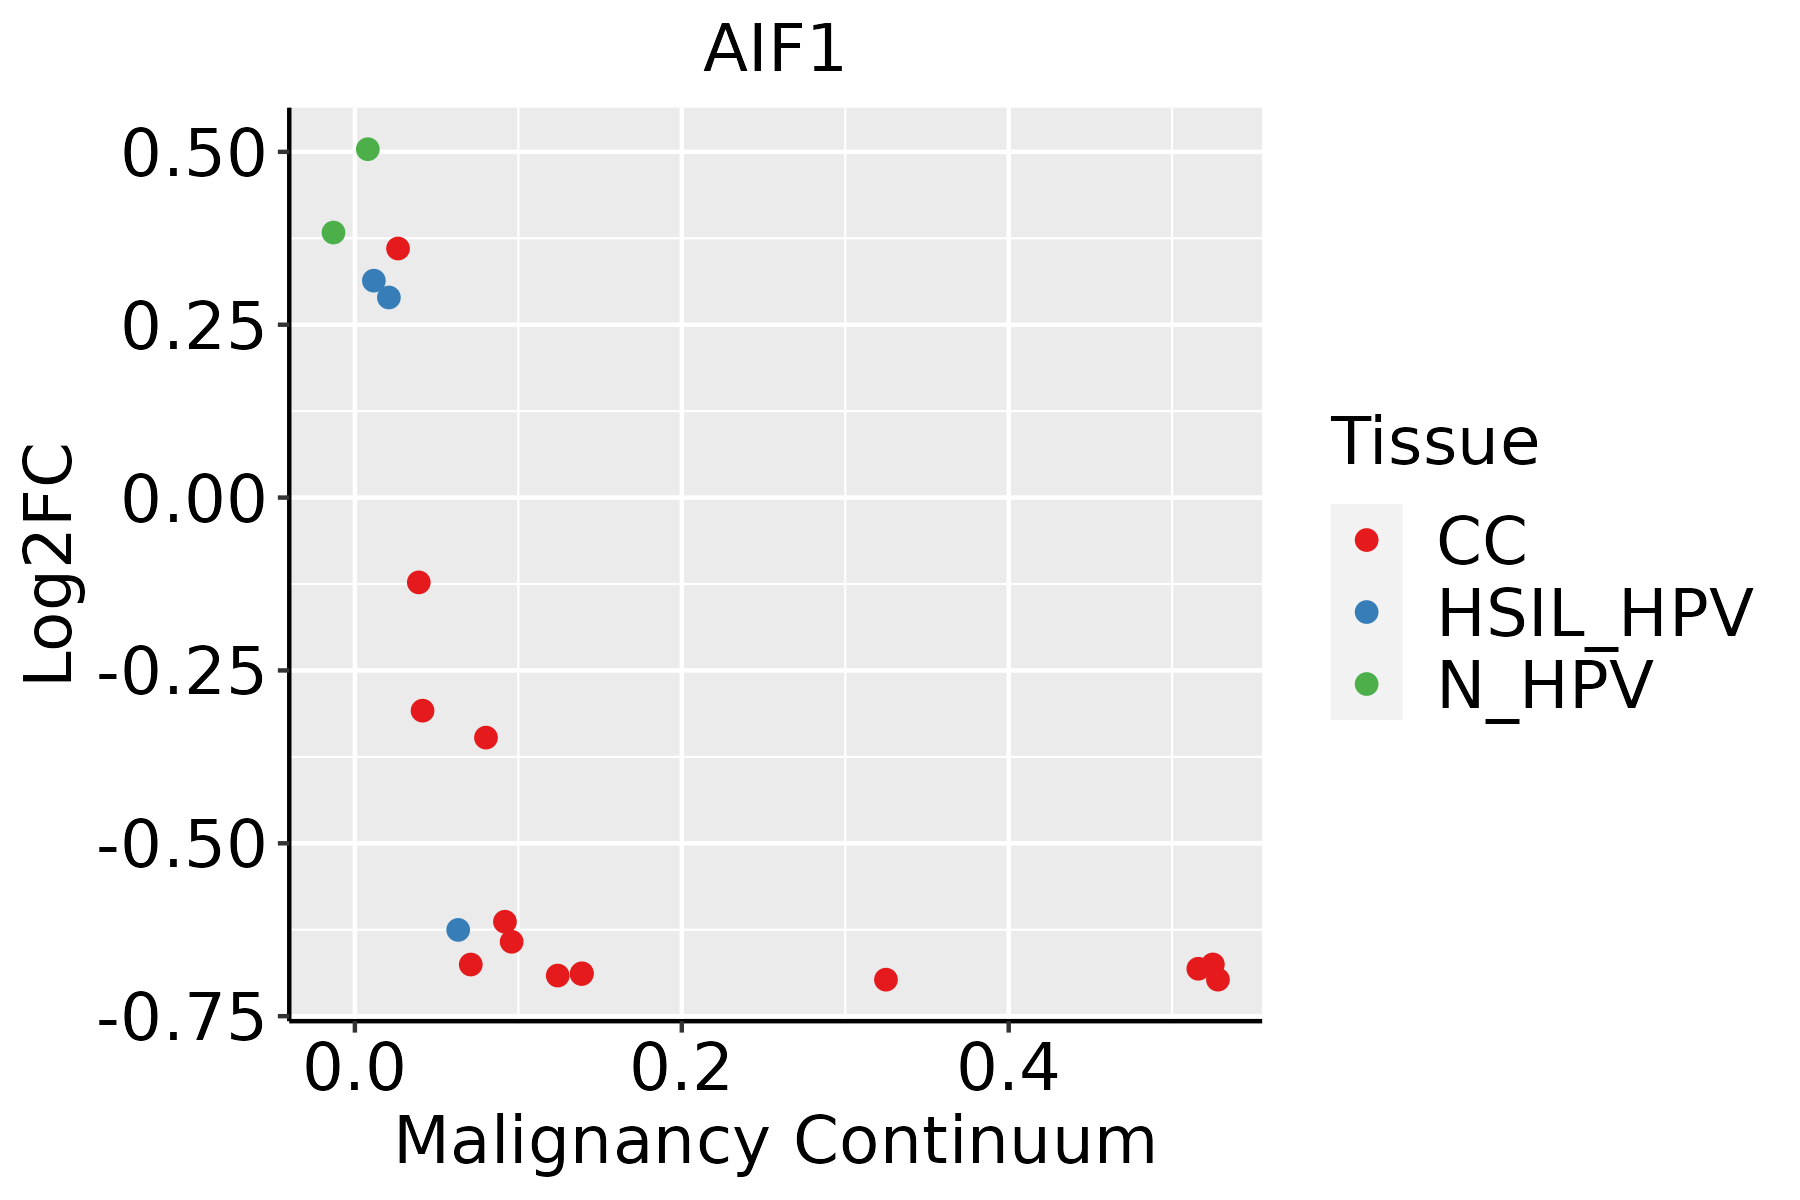 | CC: Cervix cancer |
| HSIL_HPV: HPV-infected high-grade squamous intraepithelial lesions | ||
| N_HPV: HPV-infected normal cervix | ||
| Liver | 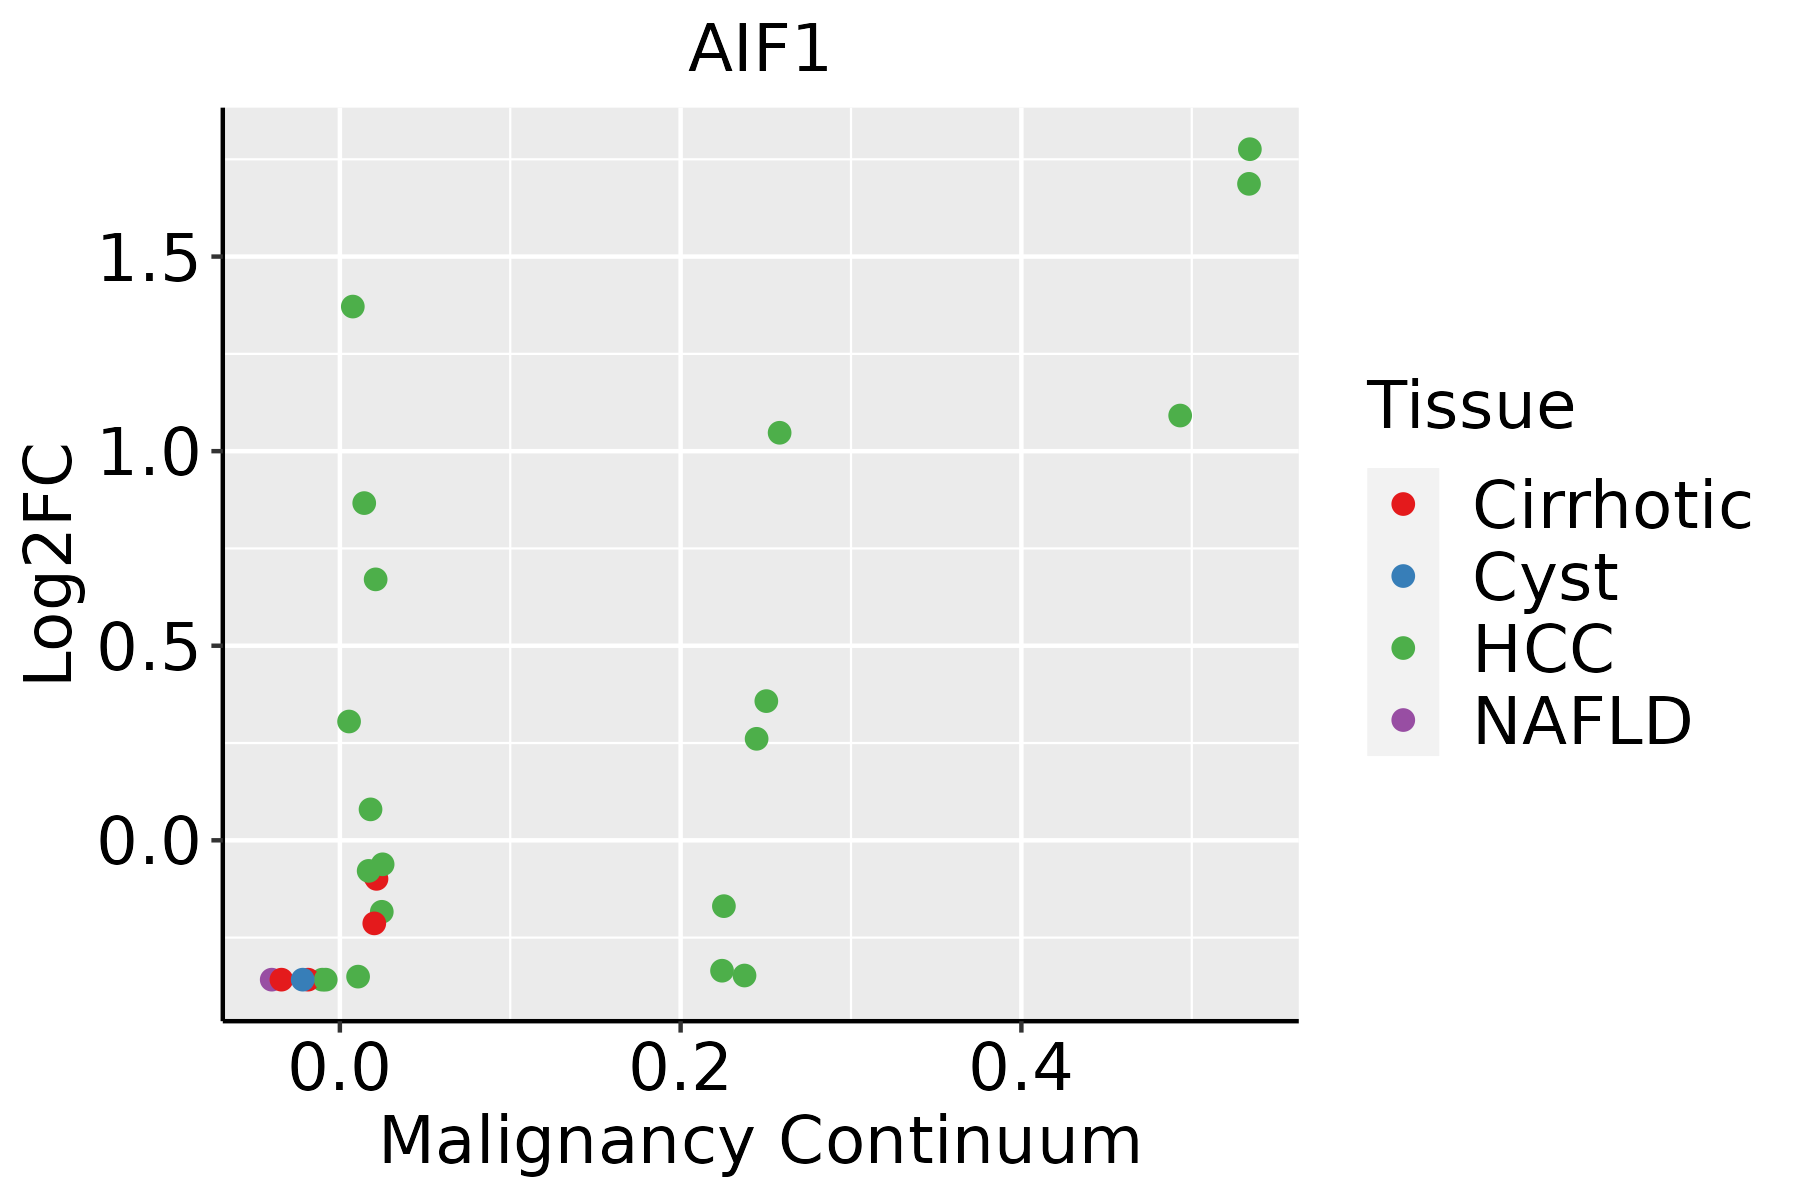 | HCC: Hepatocellular carcinoma |
| NAFLD: Non-alcoholic fatty liver disease | ||
| Thyroid |  | ATC: Anaplastic thyroid cancer |
| HT: Hashimoto's thyroiditis | ||
| PTC: Papillary thyroid cancer |
| ∗log2FC in expression of this searched gene in stem-like cells from each diseased tissue sample relative to stem-like cells in normal samples in each tissue plotted against the malignancy continuum. Samples are colored based on if they are from different disease stage. |
Top |
Malignant transformation related pathway analysis |
| Find out the enriched GO biological processes and KEGG pathways involved in transition from healthy to precancer to cancer |
| Tissue | Disease Stage | Enriched GO biological Processes |
| Colorectum | AD |  |
| Colorectum | SER |  |
| Colorectum | MSS |  |
| Colorectum | MSI-H |  |
| Colorectum | FAP |  |
| ∗Top 15 enriched GO BP terms are showed in the bar plot of each disease state in each tissue. Each row represents a significant GO biological process which is colored according to the -log10(p.adjust). |
| Page: 1 2 3 4 5 6 7 8 9 |
| GO ID | Tissue | Disease Stage | Description | Gene Ratio | Bg Ratio | pvalue | p.adjust | Count |
| GO:000701527 | Esophagus | ESCC | actin filament organization | 259/8552 | 442/18723 | 2.37e-08 | 4.50e-07 | 259 |
| GO:005101727 | Esophagus | ESCC | actin filament bundle assembly | 100/8552 | 157/18723 | 3.87e-06 | 4.17e-05 | 100 |
| GO:006157227 | Esophagus | ESCC | actin filament bundle organization | 101/8552 | 161/18723 | 9.22e-06 | 8.82e-05 | 101 |
| GO:00315299 | Esophagus | ESCC | ruffle organization | 39/8552 | 56/18723 | 2.44e-04 | 1.51e-03 | 39 |
| GO:00971789 | Esophagus | ESCC | ruffle assembly | 32/8552 | 44/18723 | 2.50e-04 | 1.54e-03 | 32 |
| GO:000697912 | Liver | Cirrhotic | response to oxidative stress | 196/4634 | 446/18723 | 2.80e-19 | 5.86e-17 | 196 |
| GO:006219712 | Liver | Cirrhotic | cellular response to chemical stress | 147/4634 | 337/18723 | 1.84e-14 | 1.72e-12 | 147 |
| GO:004854512 | Liver | Cirrhotic | response to steroid hormone | 146/4634 | 339/18723 | 7.87e-14 | 6.76e-12 | 146 |
| GO:003459912 | Liver | Cirrhotic | cellular response to oxidative stress | 127/4634 | 288/18723 | 4.29e-13 | 3.32e-11 | 127 |
| GO:000701512 | Liver | Cirrhotic | actin filament organization | 171/4634 | 442/18723 | 3.93e-11 | 2.30e-09 | 171 |
| GO:005125812 | Liver | Cirrhotic | protein polymerization | 116/4634 | 297/18723 | 2.87e-08 | 9.78e-07 | 116 |
| GO:007149612 | Liver | Cirrhotic | cellular response to external stimulus | 123/4634 | 320/18723 | 3.27e-08 | 1.10e-06 | 123 |
| GO:005101712 | Liver | Cirrhotic | actin filament bundle assembly | 69/4634 | 157/18723 | 1.06e-07 | 3.05e-06 | 69 |
| GO:006157212 | Liver | Cirrhotic | actin filament bundle organization | 70/4634 | 161/18723 | 1.44e-07 | 3.87e-06 | 70 |
| GO:005138411 | Liver | Cirrhotic | response to glucocorticoid | 65/4634 | 148/18723 | 2.53e-07 | 6.41e-06 | 65 |
| GO:00316686 | Liver | Cirrhotic | cellular response to extracellular stimulus | 96/4634 | 246/18723 | 4.55e-07 | 1.05e-05 | 96 |
| GO:003196011 | Liver | Cirrhotic | response to corticosteroid | 70/4634 | 167/18723 | 7.73e-07 | 1.62e-05 | 70 |
| GO:000815412 | Liver | Cirrhotic | actin polymerization or depolymerization | 86/4634 | 218/18723 | 1.04e-06 | 2.13e-05 | 86 |
| GO:003004112 | Liver | Cirrhotic | actin filament polymerization | 77/4634 | 191/18723 | 1.41e-06 | 2.79e-05 | 77 |
| GO:00343413 | Liver | Cirrhotic | response to interferon-gamma | 60/4634 | 141/18723 | 2.57e-06 | 4.63e-05 | 60 |
| Page: 1 2 3 4 5 6 7 8 9 10 11 12 13 14 15 16 17 18 19 20 21 22 23 24 25 26 27 28 29 30 31 |
| Pathway ID | Tissue | Disease Stage | Description | Gene Ratio | Bg Ratio | pvalue | p.adjust | qvalue | Count |
| Page: 1 |
Top |
Cell-cell communication analysis |
| Identification of potential cell-cell interactions between two cell types and their ligand-receptor pairs for different disease states |
| Ligand | Receptor | LRpair | Pathway | Tissue | Disease Stage |
| Page: 1 |
Top |
Single-cell gene regulatory network inference analysis |
| Find out the significant the regulons (TFs) and the target genes of each regulon across cell types for different disease states |
| TF | Cell Type | Tissue | Disease Stage | Target Gene | RSS | Regulon Activity |
| ∗The dot plots of a searched regulon are shown for all cell subpopulations in each disease state of each tissue based on the regulon specific score inferred using pySCENIC and by calculating the average expression. |
| Page: 1 |
Top |
Somatic mutation of malignant transformation related genes |
| Annotation of somatic variants for genes involved in malignant transformation |
| Hugo Symbol | Variant Class | Variant Classification | dbSNP RS | HGVSc | HGVSp | HGVSp Short | SWISSPROT | BIOTYPE | SIFT | PolyPhen | Tumor Sample Barcode | Tissue | Histology | Sex | Age | Stage | Therapy Types | Drugs | Outcome |
| AIF1 | SNV | Missense_Mutation | novel | c.253N>C | p.Glu85Gln | p.E85Q | P55008 | protein_coding | deleterious(0.01) | probably_damaging(0.996) | TCGA-C5-A2M1-01 | Cervix | cervical & endocervical cancer | Female | <65 | I/II | Unknown | Unknown | SD |
| AIF1 | deletion | Frame_Shift_Del | c.413delC | p.Pro138GlnfsTer36 | p.P138Qfs*36 | P55008 | protein_coding | TCGA-AM-5821-01 | Colorectum | colon adenocarcinoma | Female | >=65 | I/II | Unknown | Unknown | SD | |||
| AIF1 | SNV | Missense_Mutation | novel | c.4N>T | p.Ser2Cys | p.S2C | P55008 | protein_coding | deleterious_low_confidence(0.02) | possibly_damaging(0.757) | TCGA-A5-A0G2-01 | Endometrium | uterine corpus endometrioid carcinoma | Female | <65 | III/IV | Unknown | Unknown | SD |
| AIF1 | SNV | Missense_Mutation | novel | c.215N>T | p.Arg72Leu | p.R72L | P55008 | protein_coding | tolerated(0.15) | possibly_damaging(0.887) | TCGA-A5-A2K5-01 | Endometrium | uterine corpus endometrioid carcinoma | Female | >=65 | I/II | Unknown | Unknown | SD |
| AIF1 | SNV | Missense_Mutation | novel | c.261G>T | p.Lys87Asn | p.K87N | P55008 | protein_coding | deleterious(0) | probably_damaging(0.999) | TCGA-AJ-A3EL-01 | Endometrium | uterine corpus endometrioid carcinoma | Female | <65 | I/II | Unknown | Unknown | SD |
| AIF1 | SNV | Missense_Mutation | novel | c.53N>T | p.Ala18Val | p.A18V | P55008 | protein_coding | tolerated(0.1) | benign(0.033) | TCGA-AP-A0LM-01 | Endometrium | uterine corpus endometrioid carcinoma | Female | <65 | III/IV | Chemotherapy | cisplatin | SD |
| AIF1 | SNV | Missense_Mutation | c.220N>A | p.Leu74Met | p.L74M | P55008 | protein_coding | tolerated(1) | benign(0.17) | TCGA-E6-A1LX-01 | Endometrium | uterine corpus endometrioid carcinoma | Female | <65 | I/II | Unknown | Unknown | SD | |
| AIF1 | SNV | Missense_Mutation | novel | c.412C>A | p.Pro138Thr | p.P138T | P55008 | protein_coding | deleterious(0) | probably_damaging(0.916) | TCGA-78-8662-01 | Lung | lung adenocarcinoma | Female | <65 | I/II | Unknown | Unknown | PD |
| AIF1 | SNV | Missense_Mutation | c.406N>T | p.Gly136Cys | p.G136C | P55008 | protein_coding | deleterious(0.02) | benign(0.029) | TCGA-BR-4280-01 | Stomach | stomach adenocarcinoma | Female | >=65 | III/IV | Unknown | Unknown | SD | |
| AIF1 | SNV | Missense_Mutation | c.440N>T | p.Pro147Leu | p.P147L | P55008 | protein_coding | deleterious(0) | probably_damaging(0.999) | TCGA-BR-4362-01 | Stomach | stomach adenocarcinoma | Female | >=65 | I/II | Unknown | Unknown | SD |
| Page: 1 2 |
Top |
Related drugs of malignant transformation related genes |
| Identification of chemicals and drugs interact with genes involved in malignant transfromation |
| (DGIdb 4.0) |
| Entrez ID | Symbol | Category | Interaction Types | Drug Claim Name | Drug Name | PMIDs |
| Page: 1 |

Copyright 2023-Present -The University of Texas Health Science Center at Houston |