| Tissue | Expression Dynamics | Abbreviation |
| Breast | 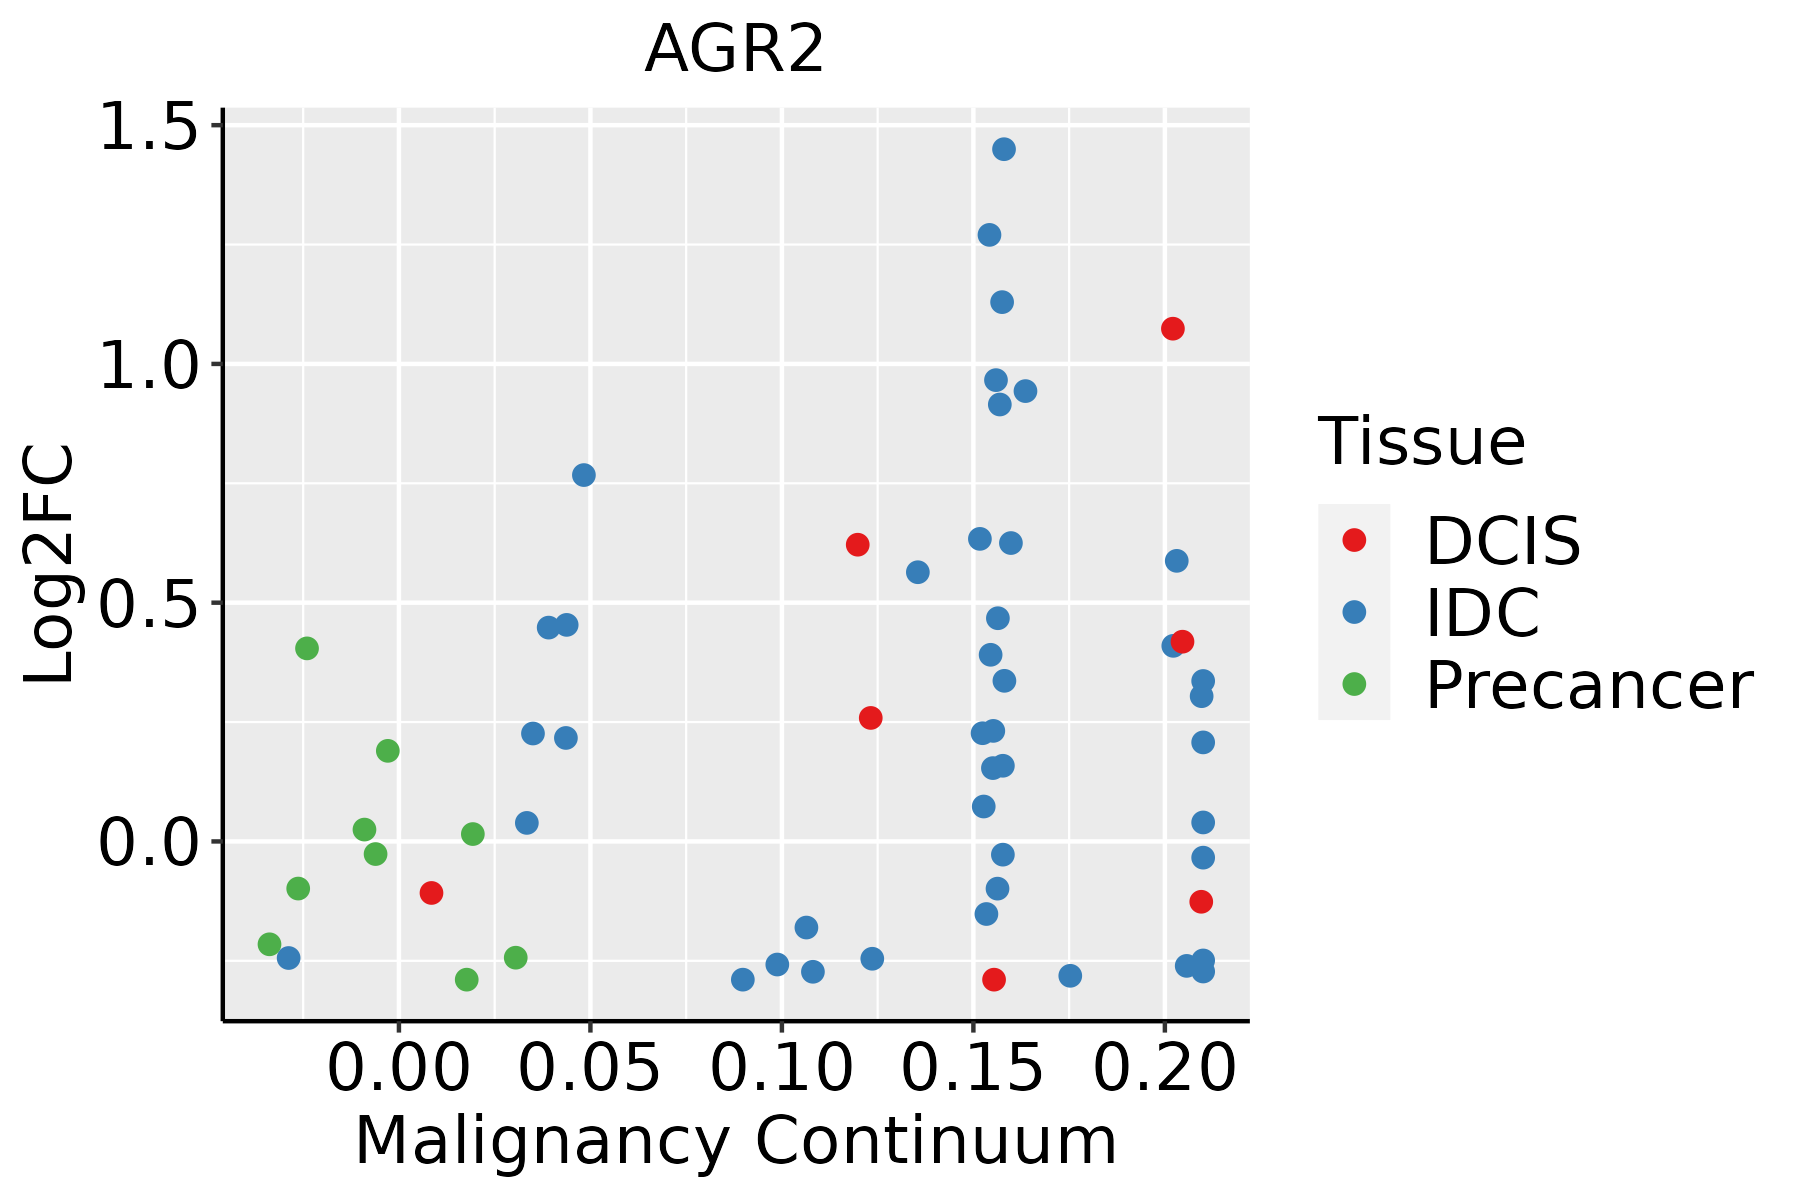 | IDC: Invasive ductal carcinoma |
| DCIS: Ductal carcinoma in situ |
| Precancer(BRCA1-mut): Precancerous lesion from BRCA1 mutation carriers |
| Cervix | 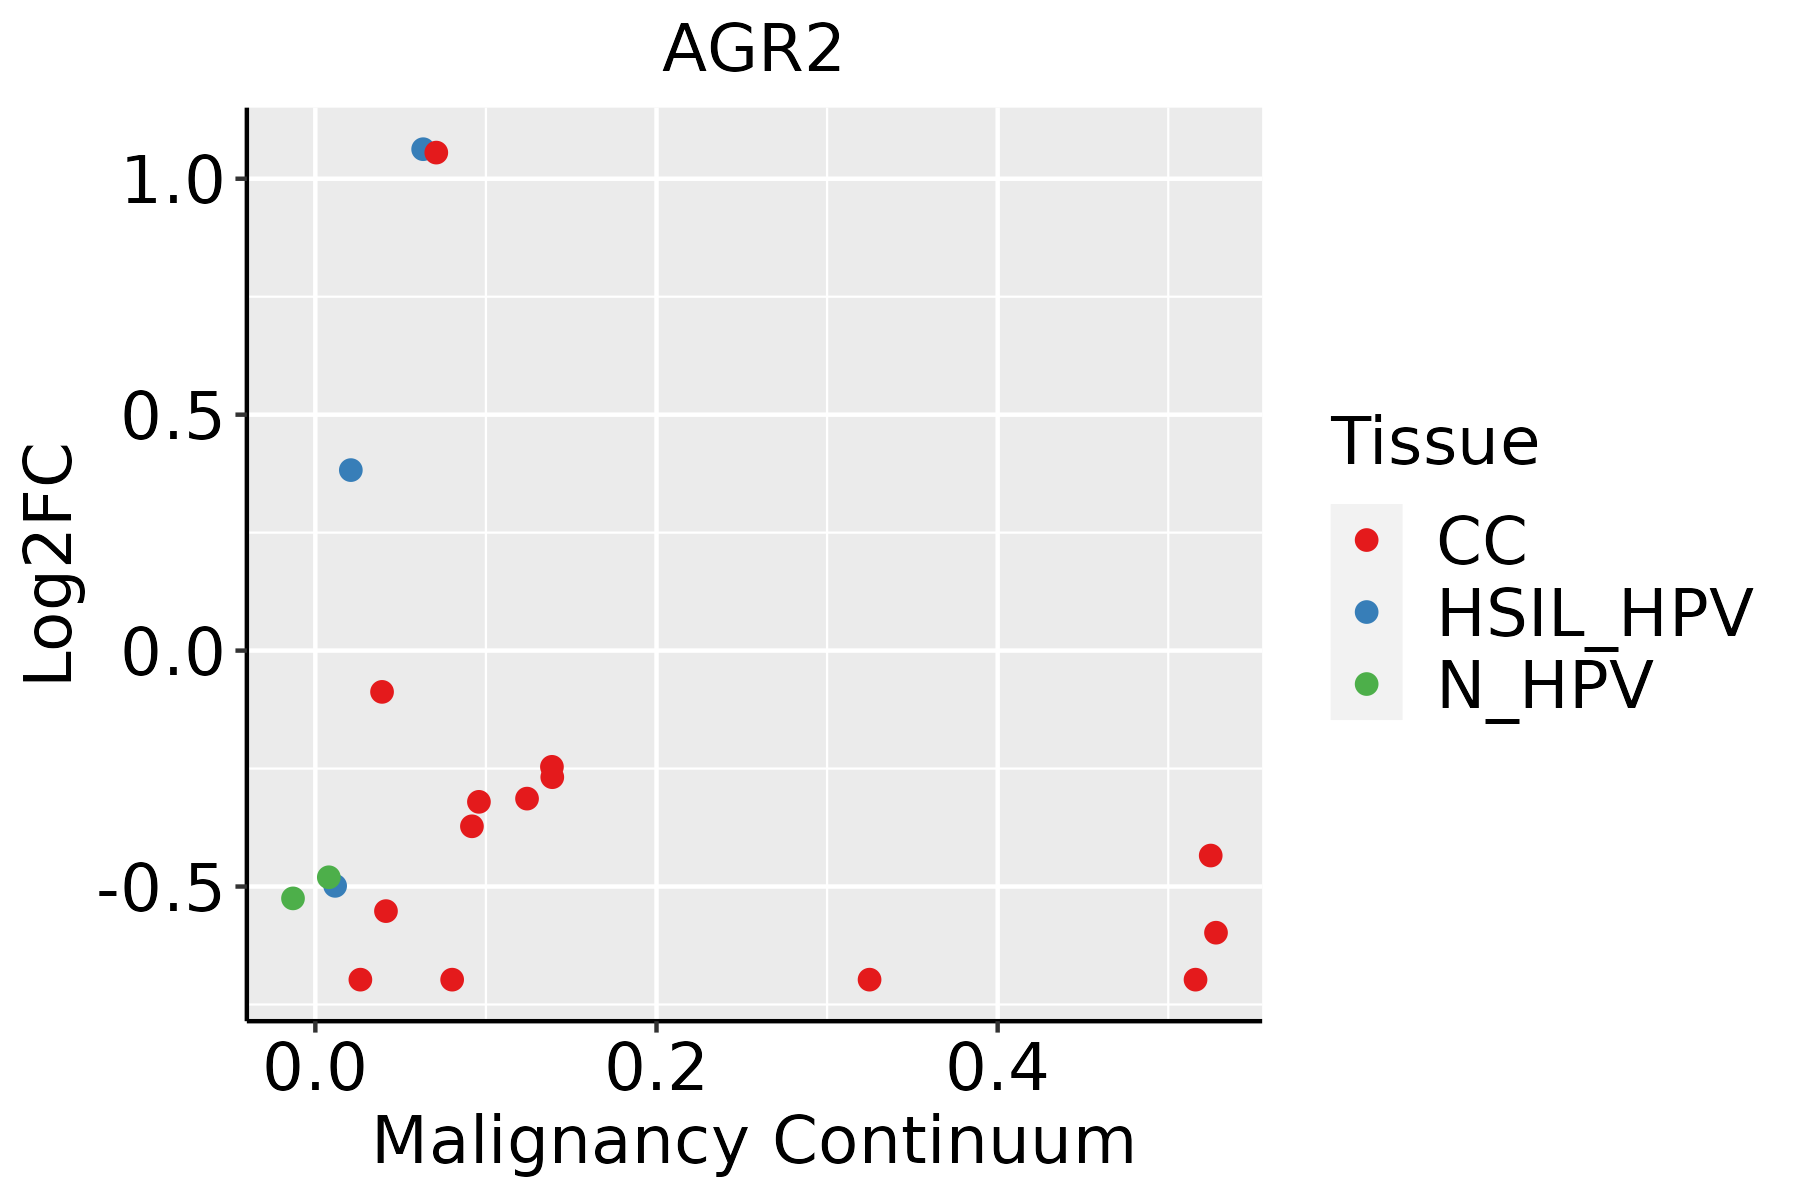 | CC: Cervix cancer |
| HSIL_HPV: HPV-infected high-grade squamous intraepithelial lesions |
| N_HPV: HPV-infected normal cervix |
| Colorectum (GSE201348) |  | FAP: Familial adenomatous polyposis |
| CRC: Colorectal cancer |
| Colorectum (HTA11) |  | AD: Adenomas |
| SER: Sessile serrated lesions |
| MSI-H: Microsatellite-high colorectal cancer |
| MSS: Microsatellite stable colorectal cancer |
| Endometrium | 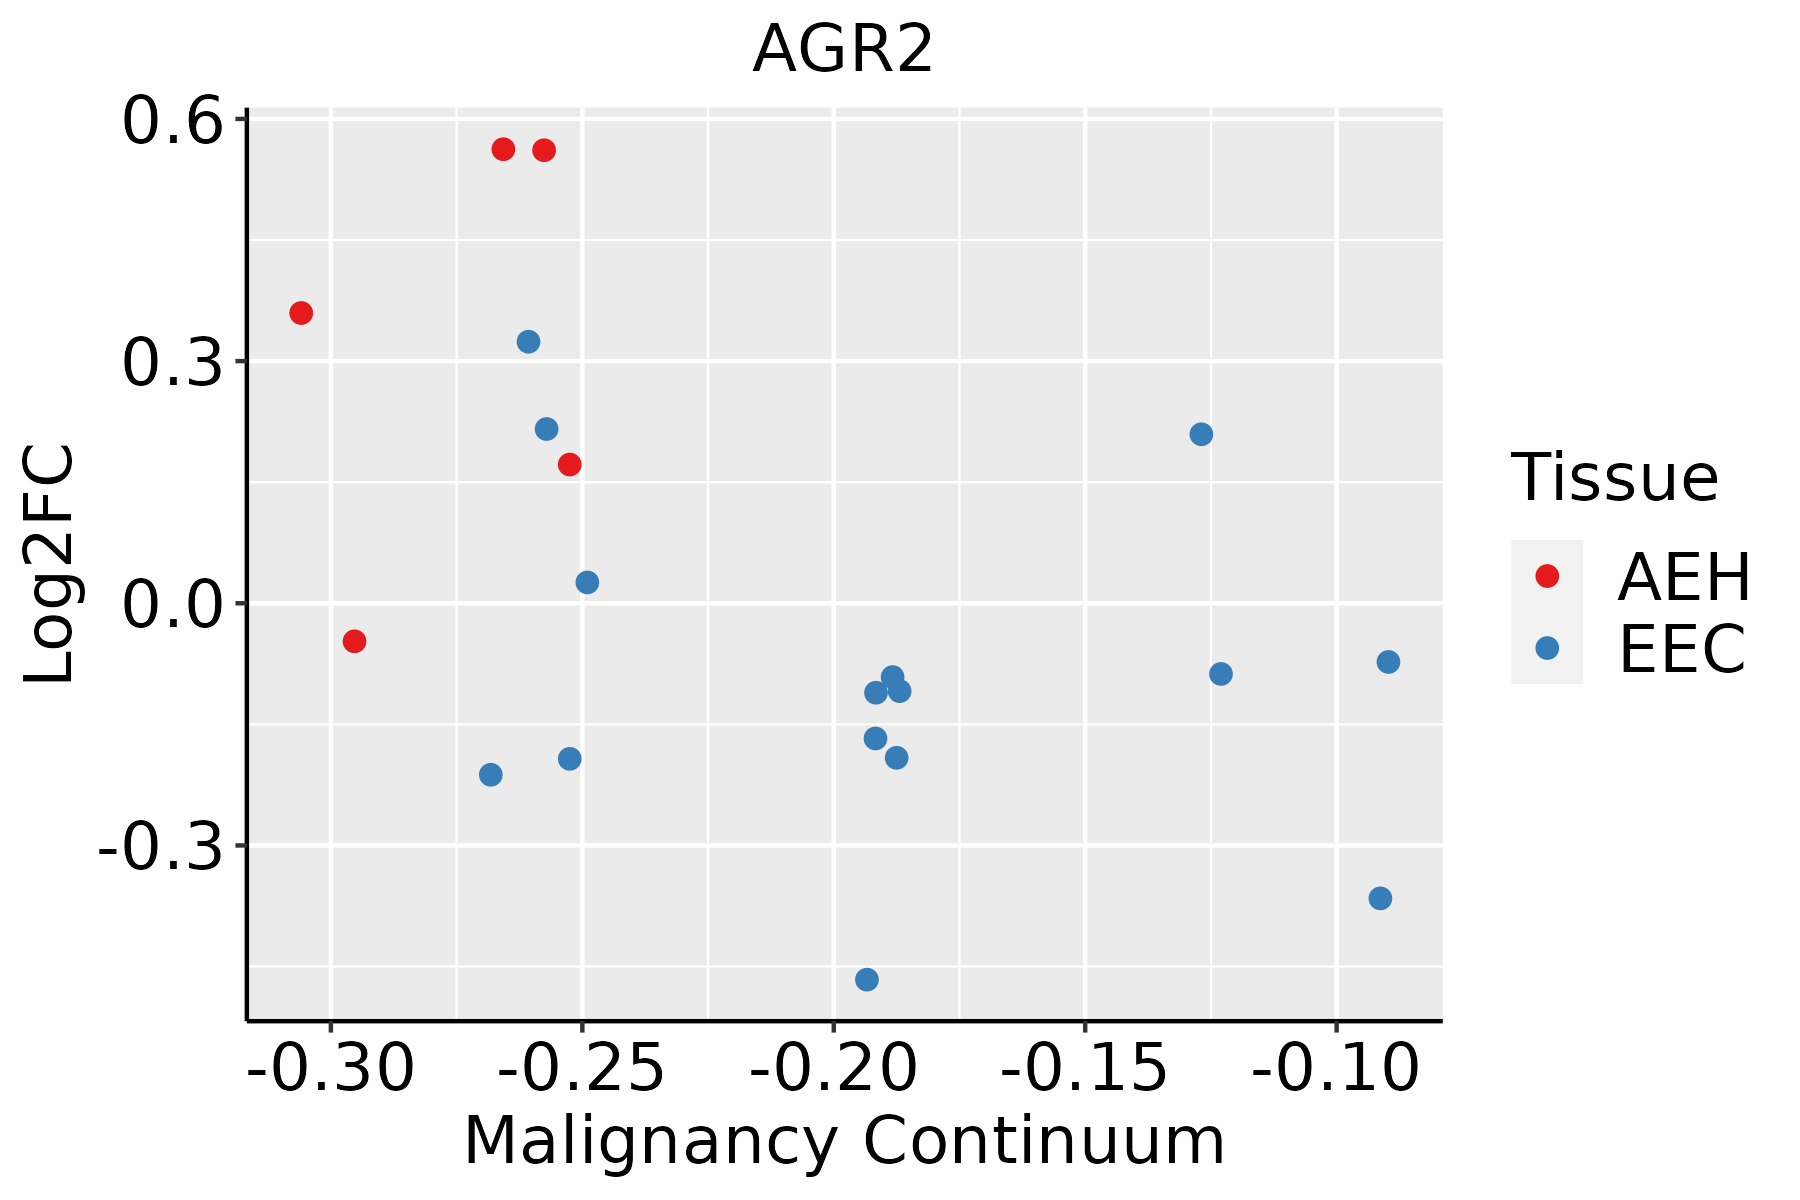 | AEH: Atypical endometrial hyperplasia |
| EEC: Endometrioid Cancer |
| Esophagus | 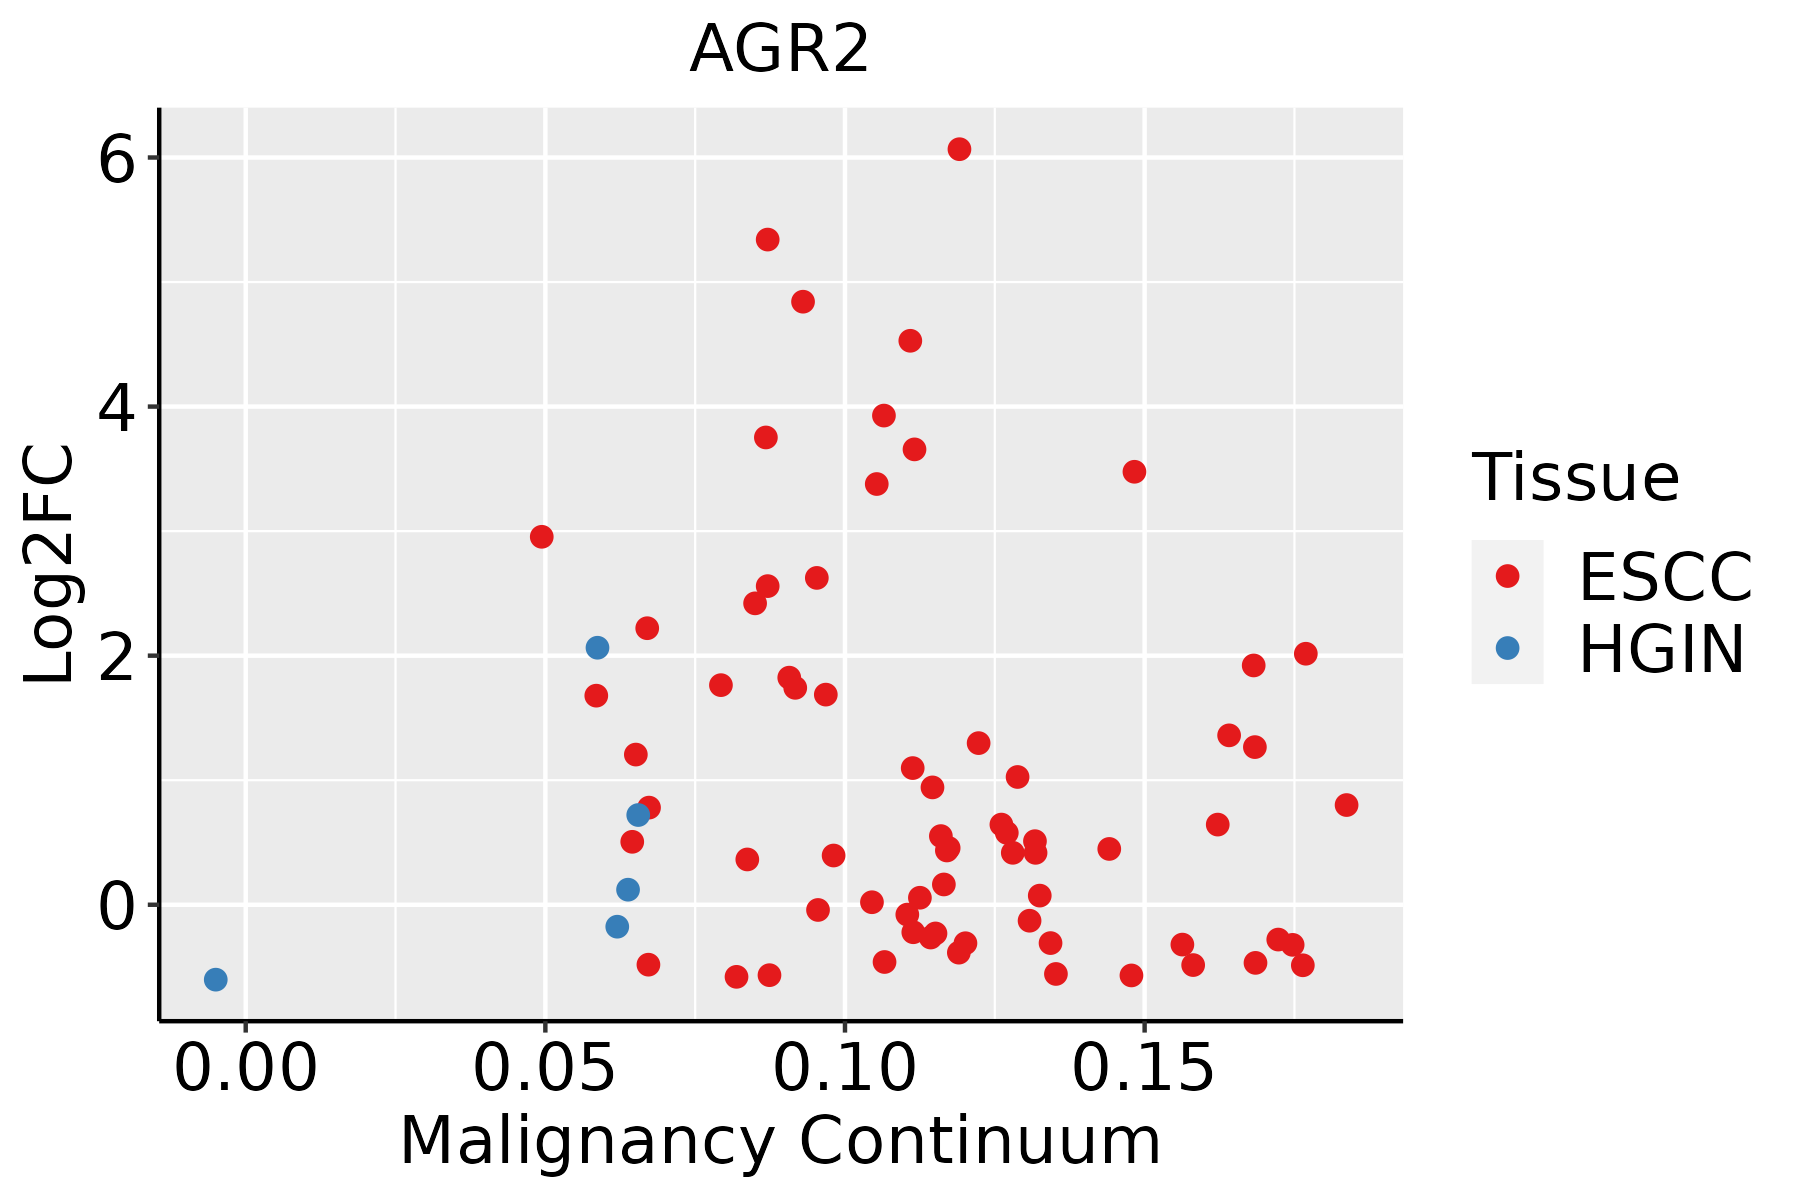 | ESCC: Esophageal squamous cell carcinoma |
| HGIN: High-grade intraepithelial neoplasias |
| LGIN: Low-grade intraepithelial neoplasias |
| GC | 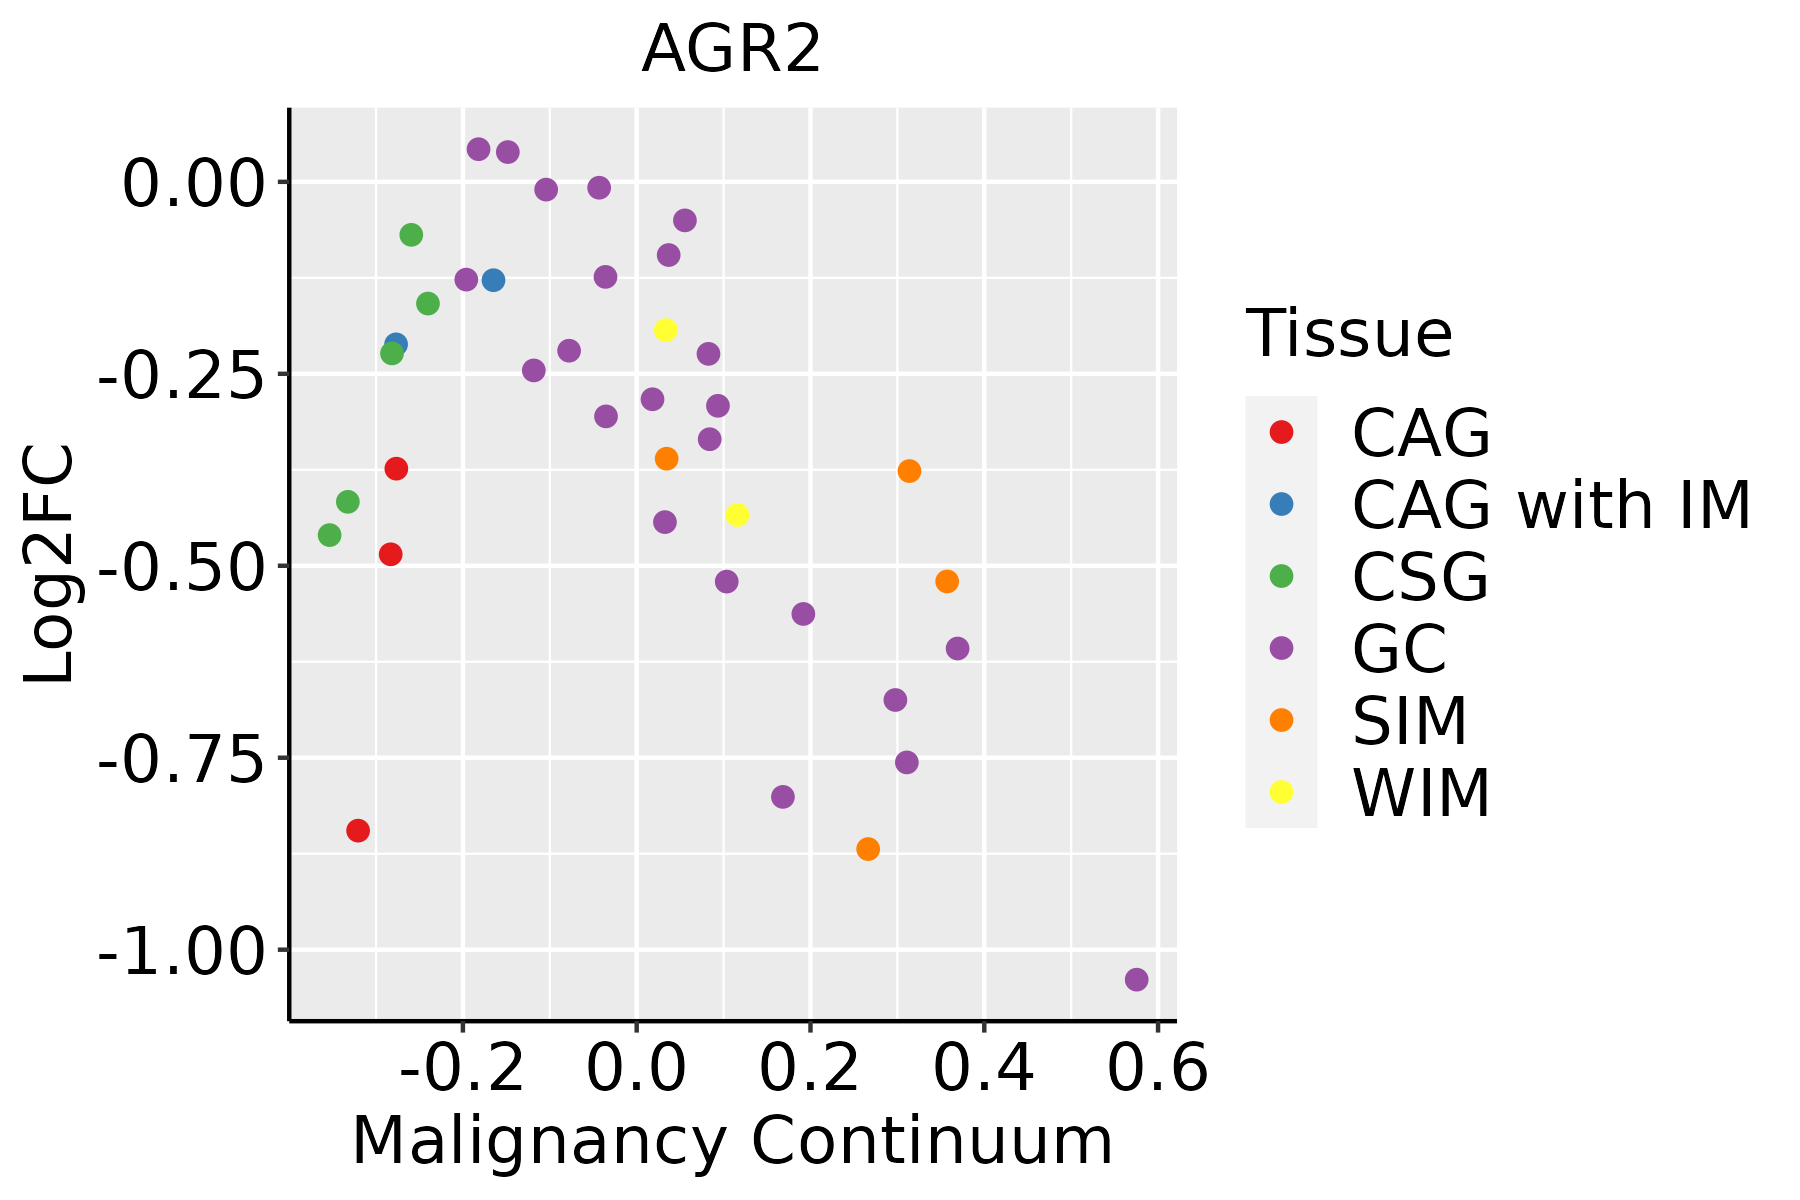 | CAG: Chronic atrophic gastritis |
| CAG with IM: Chronic atrophic gastritis with intestinal metaplasia |
| CSG: Chronic superficial gastritis |
| GC: Gastric cancer |
| SIM: Severe intestinal metaplasia |
| WIM: Wild intestinal metaplasia |
| Liver | 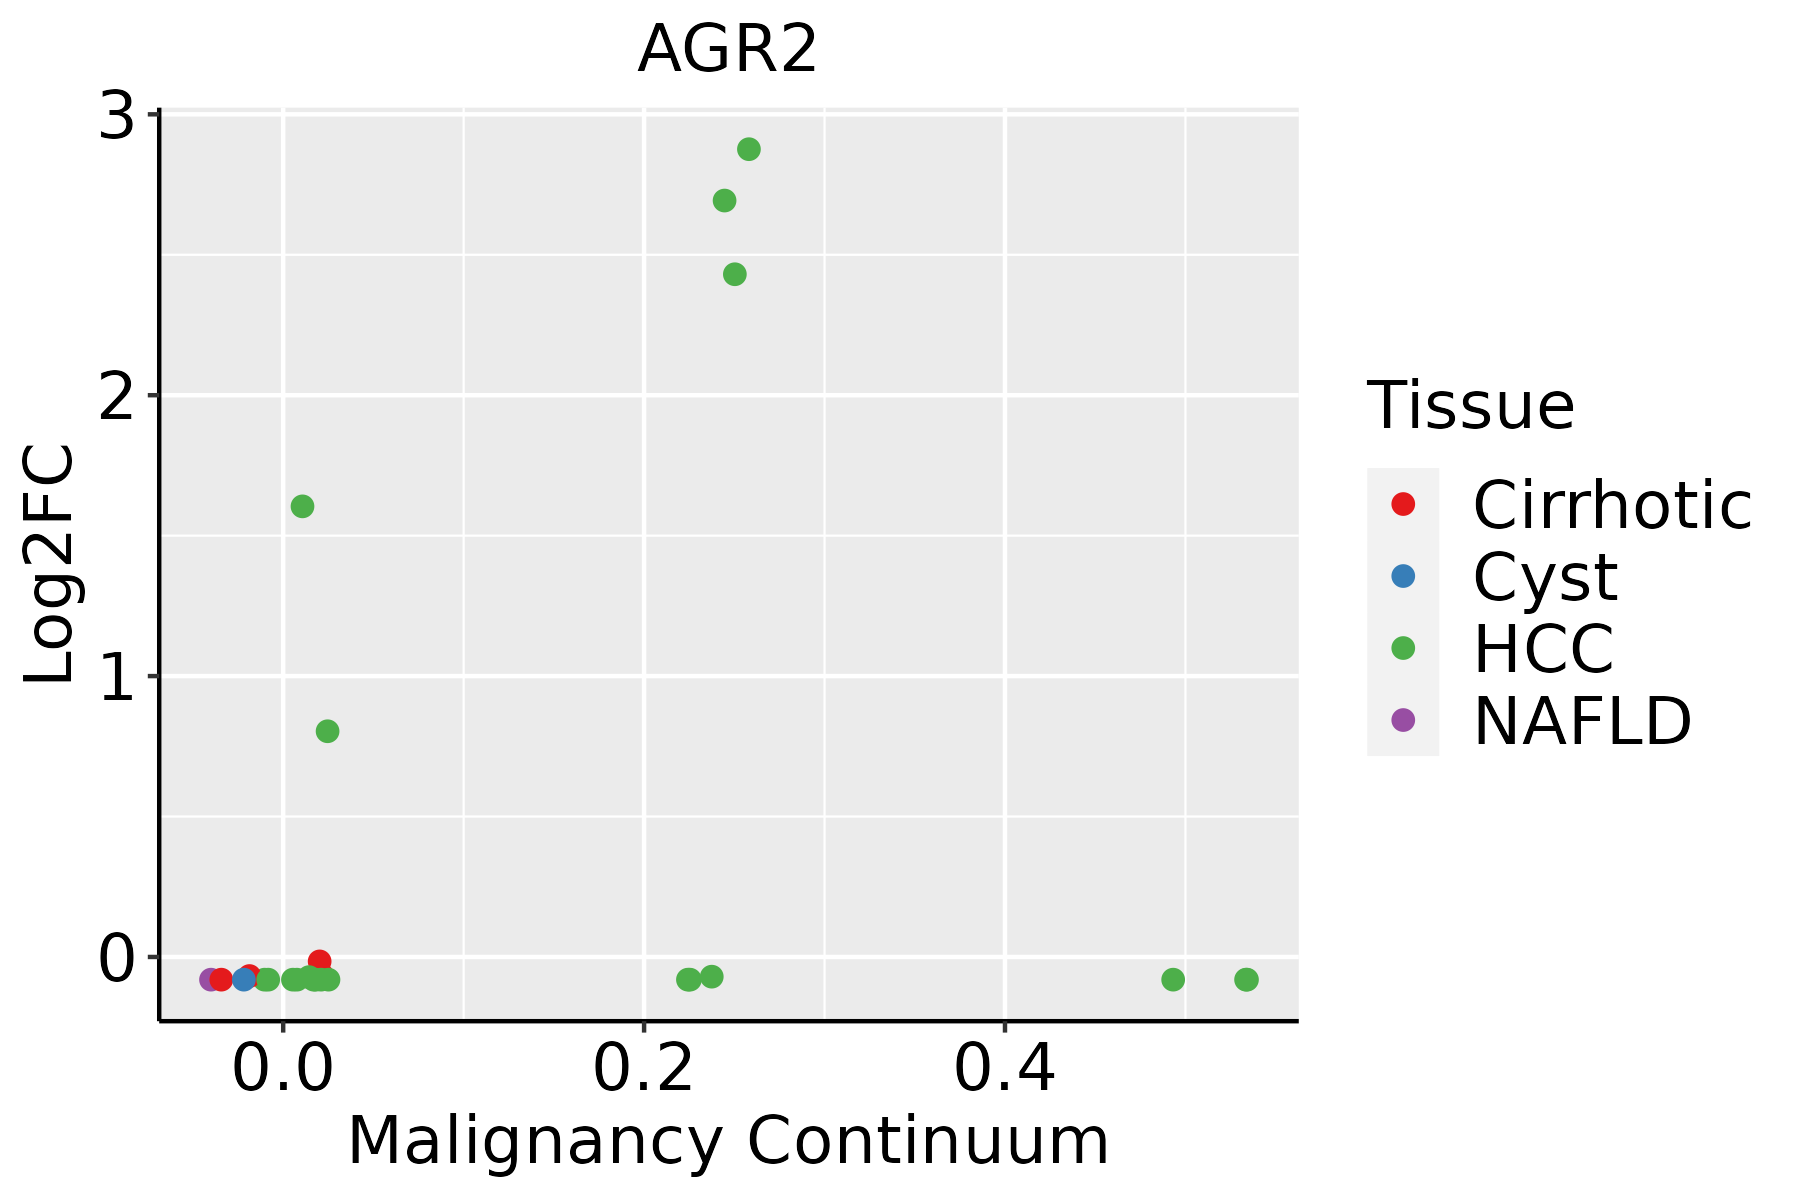 | HCC: Hepatocellular carcinoma |
| NAFLD: Non-alcoholic fatty liver disease |
| Lung | 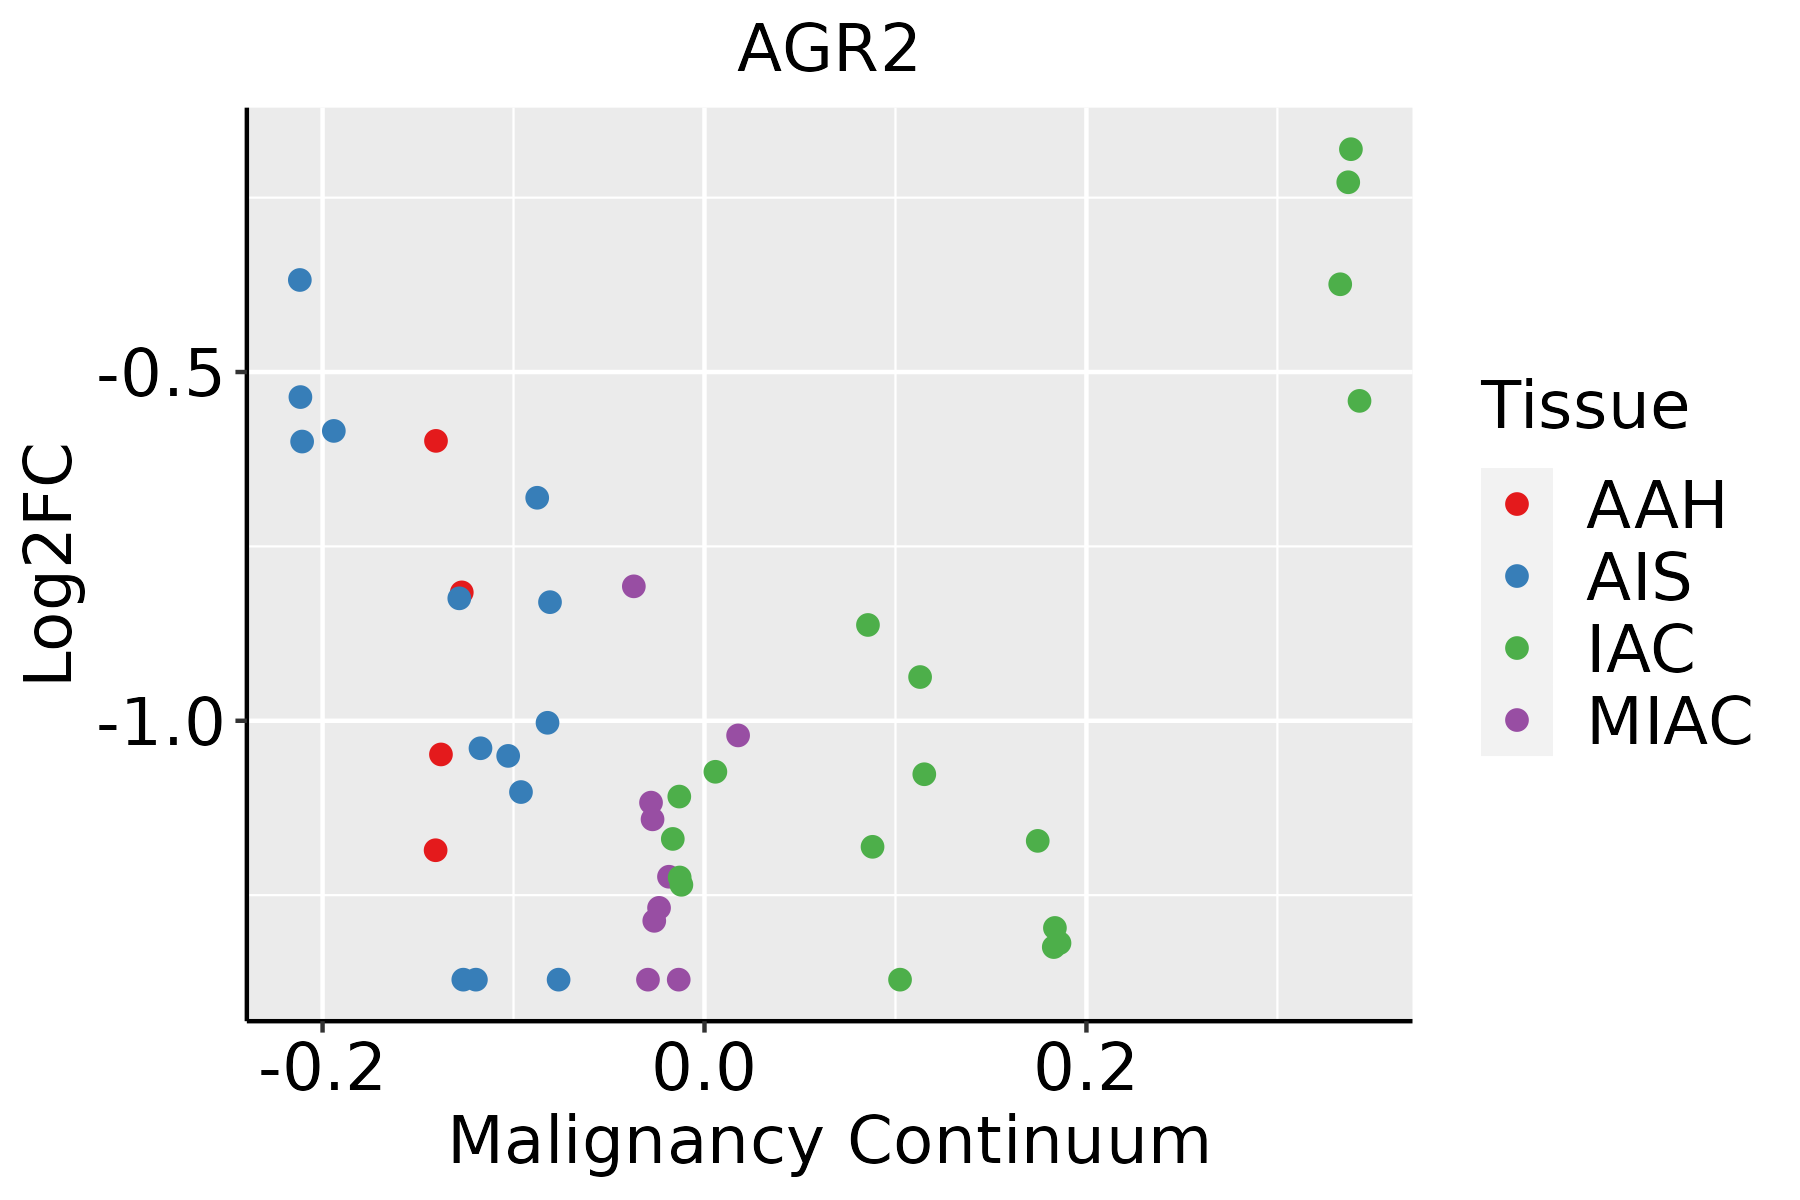 | AAH: Atypical adenomatous hyperplasia |
| AIS: Adenocarcinoma in situ |
| IAC: Invasive lung adenocarcinoma |
| MIA: Minimally invasive adenocarcinoma |
| Oral Cavity | 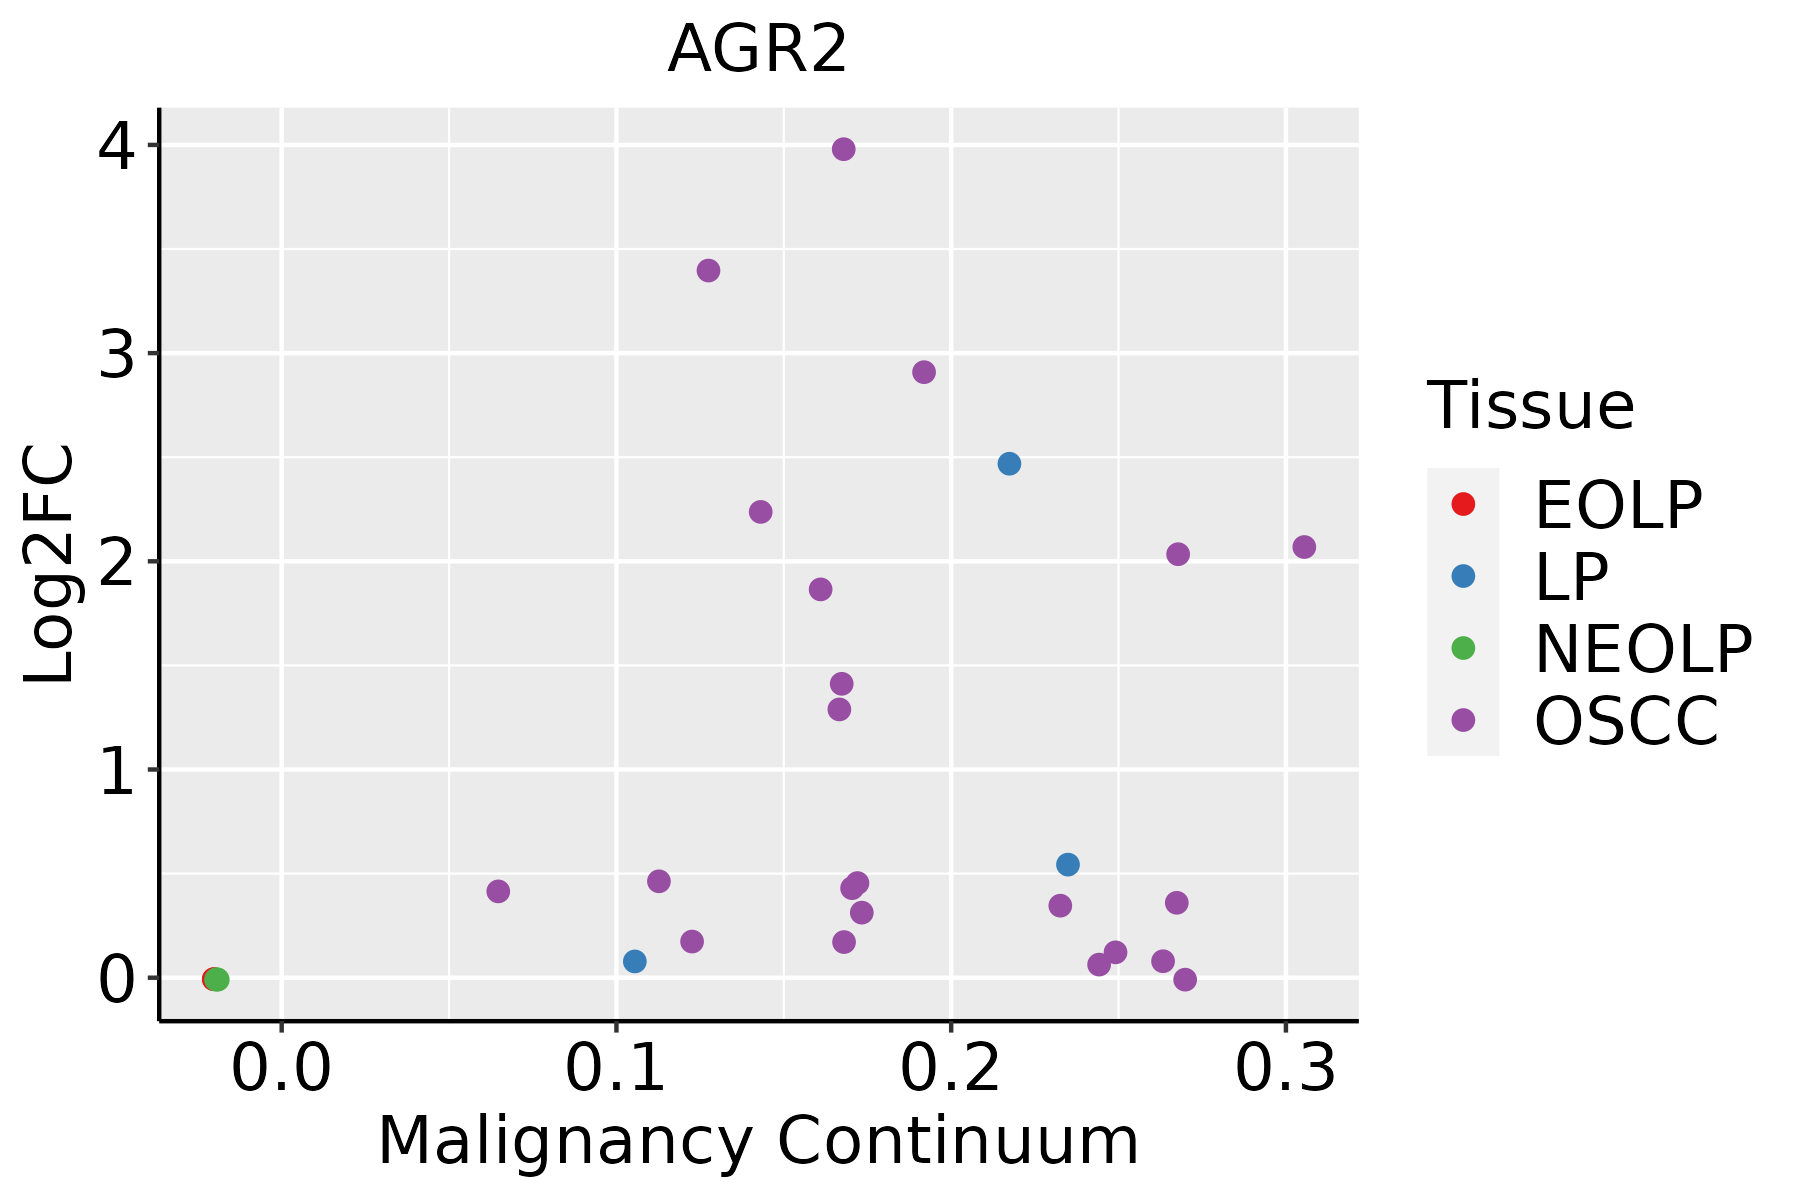 | EOLP: Erosive Oral lichen planus |
| LP: leukoplakia |
| NEOLP: Non-erosive oral lichen planus |
| OSCC: Oral squamous cell carcinoma |
| Prostate |  | BPH: Benign Prostatic Hyperplasia |
| Skin | 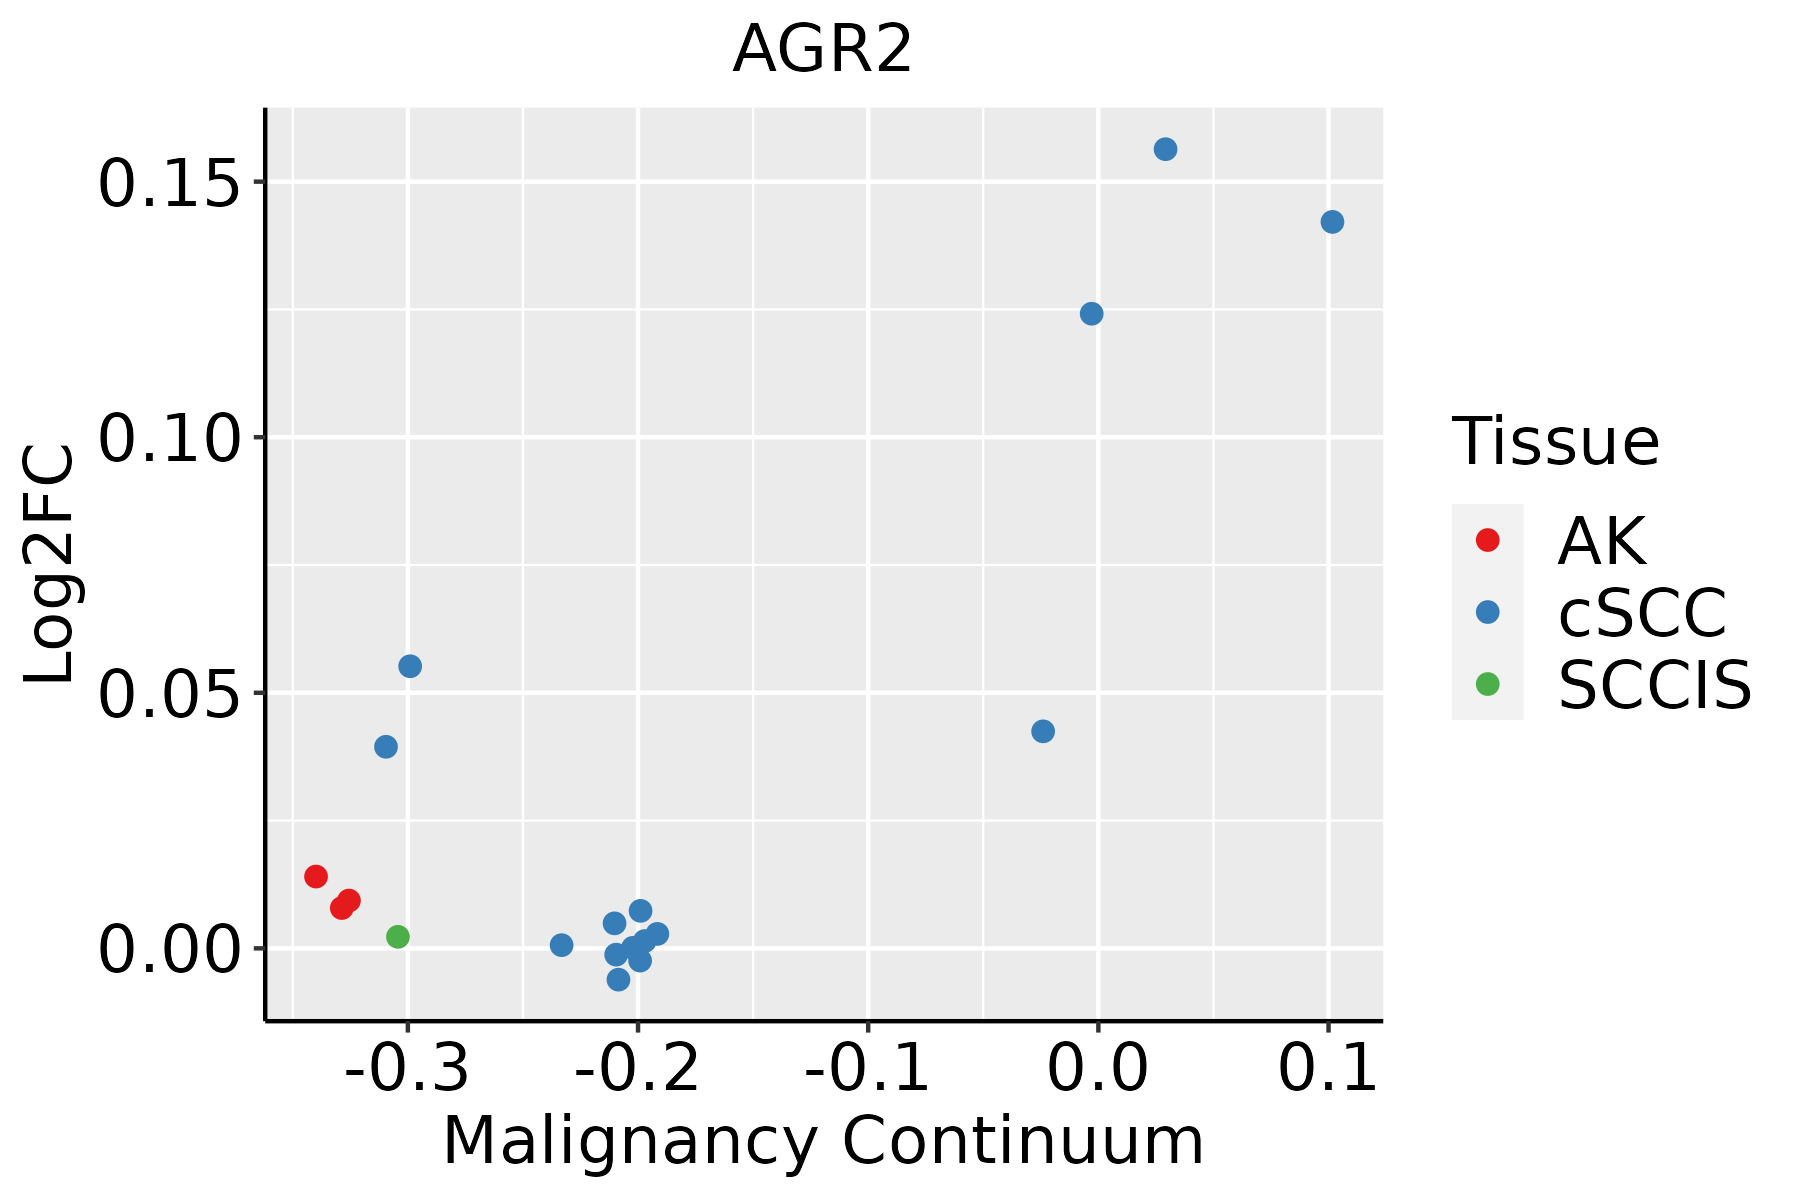 | AK: Actinic keratosis |
| cSCC: Cutaneous squamous cell carcinoma |
| SCCIS:squamous cell carcinoma in situ |
| Thyroid |  | ATC: Anaplastic thyroid cancer |
| HT: Hashimoto's thyroiditis |
| PTC: Papillary thyroid cancer |
| GO ID | Tissue | Disease Stage | Description | Gene Ratio | Bg Ratio | pvalue | p.adjust | Count |
| GO:003596725 | Esophagus | HGIN | cellular response to topologically incorrect protein | 41/2587 | 116/18723 | 4.07e-09 | 2.84e-07 | 41 |
| GO:003462020 | Esophagus | HGIN | cellular response to unfolded protein | 36/2587 | 96/18723 | 5.82e-09 | 3.88e-07 | 36 |
| GO:190589725 | Esophagus | HGIN | regulation of response to endoplasmic reticulum stress | 31/2587 | 82/18723 | 5.25e-08 | 2.91e-06 | 31 |
| GO:000698410 | Esophagus | HGIN | ER-nucleus signaling pathway | 19/2587 | 46/18723 | 4.28e-06 | 1.41e-04 | 19 |
| GO:007265920 | Esophagus | HGIN | protein localization to plasma membrane | 66/2587 | 284/18723 | 1.11e-05 | 3.18e-04 | 66 |
| GO:003096817 | Esophagus | HGIN | endoplasmic reticulum unfolded protein response | 24/2587 | 74/18723 | 3.39e-05 | 8.61e-04 | 24 |
| GO:190547518 | Esophagus | HGIN | regulation of protein localization to membrane | 43/2587 | 175/18723 | 9.45e-05 | 2.03e-03 | 43 |
| GO:199077818 | Esophagus | HGIN | protein localization to cell periphery | 71/2587 | 333/18723 | 1.05e-04 | 2.24e-03 | 71 |
| GO:00364996 | Esophagus | HGIN | PERK-mediated unfolded protein response | 9/2587 | 18/18723 | 2.70e-04 | 4.67e-03 | 9 |
| GO:190307619 | Esophagus | HGIN | regulation of protein localization to plasma membrane | 28/2587 | 104/18723 | 3.07e-04 | 5.15e-03 | 28 |
| GO:190437518 | Esophagus | HGIN | regulation of protein localization to cell periphery | 32/2587 | 125/18723 | 3.23e-04 | 5.39e-03 | 32 |
| GO:01404675 | Esophagus | HGIN | integrated stress response signaling | 9/2587 | 22/18723 | 1.64e-03 | 1.82e-02 | 9 |
| GO:19058985 | Esophagus | HGIN | positive regulation of response to endoplasmic reticulum stress | 12/2587 | 35/18723 | 1.80e-03 | 1.94e-02 | 12 |
| GO:003812717 | Esophagus | HGIN | ERBB signaling pathway | 29/2587 | 121/18723 | 1.83e-03 | 1.97e-02 | 29 |
| GO:190547718 | Esophagus | HGIN | positive regulation of protein localization to membrane | 26/2587 | 106/18723 | 2.17e-03 | 2.25e-02 | 26 |
| GO:00604794 | Esophagus | HGIN | lung cell differentiation | 9/2587 | 24/18723 | 3.33e-03 | 3.12e-02 | 9 |
| GO:19011848 | Esophagus | HGIN | regulation of ERBB signaling pathway | 20/2587 | 79/18723 | 4.56e-03 | 3.96e-02 | 20 |
| GO:190437718 | Esophagus | HGIN | positive regulation of protein localization to cell periphery | 18/2587 | 69/18723 | 4.94e-03 | 4.18e-02 | 18 |
| GO:000717317 | Esophagus | HGIN | epidermal growth factor receptor signaling pathway | 25/2587 | 108/18723 | 5.87e-03 | 4.77e-02 | 25 |
| GO:0034976111 | Esophagus | ESCC | response to endoplasmic reticulum stress | 192/8552 | 256/18723 | 7.15e-22 | 1.30e-19 | 192 |
| Hugo Symbol | Variant Class | Variant Classification | dbSNP RS | HGVSc | HGVSp | HGVSp Short | SWISSPROT | BIOTYPE | SIFT | PolyPhen | Tumor Sample Barcode | Tissue | Histology | Sex | Age | Stage | Therapy Types | Drugs | Outcome |
| AGR2 | SNV | Missense_Mutation | rs375782337 | c.418G>A | p.Asp140Asn | p.D140N | O95994 | protein_coding | deleterious(0) | probably_damaging(0.956) | TCGA-2W-A8YY-01 | Cervix | cervical & endocervical cancer | Female | <65 | I/II | Chemotherapy | cisplatin | CR |
| AGR2 | SNV | Missense_Mutation | novel | c.226N>G | p.His76Asp | p.H76D | O95994 | protein_coding | deleterious(0.01) | probably_damaging(0.964) | TCGA-JW-A5VL-01 | Cervix | cervical & endocervical cancer | Female | <65 | I/II | Unknown | Unknown | SD |
| AGR2 | SNV | Missense_Mutation | | c.281N>G | p.Asn94Ser | p.N94S | O95994 | protein_coding | tolerated(0.87) | benign(0) | TCGA-CA-6718-01 | Colorectum | colon adenocarcinoma | Male | <65 | I/II | Unknown | Unknown | PD |
| AGR2 | SNV | Missense_Mutation | rs755871634 | c.443N>A | p.Arg148His | p.R148H | O95994 | protein_coding | tolerated(0.14) | benign(0.006) | TCGA-AP-A1DK-01 | Endometrium | uterine corpus endometrioid carcinoma | Female | <65 | I/II | Unknown | Unknown | SD |
| AGR2 | SNV | Missense_Mutation | | c.93G>T | p.Lys31Asn | p.K31N | O95994 | protein_coding | tolerated(0.05) | benign(0.444) | TCGA-AX-A0J0-01 | Endometrium | uterine corpus endometrioid carcinoma | Female | <65 | I/II | Unknown | Unknown | SD |
| AGR2 | SNV | Missense_Mutation | novel | c.31C>A | p.Leu11Ile | p.L11I | O95994 | protein_coding | deleterious(0.03) | benign(0.048) | TCGA-AX-A2HC-01 | Endometrium | uterine corpus endometrioid carcinoma | Female | <65 | III/IV | Chemotherapy | paclitaxel | PD |
| AGR2 | SNV | Missense_Mutation | | c.457N>A | p.Glu153Lys | p.E153K | O95994 | protein_coding | tolerated(0.09) | benign(0.227) | TCGA-AX-A2HD-01 | Endometrium | uterine corpus endometrioid carcinoma | Female | >=65 | III/IV | Unknown | Unknown | SD |
| AGR2 | SNV | Missense_Mutation | | c.264N>T | p.Lys88Asn | p.K88N | O95994 | protein_coding | deleterious(0) | probably_damaging(0.942) | TCGA-AX-A2HD-01 | Endometrium | uterine corpus endometrioid carcinoma | Female | >=65 | III/IV | Unknown | Unknown | SD |
| AGR2 | SNV | Missense_Mutation | rs755871634 | c.443N>A | p.Arg148His | p.R148H | O95994 | protein_coding | tolerated(0.14) | benign(0.006) | TCGA-BG-A0LX-01 | Endometrium | uterine corpus endometrioid carcinoma | Female | <65 | I/II | Unknown | Unknown | SD |
| AGR2 | SNV | Missense_Mutation | | c.264N>T | p.Lys88Asn | p.K88N | O95994 | protein_coding | deleterious(0) | probably_damaging(0.942) | TCGA-D1-A103-01 | Endometrium | uterine corpus endometrioid carcinoma | Female | >=65 | I/II | Unknown | Unknown | SD |


