| Tissue | Expression Dynamics | Abbreviation |
| Cervix | 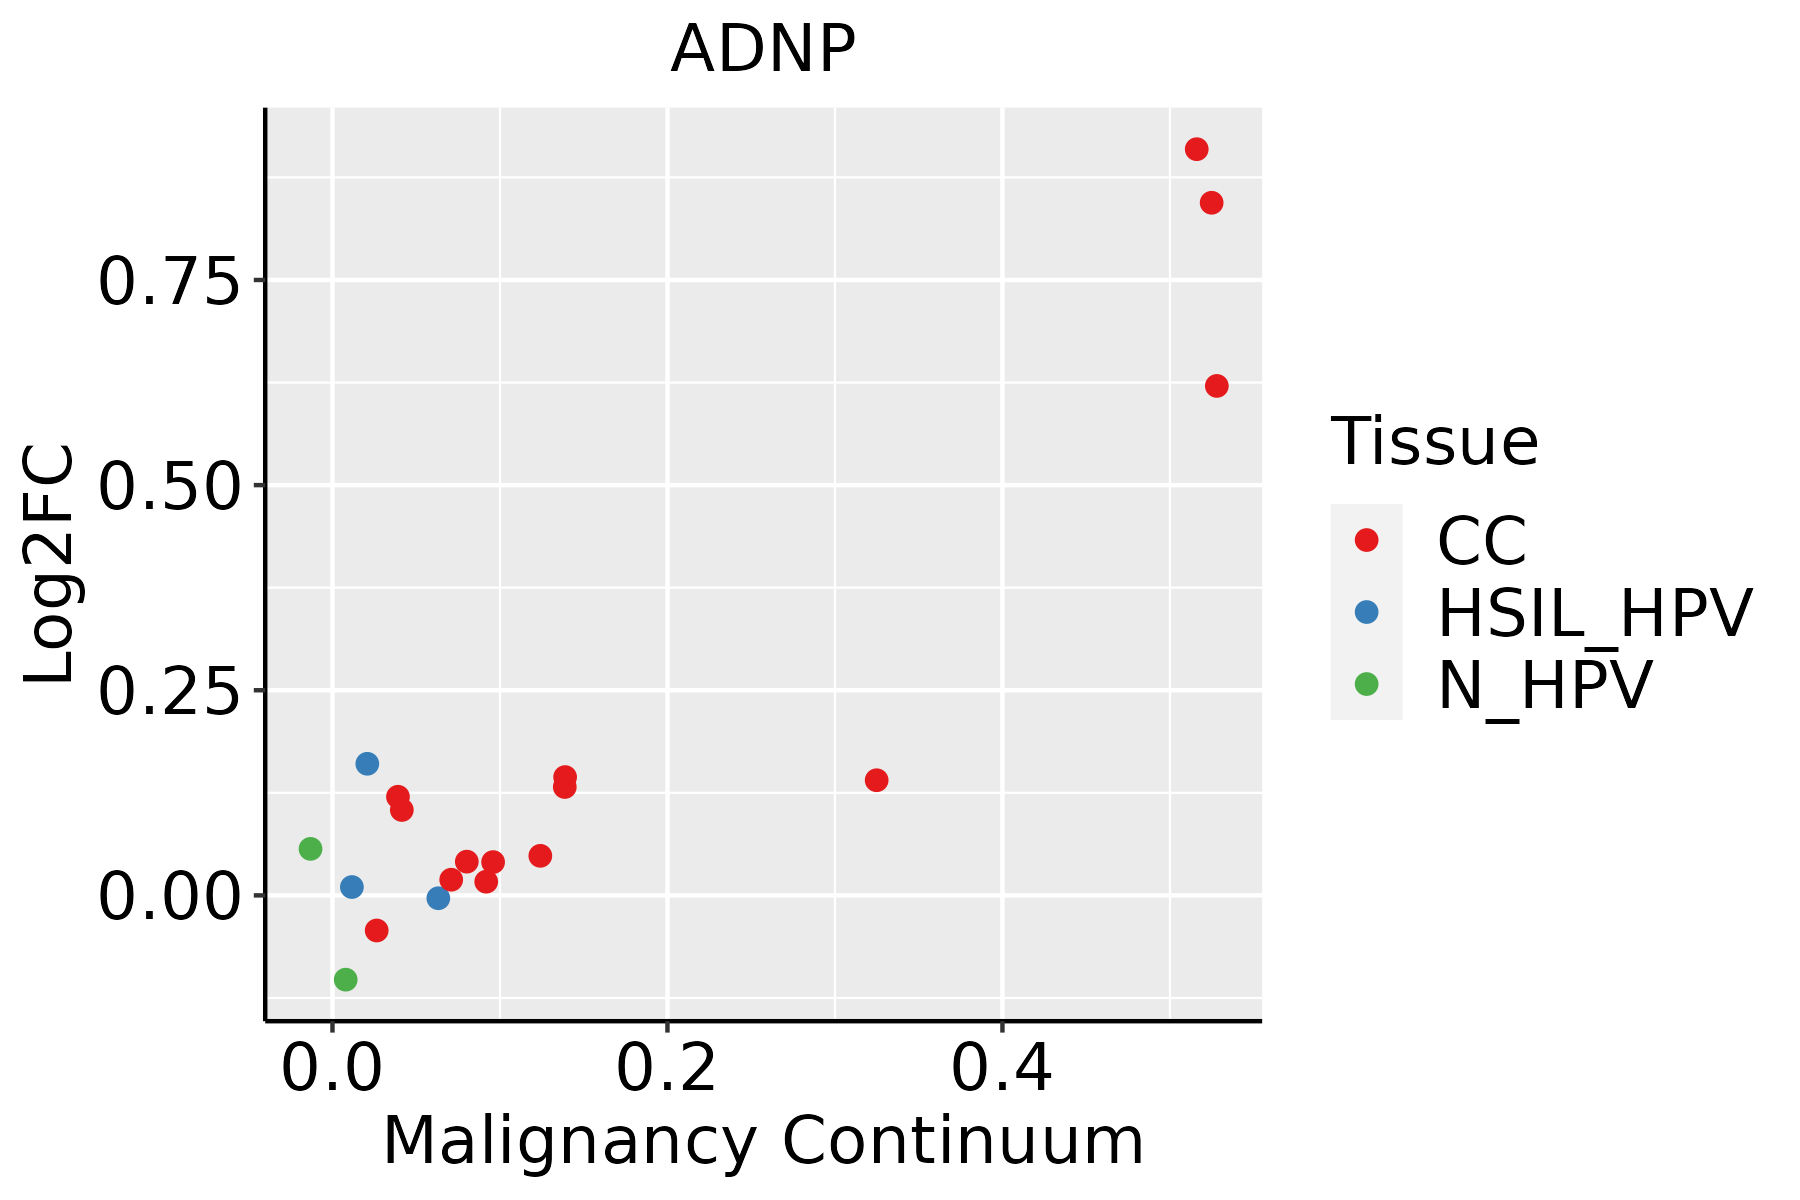 | CC: Cervix cancer |
| HSIL_HPV: HPV-infected high-grade squamous intraepithelial lesions |
| N_HPV: HPV-infected normal cervix |
| Colorectum (GSE201348) |  | FAP: Familial adenomatous polyposis |
| CRC: Colorectal cancer |
| Colorectum (HTA11) |  | AD: Adenomas |
| SER: Sessile serrated lesions |
| MSI-H: Microsatellite-high colorectal cancer |
| MSS: Microsatellite stable colorectal cancer |
| Esophagus | 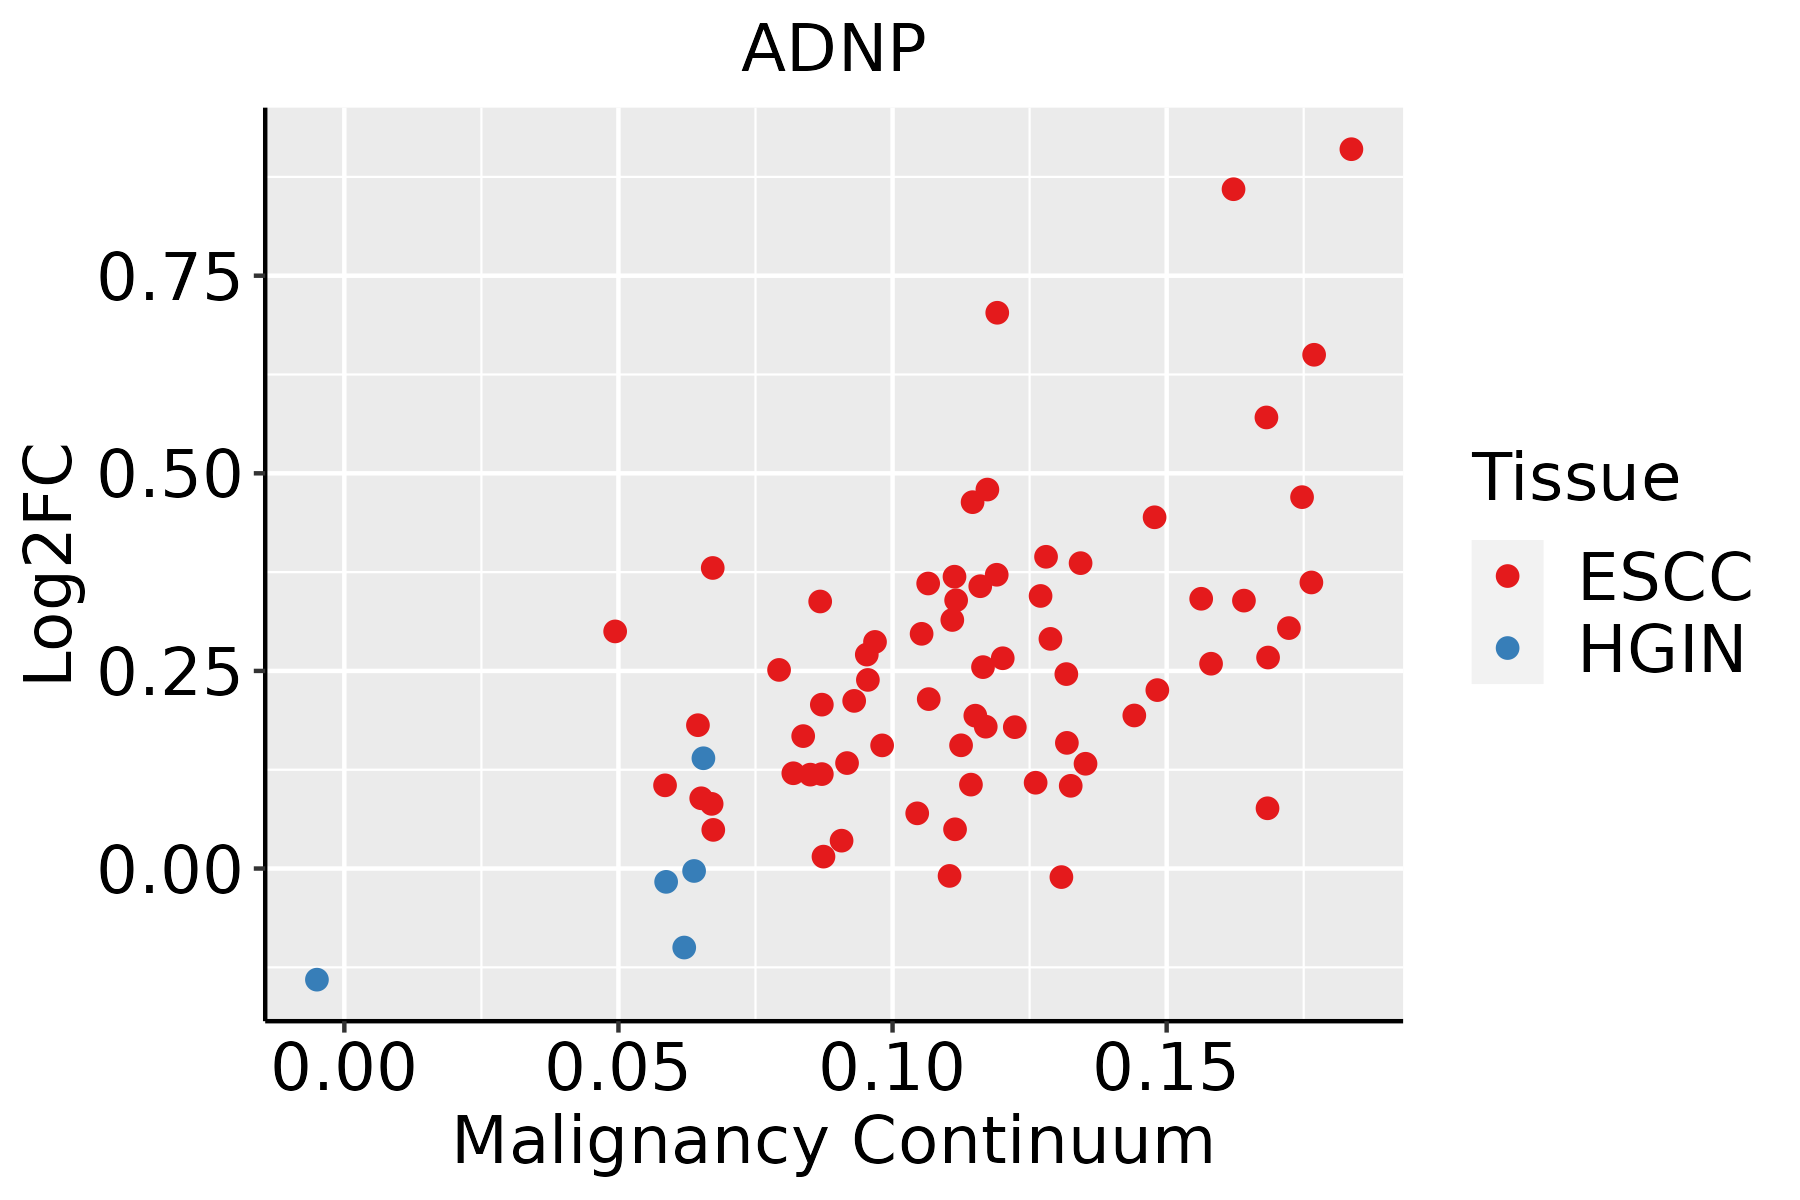 | ESCC: Esophageal squamous cell carcinoma |
| HGIN: High-grade intraepithelial neoplasias |
| LGIN: Low-grade intraepithelial neoplasias |
| Liver |  | HCC: Hepatocellular carcinoma |
| NAFLD: Non-alcoholic fatty liver disease |
| Lung | 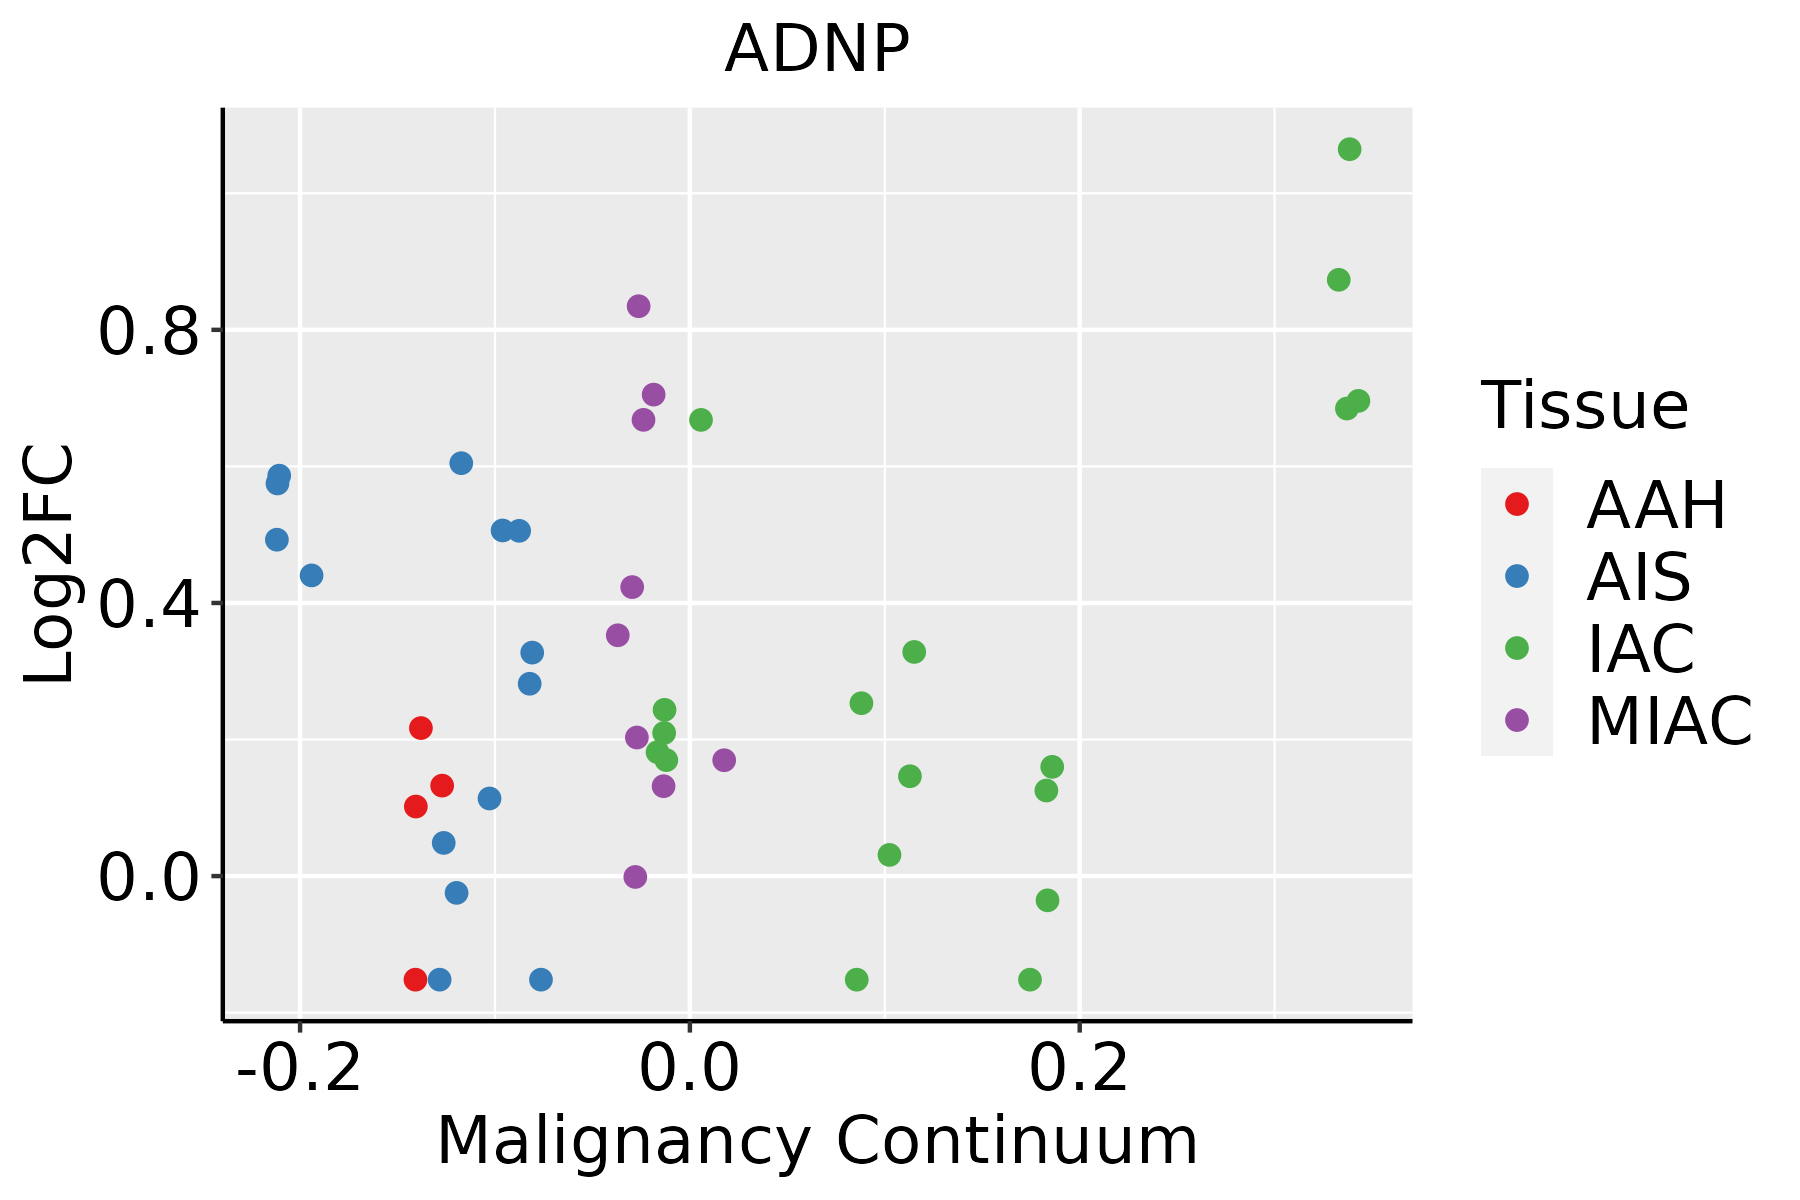 | AAH: Atypical adenomatous hyperplasia |
| AIS: Adenocarcinoma in situ |
| IAC: Invasive lung adenocarcinoma |
| MIA: Minimally invasive adenocarcinoma |
| Oral Cavity | 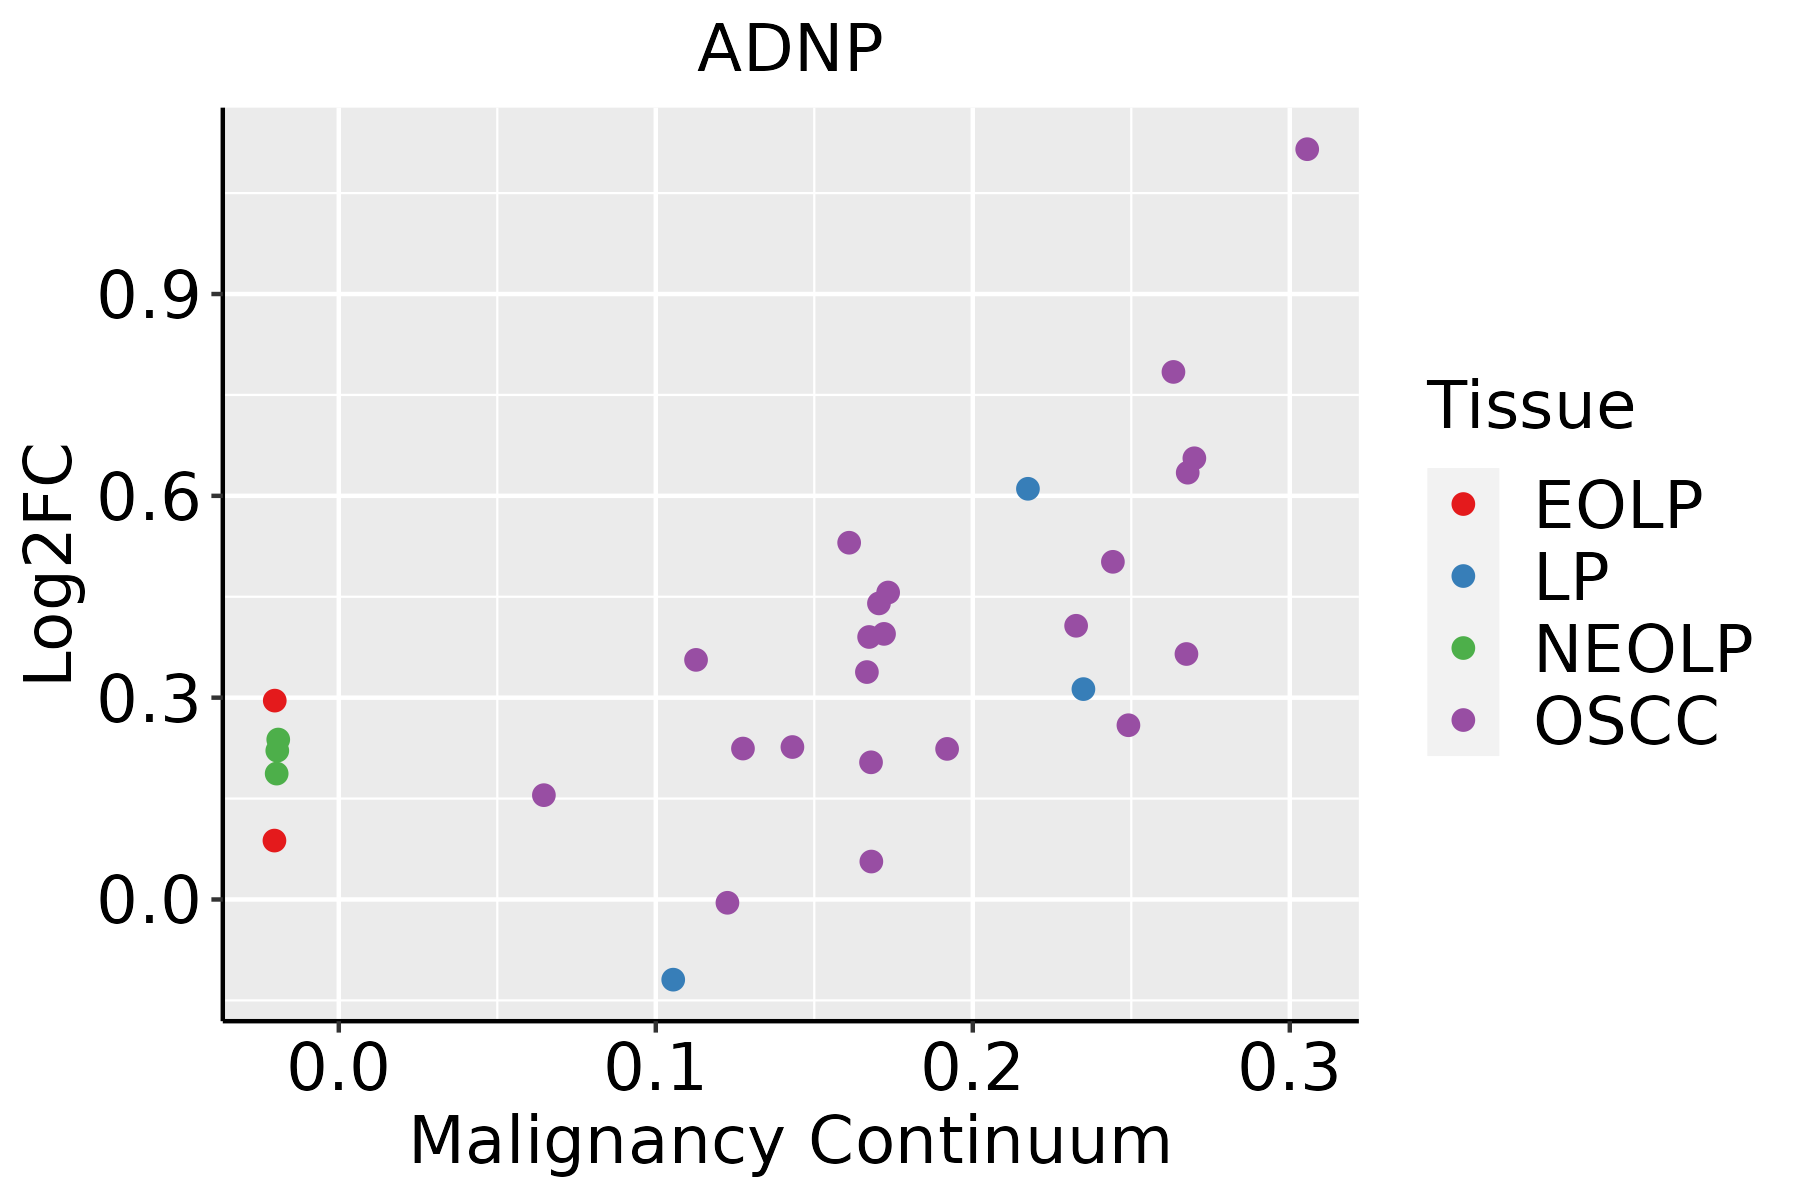 | EOLP: Erosive Oral lichen planus |
| LP: leukoplakia |
| NEOLP: Non-erosive oral lichen planus |
| OSCC: Oral squamous cell carcinoma |
| Prostate | 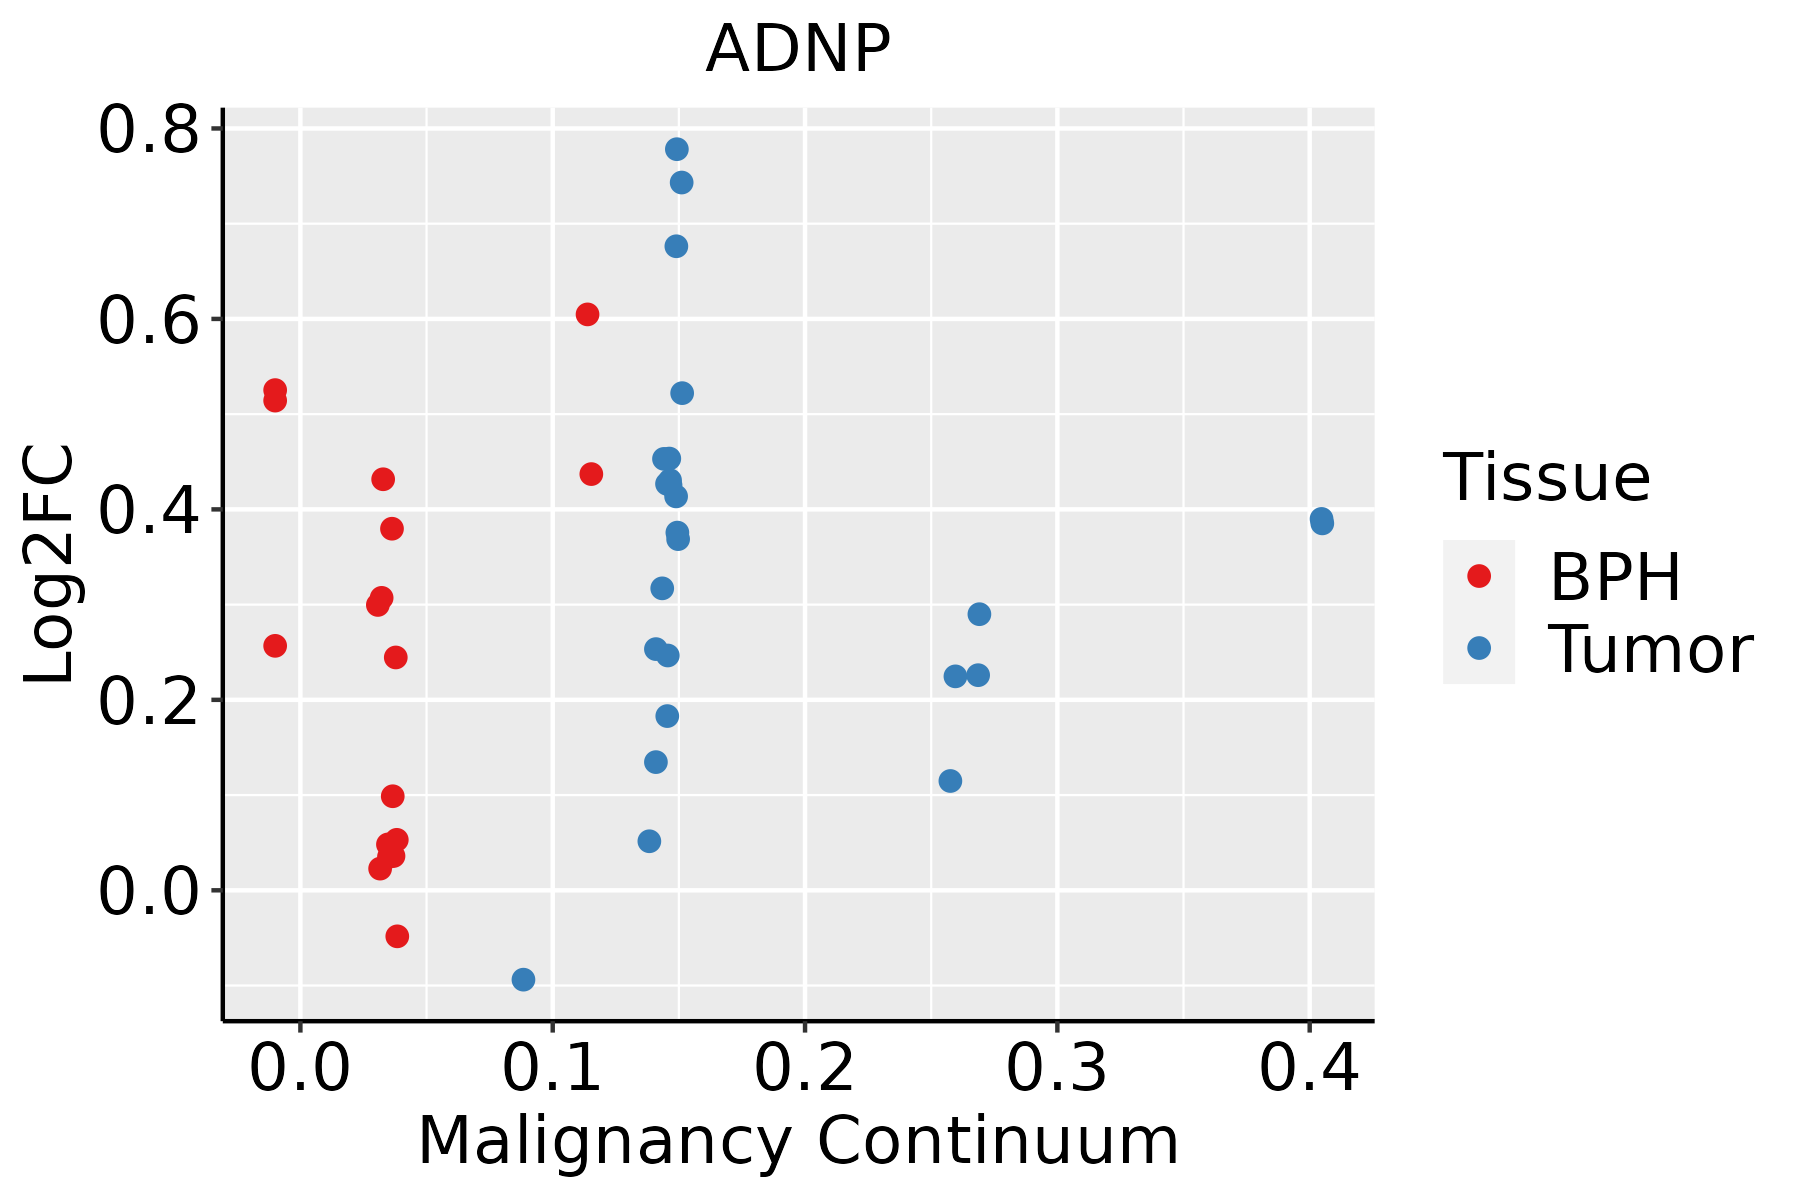 | BPH: Benign Prostatic Hyperplasia |
| Skin | 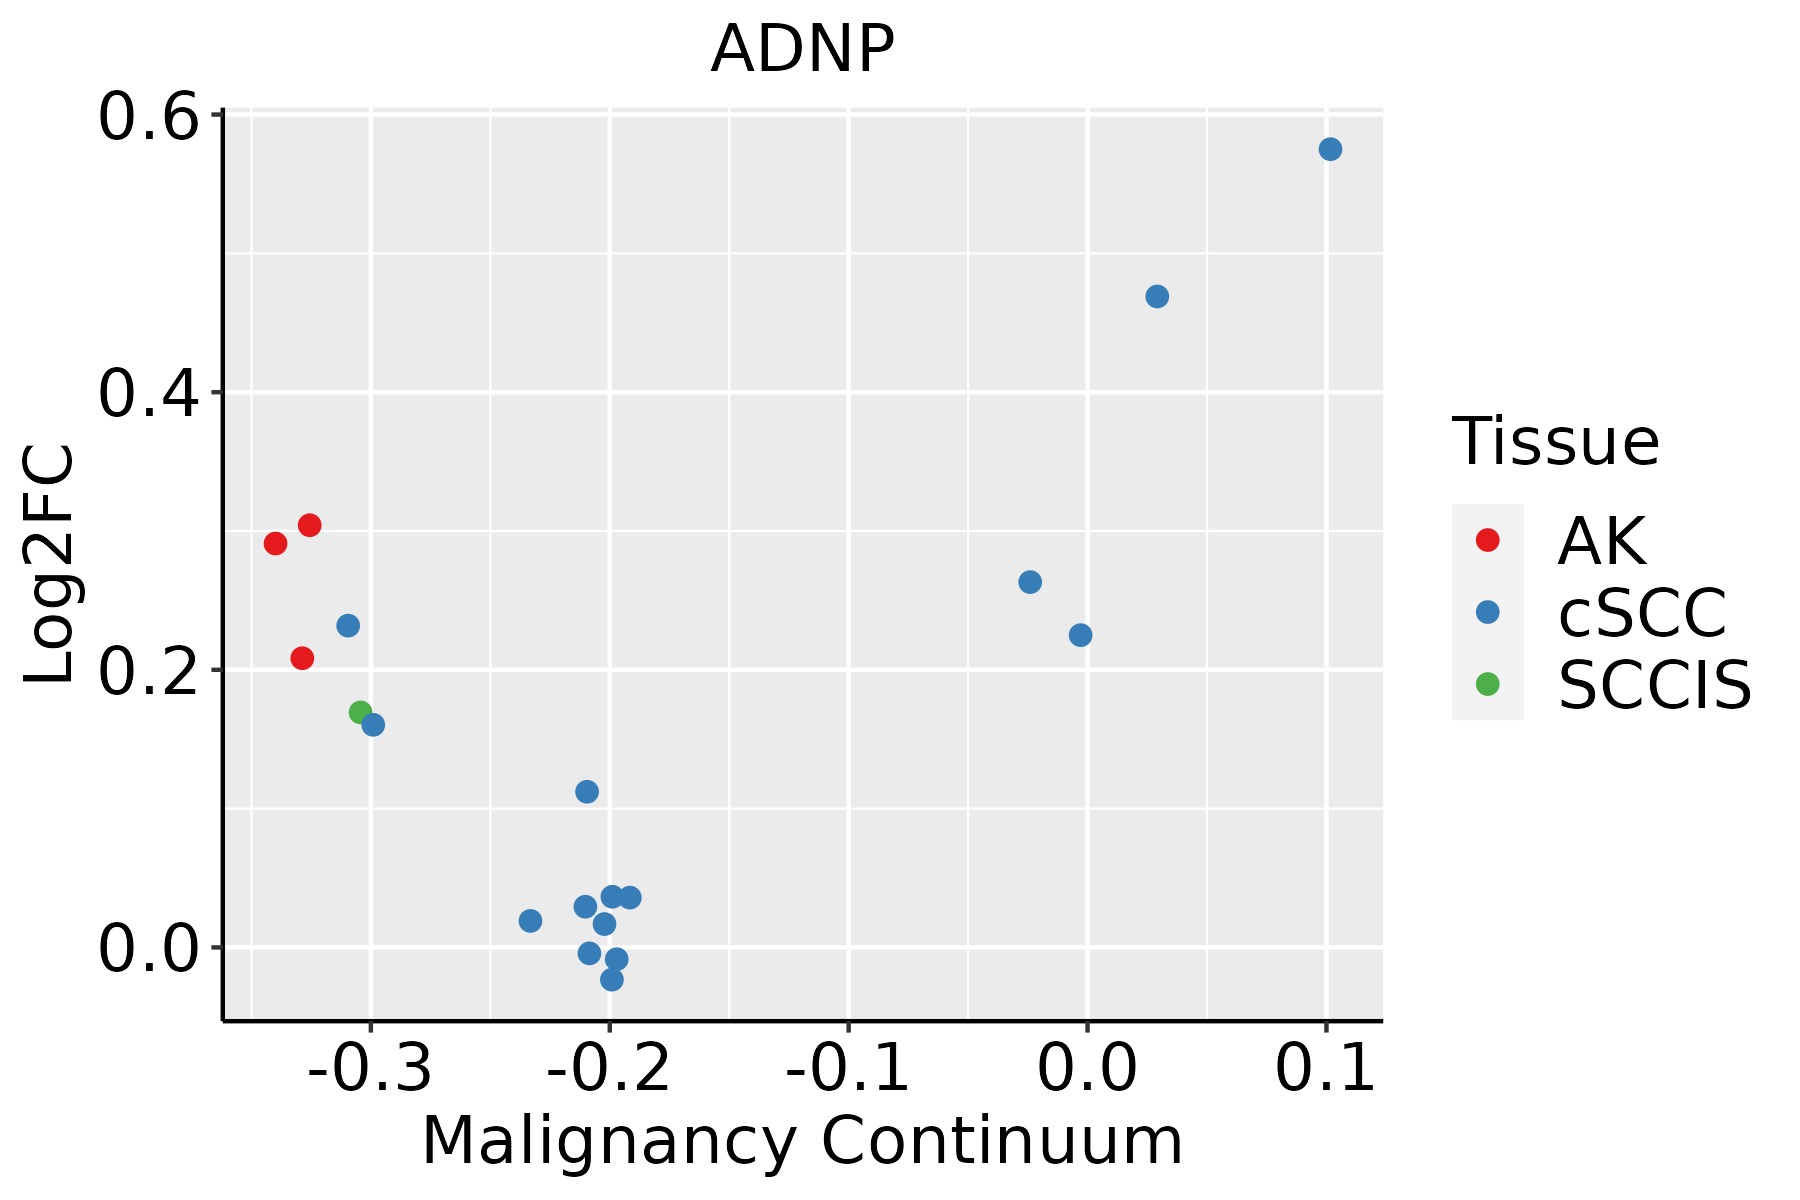 | AK: Actinic keratosis |
| cSCC: Cutaneous squamous cell carcinoma |
| SCCIS:squamous cell carcinoma in situ |
| Thyroid | 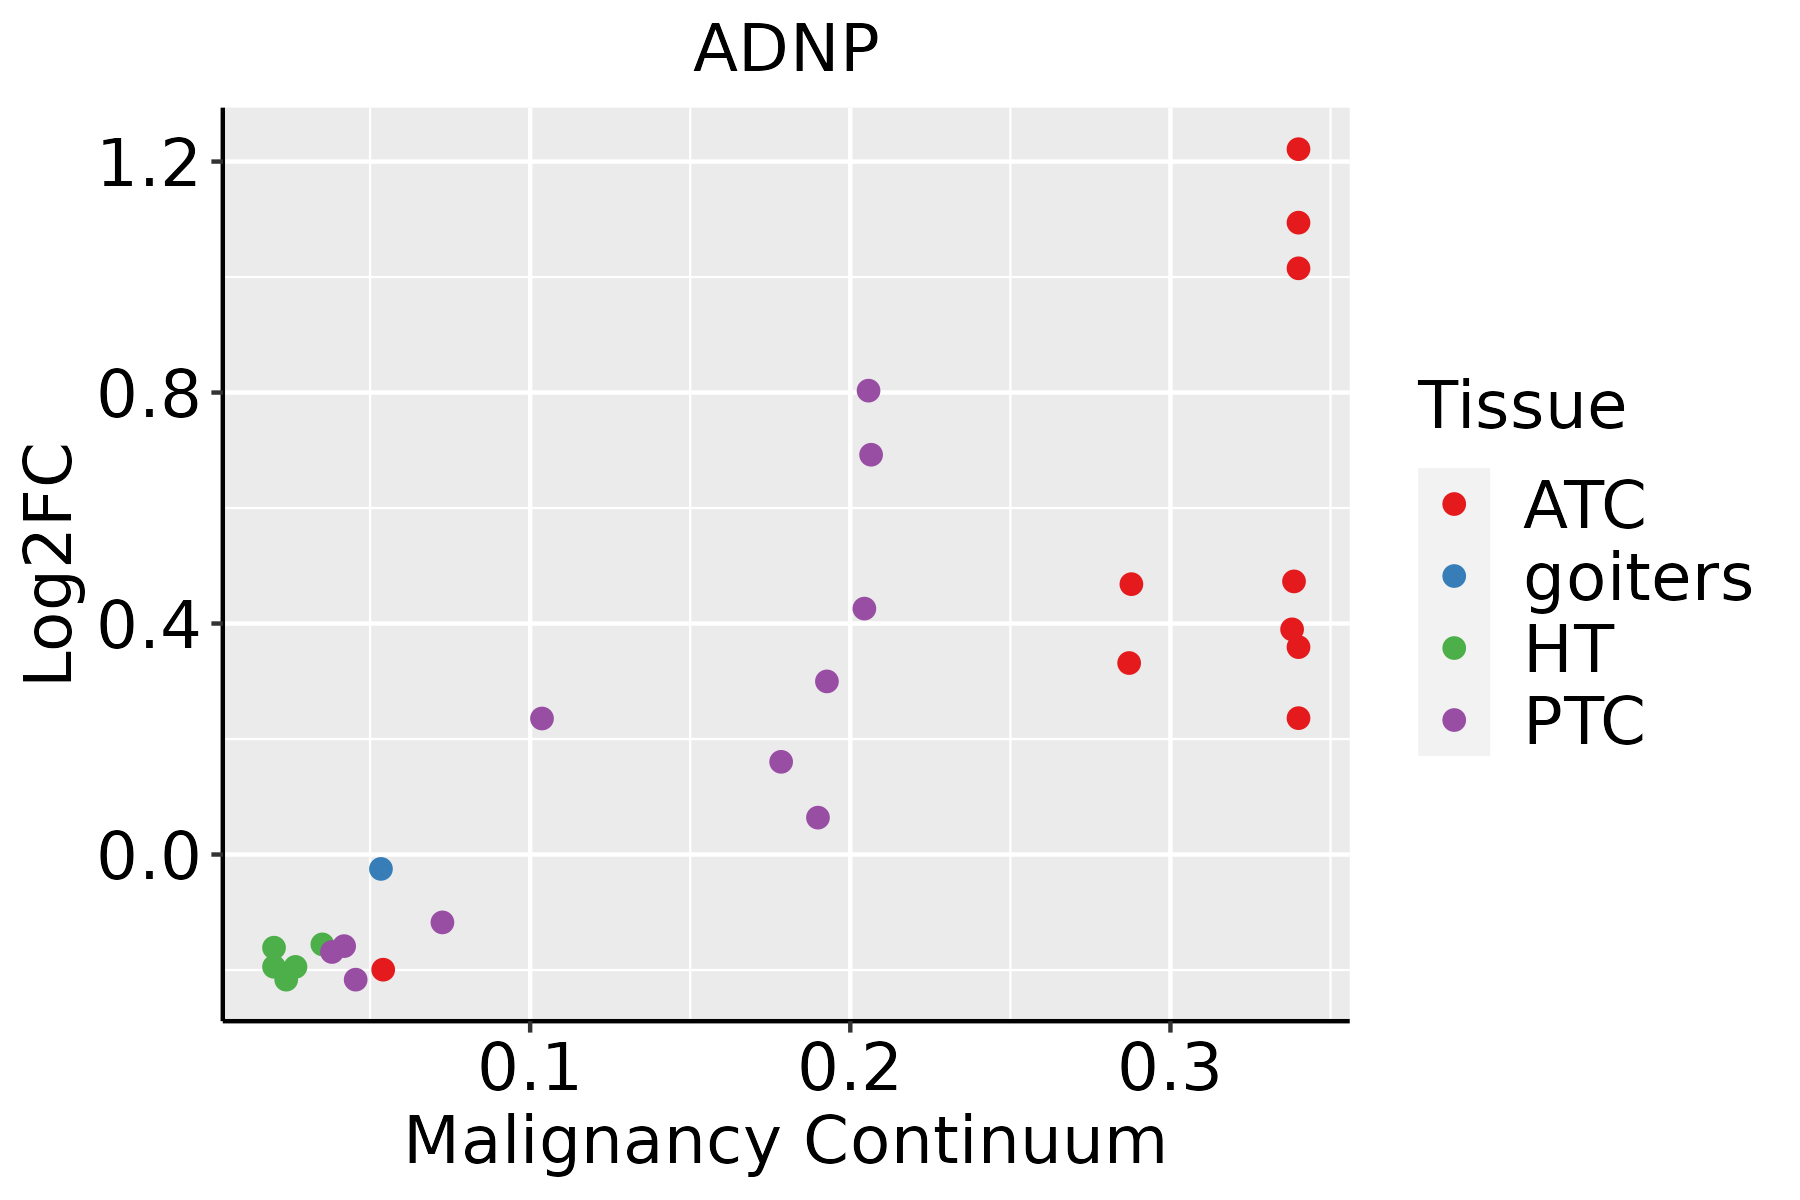 | ATC: Anaplastic thyroid cancer |
| HT: Hashimoto's thyroiditis |
| PTC: Papillary thyroid cancer |
| GO ID | Tissue | Disease Stage | Description | Gene Ratio | Bg Ratio | pvalue | p.adjust | Count |
| GO:00508085 | Lung | IAC | synapse organization | 65/2061 | 426/18723 | 4.05e-03 | 3.31e-02 | 65 |
| GO:0033483 | Lung | IAC | gas homeostasis | 5/2061 | 11/18723 | 4.20e-03 | 3.36e-02 | 5 |
| GO:00507723 | Lung | IAC | positive regulation of axonogenesis | 17/2061 | 79/18723 | 4.91e-03 | 3.78e-02 | 17 |
| GO:00507704 | Lung | IAC | regulation of axonogenesis | 28/2061 | 154/18723 | 5.22e-03 | 3.97e-02 | 28 |
| GO:00109761 | Lung | IAC | positive regulation of neuron projection development | 29/2061 | 163/18723 | 6.20e-03 | 4.47e-02 | 29 |
| GO:00320915 | Lung | IAC | negative regulation of protein binding | 19/2061 | 94/18723 | 6.26e-03 | 4.48e-02 | 19 |
| GO:00305165 | Lung | IAC | regulation of axon extension | 19/2061 | 95/18723 | 7.04e-03 | 4.83e-02 | 19 |
| GO:003432912 | Lung | AIS | cell junction assembly | 84/1849 | 420/18723 | 2.16e-10 | 5.71e-08 | 84 |
| GO:004851112 | Lung | AIS | rhythmic process | 61/1849 | 298/18723 | 2.63e-08 | 3.40e-06 | 61 |
| GO:006056012 | Lung | AIS | developmental growth involved in morphogenesis | 51/1849 | 234/18723 | 4.43e-08 | 5.24e-06 | 51 |
| GO:001604912 | Lung | AIS | cell growth | 83/1849 | 482/18723 | 3.26e-07 | 2.79e-05 | 83 |
| GO:199013812 | Lung | AIS | neuron projection extension | 38/1849 | 172/18723 | 1.57e-06 | 9.85e-05 | 38 |
| GO:004858812 | Lung | AIS | developmental cell growth | 47/1849 | 234/18723 | 1.77e-06 | 1.05e-04 | 47 |
| GO:003367412 | Lung | AIS | positive regulation of kinase activity | 77/1849 | 467/18723 | 4.67e-06 | 2.31e-04 | 77 |
| GO:190188811 | Lung | AIS | regulation of cell junction assembly | 41/1849 | 204/18723 | 7.76e-06 | 3.35e-04 | 41 |
| GO:004867512 | Lung | AIS | axon extension | 28/1849 | 120/18723 | 1.22e-05 | 4.71e-04 | 28 |
| GO:004586012 | Lung | AIS | positive regulation of protein kinase activity | 65/1849 | 386/18723 | 1.27e-05 | 4.78e-04 | 65 |
| GO:005109813 | Lung | AIS | regulation of binding | 61/1849 | 363/18723 | 2.48e-05 | 8.06e-04 | 61 |
| GO:000974313 | Lung | AIS | response to carbohydrate | 45/1849 | 253/18723 | 7.09e-05 | 1.88e-03 | 45 |
| GO:004863811 | Lung | AIS | regulation of developmental growth | 55/1849 | 330/18723 | 7.63e-05 | 1.95e-03 | 55 |
| Hugo Symbol | Variant Class | Variant Classification | dbSNP RS | HGVSc | HGVSp | HGVSp Short | SWISSPROT | BIOTYPE | SIFT | PolyPhen | Tumor Sample Barcode | Tissue | Histology | Sex | Age | Stage | Therapy Types | Drugs | Outcome |
| ADNP | SNV | Missense_Mutation | novel | c.1603N>T | p.His535Tyr | p.H535Y | Q9H2P0 | protein_coding | deleterious(0) | probably_damaging(0.932) | TCGA-3C-AALI-01 | Breast | breast invasive carcinoma | Female | <65 | I/II | Unspecific | Poly E | Complete Response |
| ADNP | SNV | Missense_Mutation | | c.2618N>G | p.Asp873Gly | p.D873G | Q9H2P0 | protein_coding | tolerated_low_confidence(0.22) | benign(0.175) | TCGA-A8-A09Z-01 | Breast | breast invasive carcinoma | Female | >=65 | I/II | Unknown | Unknown | SD |
| ADNP | SNV | Missense_Mutation | | c.2200G>A | p.Asp734Asn | p.D734N | Q9H2P0 | protein_coding | tolerated(0.36) | benign(0) | TCGA-AC-A23H-01 | Breast | breast invasive carcinoma | Female | >=65 | I/II | Unknown | Unknown | PD |
| ADNP | SNV | Missense_Mutation | novel | c.1363N>A | p.Leu455Ile | p.L455I | Q9H2P0 | protein_coding | deleterious(0) | probably_damaging(0.993) | TCGA-AN-A046-01 | Breast | breast invasive carcinoma | Female | >=65 | I/II | Unknown | Unknown | SD |
| ADNP | SNV | Missense_Mutation | novel | c.976N>A | p.His326Asn | p.H326N | Q9H2P0 | protein_coding | tolerated(0.17) | probably_damaging(0.956) | TCGA-AN-A046-01 | Breast | breast invasive carcinoma | Female | >=65 | I/II | Unknown | Unknown | SD |
| ADNP | SNV | Missense_Mutation | novel | c.2521N>C | p.Asp841His | p.D841H | Q9H2P0 | protein_coding | deleterious(0.01) | possibly_damaging(0.536) | TCGA-AN-A0AJ-01 | Breast | breast invasive carcinoma | Female | >=65 | I/II | Unknown | Unknown | SD |
| ADNP | SNV | Missense_Mutation | novel | c.1364T>C | p.Leu455Pro | p.L455P | Q9H2P0 | protein_coding | deleterious(0) | probably_damaging(0.998) | TCGA-AR-A0U0-01 | Breast | breast invasive carcinoma | Female | >=65 | I/II | Unknown | Unknown | SD |
| ADNP | SNV | Missense_Mutation | | c.1041N>A | p.Met347Ile | p.M347I | Q9H2P0 | protein_coding | tolerated(0.49) | benign(0) | TCGA-B6-A0IK-01 | Breast | breast invasive carcinoma | Female | <65 | III/IV | Unknown | Unknown | PD |
| ADNP | SNV | Missense_Mutation | | c.3244N>A | p.Asp1082Asn | p.D1082N | Q9H2P0 | protein_coding | deleterious_low_confidence(0.01) | benign(0.173) | TCGA-BH-A0HP-01 | Breast | breast invasive carcinoma | Female | >=65 | III/IV | Chemotherapy | doxorubicin | SD |
| ADNP | SNV | Missense_Mutation | | c.3087N>C | p.Lys1029Asn | p.K1029N | Q9H2P0 | protein_coding | tolerated_low_confidence(0.43) | probably_damaging(0.981) | TCGA-BH-A0HP-01 | Breast | breast invasive carcinoma | Female | >=65 | III/IV | Chemotherapy | doxorubicin | SD |


