
|
|||||
|
 | |
| |
| |
| |
| |
| |
|
Gene: TH |
Gene summary for TH |
| Gene information | Species | Human | Gene symbol | TH | Gene ID | 7054 |
| Gene name | tyrosine hydroxylase | |
| Gene Alias | DYT14 | |
| Cytomap | 11p15.5 | |
| Gene Type | protein-coding | GO ID | GO:0000003 | UniProtAcc | P07101 |
Top |
Malignant transformation analysis |
| Identification of the aberrant gene expression in precancerous and cancerous lesions by comparing the gene expression of stem-like cells in diseased tissues with normal stem cells |
| Entrez ID | Symbol | Replicates | Species | Organ | Tissue | Adj P-value | Log2FC | Malignancy |
| 7054 | TH | C04 | Human | Oral cavity | OSCC | 2.26e-15 | 7.94e-01 | 0.2633 |
| 7054 | TH | C21 | Human | Oral cavity | OSCC | 3.65e-07 | 1.94e-01 | 0.2678 |
| 7054 | TH | C30 | Human | Oral cavity | OSCC | 2.87e-17 | 6.63e-01 | 0.3055 |
| 7054 | TH | C51 | Human | Oral cavity | OSCC | 4.98e-04 | 2.56e-01 | 0.2674 |
| 7054 | TH | SYSMH5 | Human | Oral cavity | OSCC | 3.73e-03 | 1.34e-01 | 0.0647 |
| 7054 | TH | P4_cSCC | Human | Skin | cSCC | 3.76e-02 | 9.18e-02 | -0.00290000000000005 |
| Page: 1 |
| Tissue | Expression Dynamics | Abbreviation |
| Oral Cavity | 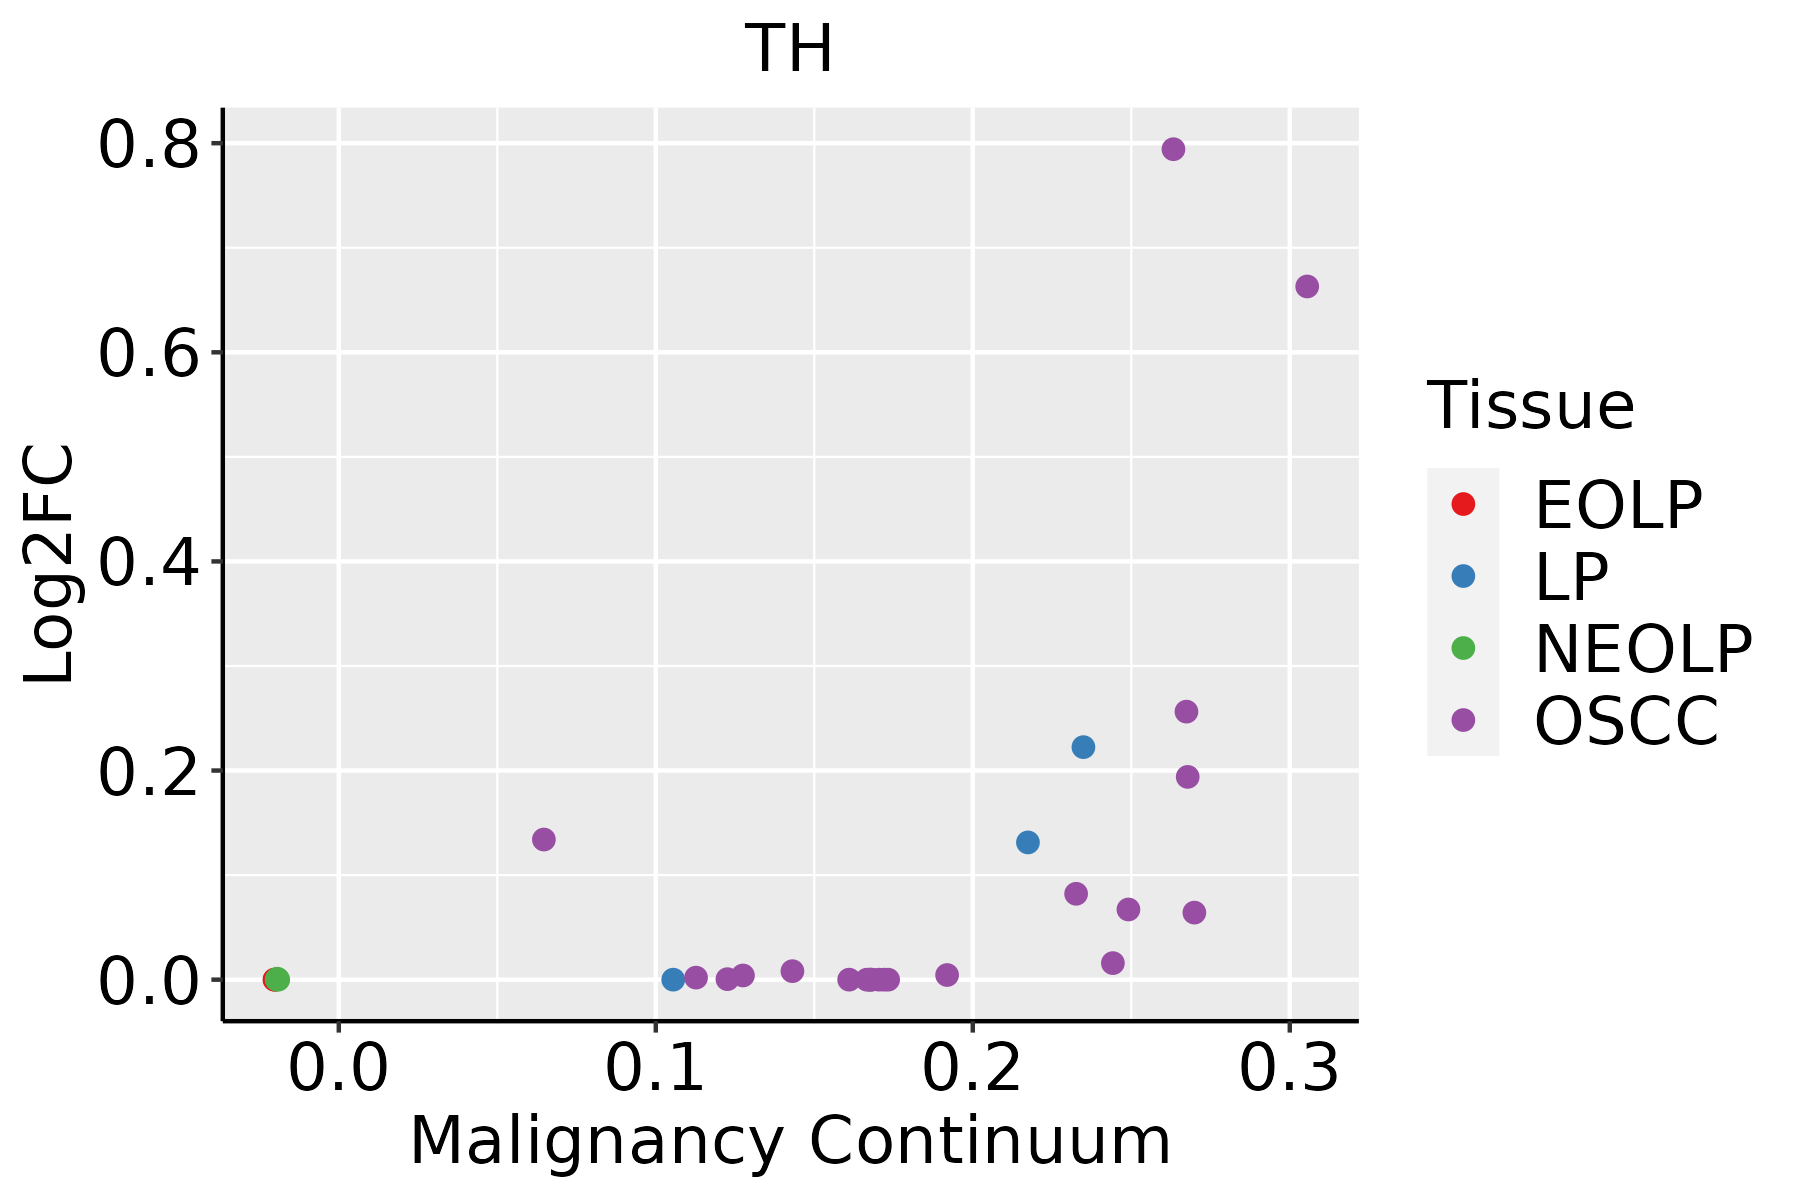 | EOLP: Erosive Oral lichen planus |
| LP: leukoplakia | ||
| NEOLP: Non-erosive oral lichen planus | ||
| OSCC: Oral squamous cell carcinoma | ||
| Skin |  | AK: Actinic keratosis |
| cSCC: Cutaneous squamous cell carcinoma | ||
| SCCIS:squamous cell carcinoma in situ |
| ∗log2FC in expression of this searched gene in stem-like cells from each diseased tissue sample relative to stem-like cells in normal samples in each tissue plotted against the malignancy continuum. Samples are colored based on if they are from different disease stage. |
Top |
Malignant transformation related pathway analysis |
| Find out the enriched GO biological processes and KEGG pathways involved in transition from healthy to precancer to cancer |
| Tissue | Disease Stage | Enriched GO biological Processes |
| Colorectum | AD |  |
| Colorectum | SER |  |
| Colorectum | MSS |  |
| Colorectum | MSI-H |  |
| Colorectum | FAP |  |
| ∗Top 15 enriched GO BP terms are showed in the bar plot of each disease state in each tissue. Each row represents a significant GO biological process which is colored according to the -log10(p.adjust). |
| Page: 1 2 3 4 5 6 7 8 9 |
| GO ID | Tissue | Disease Stage | Description | Gene Ratio | Bg Ratio | pvalue | p.adjust | Count |
| GO:005116931 | Oral cavity | NEOLP | nuclear transport | 75/2005 | 301/18723 | 1.56e-12 | 3.20e-10 | 75 |
| GO:000640232 | Oral cavity | NEOLP | mRNA catabolic process | 62/2005 | 232/18723 | 5.51e-12 | 9.91e-10 | 62 |
| GO:001081033 | Oral cavity | NEOLP | regulation of cell-substrate adhesion | 60/2005 | 221/18723 | 5.88e-12 | 1.03e-09 | 60 |
| GO:000716023 | Oral cavity | NEOLP | cell-matrix adhesion | 62/2005 | 233/18723 | 6.73e-12 | 1.14e-09 | 62 |
| GO:015011624 | Oral cavity | NEOLP | regulation of cell-substrate junction organization | 30/2005 | 71/18723 | 7.44e-12 | 1.17e-09 | 30 |
| GO:005254733 | Oral cavity | NEOLP | regulation of peptidase activity | 98/2005 | 461/18723 | 1.77e-11 | 2.56e-09 | 98 |
| GO:007182634 | Oral cavity | NEOLP | ribonucleoprotein complex subunit organization | 60/2005 | 227/18723 | 1.98e-11 | 2.81e-09 | 60 |
| GO:200123433 | Oral cavity | NEOLP | negative regulation of apoptotic signaling pathway | 59/2005 | 224/18723 | 3.40e-11 | 4.59e-09 | 59 |
| GO:000195223 | Oral cavity | NEOLP | regulation of cell-matrix adhesion | 41/2005 | 128/18723 | 5.14e-11 | 6.30e-09 | 41 |
| GO:000641333 | Oral cavity | NEOLP | translational initiation | 39/2005 | 118/18723 | 5.20e-11 | 6.30e-09 | 39 |
| GO:000038031 | Oral cavity | NEOLP | alternative mRNA splicing, via spliceosome | 30/2005 | 77/18723 | 8.63e-11 | 9.32e-09 | 30 |
| GO:000641734 | Oral cavity | NEOLP | regulation of translation | 97/2005 | 468/18723 | 9.94e-11 | 1.05e-08 | 97 |
| GO:002261834 | Oral cavity | NEOLP | ribonucleoprotein complex assembly | 57/2005 | 220/18723 | 1.46e-10 | 1.43e-08 | 57 |
| GO:200123632 | Oral cavity | NEOLP | regulation of extrinsic apoptotic signaling pathway | 44/2005 | 151/18723 | 3.30e-10 | 2.97e-08 | 44 |
| GO:003432923 | Oral cavity | NEOLP | cell junction assembly | 88/2005 | 420/18723 | 4.18e-10 | 3.44e-08 | 88 |
| GO:000166725 | Oral cavity | NEOLP | ameboidal-type cell migration | 96/2005 | 475/18723 | 5.16e-10 | 4.14e-08 | 96 |
| GO:003312032 | Oral cavity | NEOLP | positive regulation of RNA splicing | 19/2005 | 37/18723 | 8.91e-10 | 6.61e-08 | 19 |
| GO:009719133 | Oral cavity | NEOLP | extrinsic apoptotic signaling pathway | 55/2005 | 219/18723 | 1.07e-09 | 7.82e-08 | 55 |
| GO:001063123 | Oral cavity | NEOLP | epithelial cell migration | 77/2005 | 357/18723 | 1.32e-09 | 9.43e-08 | 77 |
| GO:002261333 | Oral cavity | NEOLP | ribonucleoprotein complex biogenesis | 93/2005 | 463/18723 | 1.34e-09 | 9.49e-08 | 93 |
| Pathway ID | Tissue | Disease Stage | Description | Gene Ratio | Bg Ratio | pvalue | p.adjust | qvalue | Count |
| hsa0501230 | Oral cavity | OSCC | Parkinson disease | 188/3704 | 266/8465 | 1.82e-19 | 1.52e-17 | 7.75e-18 | 188 |
| hsa05012113 | Oral cavity | OSCC | Parkinson disease | 188/3704 | 266/8465 | 1.82e-19 | 1.52e-17 | 7.75e-18 | 188 |
| Page: 1 |
Top |
Cell-cell communication analysis |
| Identification of potential cell-cell interactions between two cell types and their ligand-receptor pairs for different disease states |
| Ligand | Receptor | LRpair | Pathway | Tissue | Disease Stage |
| Page: 1 |
Top |
Single-cell gene regulatory network inference analysis |
| Find out the significant the regulons (TFs) and the target genes of each regulon across cell types for different disease states |
| TF | Cell Type | Tissue | Disease Stage | Target Gene | RSS | Regulon Activity |
| ∗The dot plots of a searched regulon are shown for all cell subpopulations in each disease state of each tissue based on the regulon specific score inferred using pySCENIC and by calculating the average expression. |
| Page: 1 |
Top |
Somatic mutation of malignant transformation related genes |
| Annotation of somatic variants for genes involved in malignant transformation |
| Hugo Symbol | Variant Class | Variant Classification | dbSNP RS | HGVSc | HGVSp | HGVSp Short | SWISSPROT | BIOTYPE | SIFT | PolyPhen | Tumor Sample Barcode | Tissue | Histology | Sex | Age | Stage | Therapy Types | Drugs | Outcome |
| TH | SNV | Missense_Mutation | c.58N>C | p.Glu20Gln | p.E20Q | P07101 | protein_coding | deleterious_low_confidence(0.01) | probably_damaging(0.998) | TCGA-E2-A1LS-01 | Breast | breast invasive carcinoma | Female | <65 | I/II | Unspecific | Cyclophosphamide | SD | |
| TH | SNV | Missense_Mutation | novel | c.307N>A | p.Ala103Thr | p.A103T | P07101 | protein_coding | tolerated(0.31) | benign(0.055) | TCGA-2W-A8YY-01 | Cervix | cervical & endocervical cancer | Female | <65 | I/II | Chemotherapy | cisplatin | CR |
| TH | SNV | Missense_Mutation | rs760640869 | c.374N>T | p.Ser125Leu | p.S125L | P07101 | protein_coding | deleterious(0.01) | benign(0.058) | TCGA-EA-A3QD-01 | Cervix | cervical & endocervical cancer | Female | <65 | III/IV | Chemotherapy | cisplatin | CR |
| TH | SNV | Missense_Mutation | c.235N>A | p.Glu79Lys | p.E79K | P07101 | protein_coding | deleterious(0.04) | probably_damaging(0.957) | TCGA-MY-A5BD-01 | Cervix | cervical & endocervical cancer | Female | <65 | I/II | Chemotherapy | cisplatin | CR | |
| TH | SNV | Missense_Mutation | rs372409517 | c.677N>T | p.Ser226Leu | p.S226L | P07101 | protein_coding | deleterious(0.01) | possibly_damaging(0.661) | TCGA-A6-6780-01 | Colorectum | colon adenocarcinoma | Male | >=65 | I/II | Unknown | Unknown | SD |
| TH | SNV | Missense_Mutation | novel | c.1201N>C | p.Tyr401His | p.Y401H | P07101 | protein_coding | deleterious(0) | probably_damaging(1) | TCGA-AA-3663-01 | Colorectum | colon adenocarcinoma | Male | <65 | I/II | Unknown | Unknown | SD |
| TH | SNV | Missense_Mutation | novel | c.944N>A | p.Gly315Asp | p.G315D | P07101 | protein_coding | deleterious(0) | probably_damaging(1) | TCGA-AA-A010-01 | Colorectum | colon adenocarcinoma | Female | <65 | I/II | Chemotherapy | folinic | CR |
| TH | SNV | Missense_Mutation | rs757607038 | c.806C>T | p.Thr269Met | p.T269M | P07101 | protein_coding | deleterious(0.04) | possibly_damaging(0.904) | TCGA-AA-A022-01 | Colorectum | colon adenocarcinoma | Female | >=65 | I/II | Unknown | Unknown | SD |
| TH | SNV | Missense_Mutation | c.721N>A | p.Ala241Thr | p.A241T | P07101 | protein_coding | deleterious(0) | probably_damaging(0.992) | TCGA-F4-6703-01 | Colorectum | colon adenocarcinoma | Male | <65 | I/II | Unknown | Unknown | SD | |
| TH | SNV | Missense_Mutation | rs200751977 | c.1492G>A | p.Asp498Asn | p.D498N | P07101 | protein_coding | deleterious(0.02) | benign(0.077) | TCGA-EI-6917-01 | Colorectum | rectum adenocarcinoma | Male | <65 | III/IV | Chemotherapy | 5fluorouracil+oxaciplatina+l-folinian | SD |
| Page: 1 2 3 4 5 |
Top |
Related drugs of malignant transformation related genes |
| Identification of chemicals and drugs interact with genes involved in malignant transfromation |
| (DGIdb 4.0) |
| Entrez ID | Symbol | Category | Interaction Types | Drug Claim Name | Drug Name | PMIDs |
| 7054 | TH | ENZYME, DRUGGABLE GENOME | L-Phenylalanine | PHENYLALANINE | ||
| 7054 | TH | ENZYME, DRUGGABLE GENOME | methylphenidate | METHYLPHENIDATE | 26810137 | |
| 7054 | TH | ENZYME, DRUGGABLE GENOME | metyrosine | METYROSINE | ||
| 7054 | TH | ENZYME, DRUGGABLE GENOME | EPO | EPOETIN ALFA | 16368081 | |
| 7054 | TH | ENZYME, DRUGGABLE GENOME | TETRAHYDROBIOPTERIN | SAPROPTERIN | ||
| 7054 | TH | ENZYME, DRUGGABLE GENOME | SERTRALINE HYDROCHLORIDE | 8629887 | ||
| 7054 | TH | ENZYME, DRUGGABLE GENOME | DEHYDROEPIANDROSTERONE | PRASTERONE | 8704732 | |
| 7054 | TH | ENZYME, DRUGGABLE GENOME | inhibitor | CHEMBL1200862 | METYROSINE | |
| 7054 | TH | ENZYME, DRUGGABLE GENOME | IFN | 8724983 | ||
| 7054 | TH | ENZYME, DRUGGABLE GENOME | DOXYCYCLINE | DOXYCYCLINE | 15585109 |
| Page: 1 2 3 4 |

Copyright 2023-Present -The University of Texas Health Science Center at Houston |