
|
|||||
|
 | |
| |
| |
| |
| |
| |
|
Gene: USP4 |
Gene summary for USP4 |
| Gene information | Species | Human | Gene symbol | USP4 | Gene ID | 7375 |
| Gene name | ubiquitin specific peptidase 4 | |
| Gene Alias | UNP | |
| Cytomap | 3p21.31 | |
| Gene Type | protein-coding | GO ID | GO:0000244 | UniProtAcc | Q13107 |
Top |
Malignant transformation analysis |
| Identification of the aberrant gene expression in precancerous and cancerous lesions by comparing the gene expression of stem-like cells in diseased tissues with normal stem cells |
| Entrez ID | Symbol | Replicates | Species | Organ | Tissue | Adj P-value | Log2FC | Malignancy |
| 7375 | USP4 | LZE4T | Human | Esophagus | ESCC | 4.63e-13 | 3.22e-01 | 0.0811 |
| 7375 | USP4 | LZE7T | Human | Esophagus | ESCC | 2.43e-04 | 2.85e-01 | 0.0667 |
| 7375 | USP4 | LZE8T | Human | Esophagus | ESCC | 1.96e-03 | 9.50e-02 | 0.067 |
| 7375 | USP4 | LZE22T | Human | Esophagus | ESCC | 2.12e-05 | 3.91e-01 | 0.068 |
| 7375 | USP4 | LZE24T | Human | Esophagus | ESCC | 2.95e-14 | 2.93e-01 | 0.0596 |
| 7375 | USP4 | P1T-E | Human | Esophagus | ESCC | 6.26e-04 | 2.28e-01 | 0.0875 |
| 7375 | USP4 | P2T-E | Human | Esophagus | ESCC | 1.34e-18 | 3.51e-01 | 0.1177 |
| 7375 | USP4 | P4T-E | Human | Esophagus | ESCC | 1.89e-21 | 4.95e-01 | 0.1323 |
| 7375 | USP4 | P5T-E | Human | Esophagus | ESCC | 6.58e-12 | 2.21e-01 | 0.1327 |
| 7375 | USP4 | P8T-E | Human | Esophagus | ESCC | 9.77e-09 | 1.99e-01 | 0.0889 |
| 7375 | USP4 | P9T-E | Human | Esophagus | ESCC | 1.11e-12 | 3.07e-01 | 0.1131 |
| 7375 | USP4 | P10T-E | Human | Esophagus | ESCC | 9.81e-23 | 4.08e-01 | 0.116 |
| 7375 | USP4 | P11T-E | Human | Esophagus | ESCC | 7.00e-16 | 5.24e-01 | 0.1426 |
| 7375 | USP4 | P12T-E | Human | Esophagus | ESCC | 4.56e-21 | 4.02e-01 | 0.1122 |
| 7375 | USP4 | P15T-E | Human | Esophagus | ESCC | 1.17e-16 | 3.22e-01 | 0.1149 |
| 7375 | USP4 | P16T-E | Human | Esophagus | ESCC | 1.63e-18 | 4.47e-01 | 0.1153 |
| 7375 | USP4 | P17T-E | Human | Esophagus | ESCC | 1.31e-02 | 2.80e-01 | 0.1278 |
| 7375 | USP4 | P19T-E | Human | Esophagus | ESCC | 2.52e-06 | 6.24e-01 | 0.1662 |
| 7375 | USP4 | P20T-E | Human | Esophagus | ESCC | 8.87e-20 | 4.24e-01 | 0.1124 |
| 7375 | USP4 | P21T-E | Human | Esophagus | ESCC | 1.20e-18 | 3.57e-01 | 0.1617 |
| Page: 1 2 3 4 |
| Tissue | Expression Dynamics | Abbreviation |
| Esophagus |  | ESCC: Esophageal squamous cell carcinoma |
| HGIN: High-grade intraepithelial neoplasias | ||
| LGIN: Low-grade intraepithelial neoplasias | ||
| Liver | 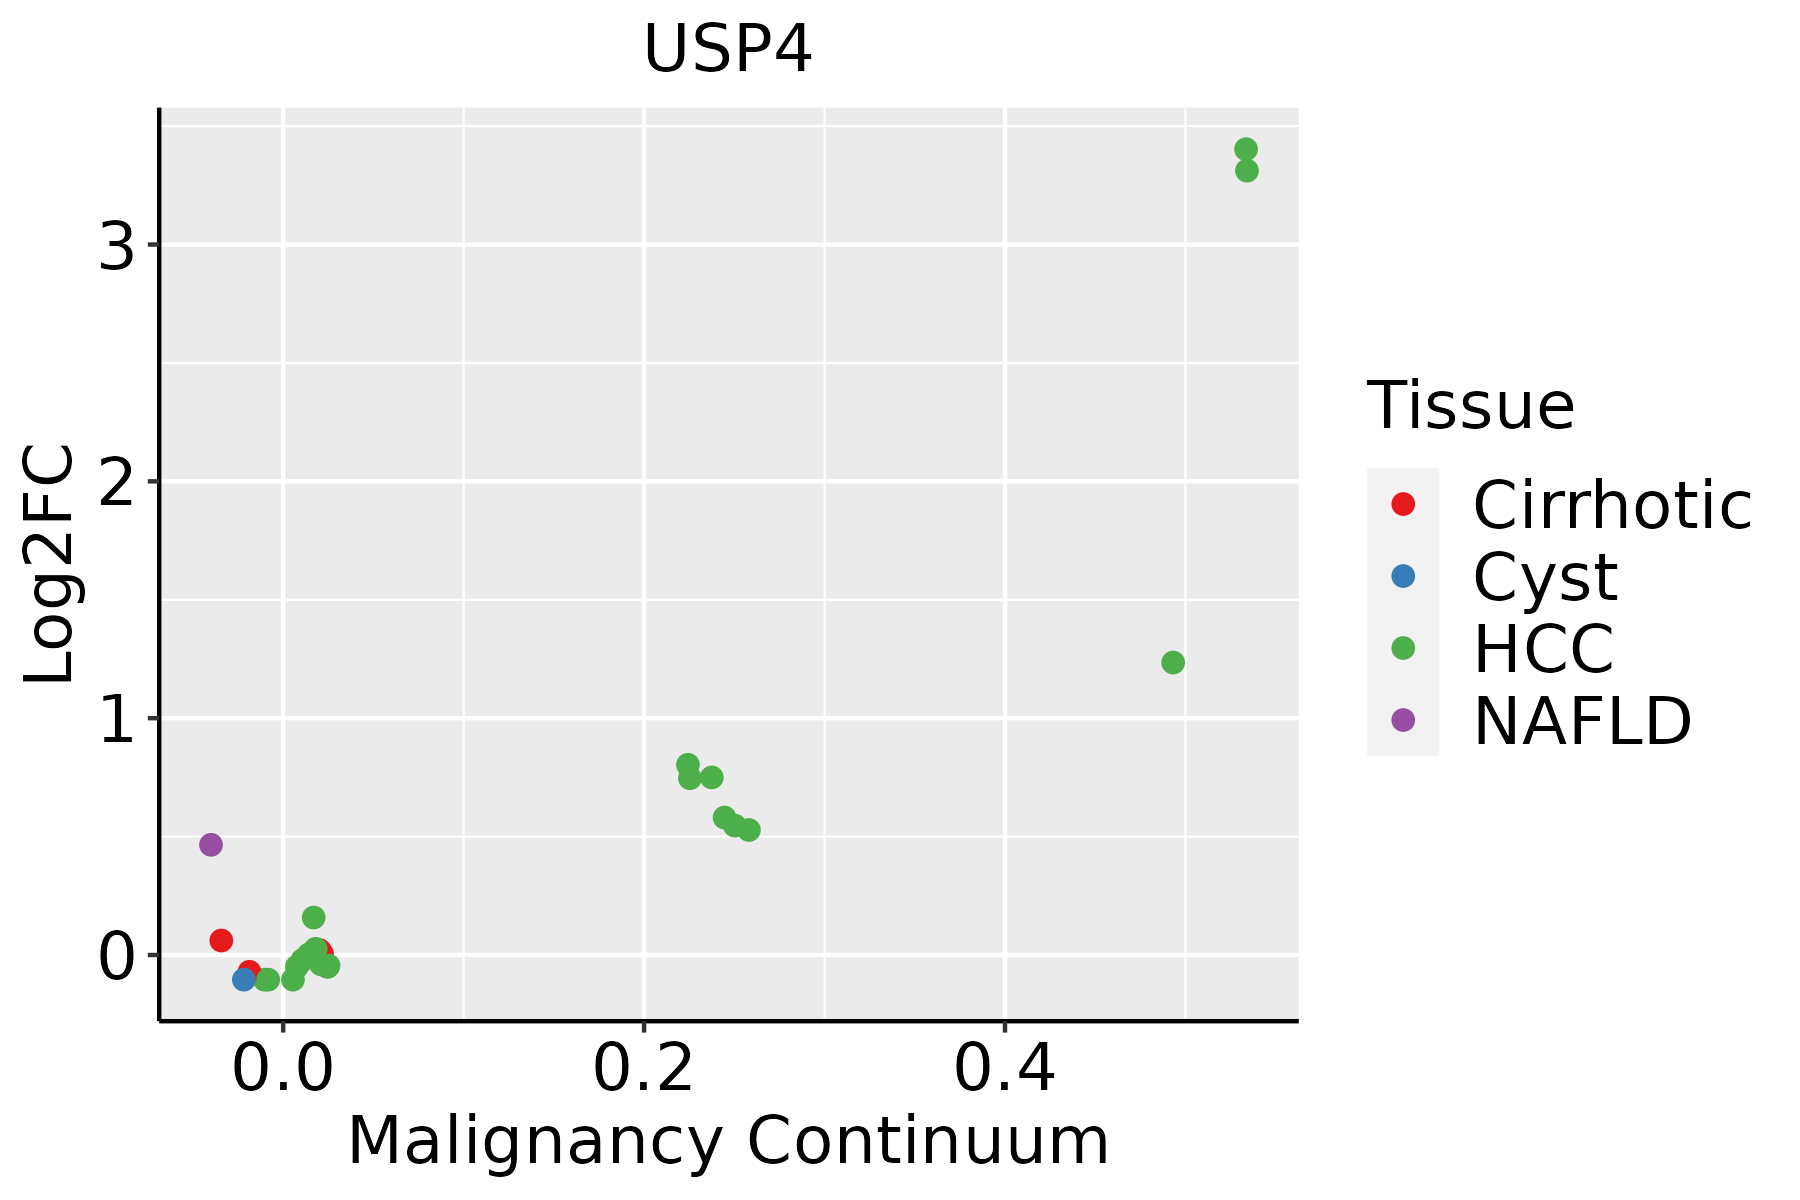 | HCC: Hepatocellular carcinoma |
| NAFLD: Non-alcoholic fatty liver disease |
| ∗log2FC in expression of this searched gene in stem-like cells from each diseased tissue sample relative to stem-like cells in normal samples in each tissue plotted against the malignancy continuum. Samples are colored based on if they are from different disease stage. |
Top |
Malignant transformation related pathway analysis |
| Find out the enriched GO biological processes and KEGG pathways involved in transition from healthy to precancer to cancer |
| Tissue | Disease Stage | Enriched GO biological Processes |
| Colorectum | AD |  |
| Colorectum | SER |  |
| Colorectum | MSS |  |
| Colorectum | MSI-H |  |
| Colorectum | FAP |  |
| ∗Top 15 enriched GO BP terms are showed in the bar plot of each disease state in each tissue. Each row represents a significant GO biological process which is colored according to the -log10(p.adjust). |
| Page: 1 2 3 4 5 6 7 8 9 |
| GO ID | Tissue | Disease Stage | Description | Gene Ratio | Bg Ratio | pvalue | p.adjust | Count |
| GO:00902634 | Liver | NAFLD | positive regulation of canonical Wnt signaling pathway | 21/1882 | 106/18723 | 1.81e-03 | 1.86e-02 | 21 |
| GO:20010206 | Liver | NAFLD | regulation of response to DNA damage stimulus | 36/1882 | 219/18723 | 2.14e-03 | 2.08e-02 | 36 |
| GO:00971937 | Liver | NAFLD | intrinsic apoptotic signaling pathway | 44/1882 | 288/18723 | 3.24e-03 | 2.88e-02 | 44 |
| GO:00459275 | Liver | NAFLD | positive regulation of growth | 40/1882 | 259/18723 | 4.00e-03 | 3.35e-02 | 40 |
| GO:1901987 | Liver | NAFLD | regulation of cell cycle phase transition | 56/1882 | 390/18723 | 4.01e-03 | 3.36e-02 | 56 |
| GO:00303075 | Liver | NAFLD | positive regulation of cell growth | 28/1882 | 166/18723 | 4.35e-03 | 3.57e-02 | 28 |
| GO:19033217 | Liver | NAFLD | negative regulation of protein modification by small protein conjugation or removal | 18/1882 | 95/18723 | 6.05e-03 | 4.54e-02 | 18 |
| GO:003164712 | Liver | Cirrhotic | regulation of protein stability | 144/4634 | 298/18723 | 6.74e-19 | 1.28e-16 | 144 |
| GO:200123312 | Liver | Cirrhotic | regulation of apoptotic signaling pathway | 163/4634 | 356/18723 | 2.62e-18 | 4.43e-16 | 163 |
| GO:009719312 | Liver | Cirrhotic | intrinsic apoptotic signaling pathway | 130/4634 | 288/18723 | 2.69e-14 | 2.45e-12 | 130 |
| GO:005254712 | Liver | Cirrhotic | regulation of peptidase activity | 185/4634 | 461/18723 | 1.32e-13 | 1.09e-11 | 185 |
| GO:005254812 | Liver | Cirrhotic | regulation of endopeptidase activity | 172/4634 | 432/18723 | 2.12e-12 | 1.58e-10 | 172 |
| GO:20012427 | Liver | Cirrhotic | regulation of intrinsic apoptotic signaling pathway | 82/4634 | 164/18723 | 2.35e-12 | 1.71e-10 | 82 |
| GO:20012347 | Liver | Cirrhotic | negative regulation of apoptotic signaling pathway | 102/4634 | 224/18723 | 8.40e-12 | 5.60e-10 | 102 |
| GO:00432817 | Liver | Cirrhotic | regulation of cysteine-type endopeptidase activity involved in apoptotic process | 91/4634 | 209/18723 | 1.91e-09 | 7.98e-08 | 91 |
| GO:004586112 | Liver | Cirrhotic | negative regulation of proteolysis | 136/4634 | 351/18723 | 3.46e-09 | 1.42e-07 | 136 |
| GO:20001167 | Liver | Cirrhotic | regulation of cysteine-type endopeptidase activity | 97/4634 | 235/18723 | 1.61e-08 | 5.99e-07 | 97 |
| GO:000941012 | Liver | Cirrhotic | response to xenobiotic stimulus | 165/4634 | 462/18723 | 6.82e-08 | 2.09e-06 | 165 |
| GO:005134612 | Liver | Cirrhotic | negative regulation of hydrolase activity | 139/4634 | 379/18723 | 1.24e-07 | 3.42e-06 | 139 |
| GO:00431546 | Liver | Cirrhotic | negative regulation of cysteine-type endopeptidase activity involved in apoptotic process | 40/4634 | 78/18723 | 4.00e-07 | 9.39e-06 | 40 |
| Page: 1 2 3 4 5 6 7 8 9 10 11 12 13 14 15 16 17 18 19 20 21 22 23 24 25 26 27 28 29 30 31 32 33 34 35 36 37 38 39 40 41 42 43 44 45 46 47 48 49 50 51 |
| Pathway ID | Tissue | Disease Stage | Description | Gene Ratio | Bg Ratio | pvalue | p.adjust | qvalue | Count |
| Page: 1 |
Top |
Cell-cell communication analysis |
| Identification of potential cell-cell interactions between two cell types and their ligand-receptor pairs for different disease states |
| Ligand | Receptor | LRpair | Pathway | Tissue | Disease Stage |
| Page: 1 |
Top |
Single-cell gene regulatory network inference analysis |
| Find out the significant the regulons (TFs) and the target genes of each regulon across cell types for different disease states |
| TF | Cell Type | Tissue | Disease Stage | Target Gene | RSS | Regulon Activity |
| ∗The dot plots of a searched regulon are shown for all cell subpopulations in each disease state of each tissue based on the regulon specific score inferred using pySCENIC and by calculating the average expression. |
| Page: 1 |
Top |
Somatic mutation of malignant transformation related genes |
| Annotation of somatic variants for genes involved in malignant transformation |
| Hugo Symbol | Variant Class | Variant Classification | dbSNP RS | HGVSc | HGVSp | HGVSp Short | SWISSPROT | BIOTYPE | SIFT | PolyPhen | Tumor Sample Barcode | Tissue | Histology | Sex | Age | Stage | Therapy Types | Drugs | Outcome |
| USP4 | SNV | Missense_Mutation | c.290N>A | p.Pro97His | p.P97H | Q13107 | protein_coding | deleterious(0) | probably_damaging(1) | TCGA-A2-A25A-01 | Breast | breast invasive carcinoma | Female | <65 | I/II | Unspecific | Cytoxan | SD | |
| USP4 | SNV | Missense_Mutation | novel | c.1675C>T | p.Arg559Trp | p.R559W | Q13107 | protein_coding | deleterious(0) | probably_damaging(0.978) | TCGA-AC-A2QI-01 | Breast | breast invasive carcinoma | Female | >=65 | III/IV | Chemotherapy | cytoxan | CR |
| USP4 | SNV | Missense_Mutation | c.944C>G | p.Ser315Cys | p.S315C | Q13107 | protein_coding | deleterious(0) | probably_damaging(1) | TCGA-AR-A0TX-01 | Breast | breast invasive carcinoma | Female | <65 | I/II | Unknown | Unknown | SD | |
| USP4 | SNV | Missense_Mutation | novel | c.884N>G | p.Ser295Cys | p.S295C | Q13107 | protein_coding | tolerated(0.17) | possibly_damaging(0.566) | TCGA-BH-A0B6-01 | Breast | breast invasive carcinoma | Female | <65 | I/II | Unknown | Unknown | SD |
| USP4 | SNV | Missense_Mutation | novel | c.542N>A | p.Thr181Lys | p.T181K | Q13107 | protein_coding | deleterious(0) | possibly_damaging(0.788) | TCGA-C8-A3M8-01 | Breast | breast invasive carcinoma | Female | >=65 | I/II | Hormone Therapy | tamoxiphen | CR |
| USP4 | SNV | Missense_Mutation | c.241N>G | p.Gln81Glu | p.Q81E | Q13107 | protein_coding | tolerated(0.27) | possibly_damaging(0.633) | TCGA-D8-A1JA-01 | Breast | breast invasive carcinoma | Female | <65 | III/IV | Chemotherapy | adriamycin | PD | |
| USP4 | SNV | Missense_Mutation | novel | c.23N>A | p.Arg8His | p.R8H | Q13107 | protein_coding | tolerated_low_confidence(0.16) | benign(0) | TCGA-E9-A54X-01 | Breast | breast invasive carcinoma | Female | >=65 | I/II | Unknown | Unknown | SD |
| USP4 | insertion | Frame_Shift_Ins | novel | c.2080_2081insTTTGTATTTGGATGTGTCACTTCTT | p.Gln694LeufsTer34 | p.Q694Lfs*34 | Q13107 | protein_coding | TCGA-B6-A0RG-01 | Breast | breast invasive carcinoma | Female | <65 | I/II | Unknown | Unknown | SD | ||
| USP4 | deletion | Frame_Shift_Del | novel | c.1830delN | p.Lys611SerfsTer4 | p.K611Sfs*4 | Q13107 | protein_coding | TCGA-EW-A2FV-01 | Breast | breast invasive carcinoma | Female | <65 | III/IV | Chemotherapy | docetaxel | SD | ||
| USP4 | SNV | Missense_Mutation | rs148734128 | c.2204G>A | p.Arg735Gln | p.R735Q | Q13107 | protein_coding | tolerated(0.8) | benign(0.063) | TCGA-2W-A8YY-01 | Cervix | cervical & endocervical cancer | Female | <65 | I/II | Chemotherapy | cisplatin | CR |
| Page: 1 2 3 4 5 6 7 8 9 |
Top |
Related drugs of malignant transformation related genes |
| Identification of chemicals and drugs interact with genes involved in malignant transfromation |
| (DGIdb 4.0) |
| Entrez ID | Symbol | Category | Interaction Types | Drug Claim Name | Drug Name | PMIDs |
| Page: 1 |

Copyright 2023-Present -The University of Texas Health Science Center at Houston |