| Tissue | Expression Dynamics | Abbreviation |
| Cervix | 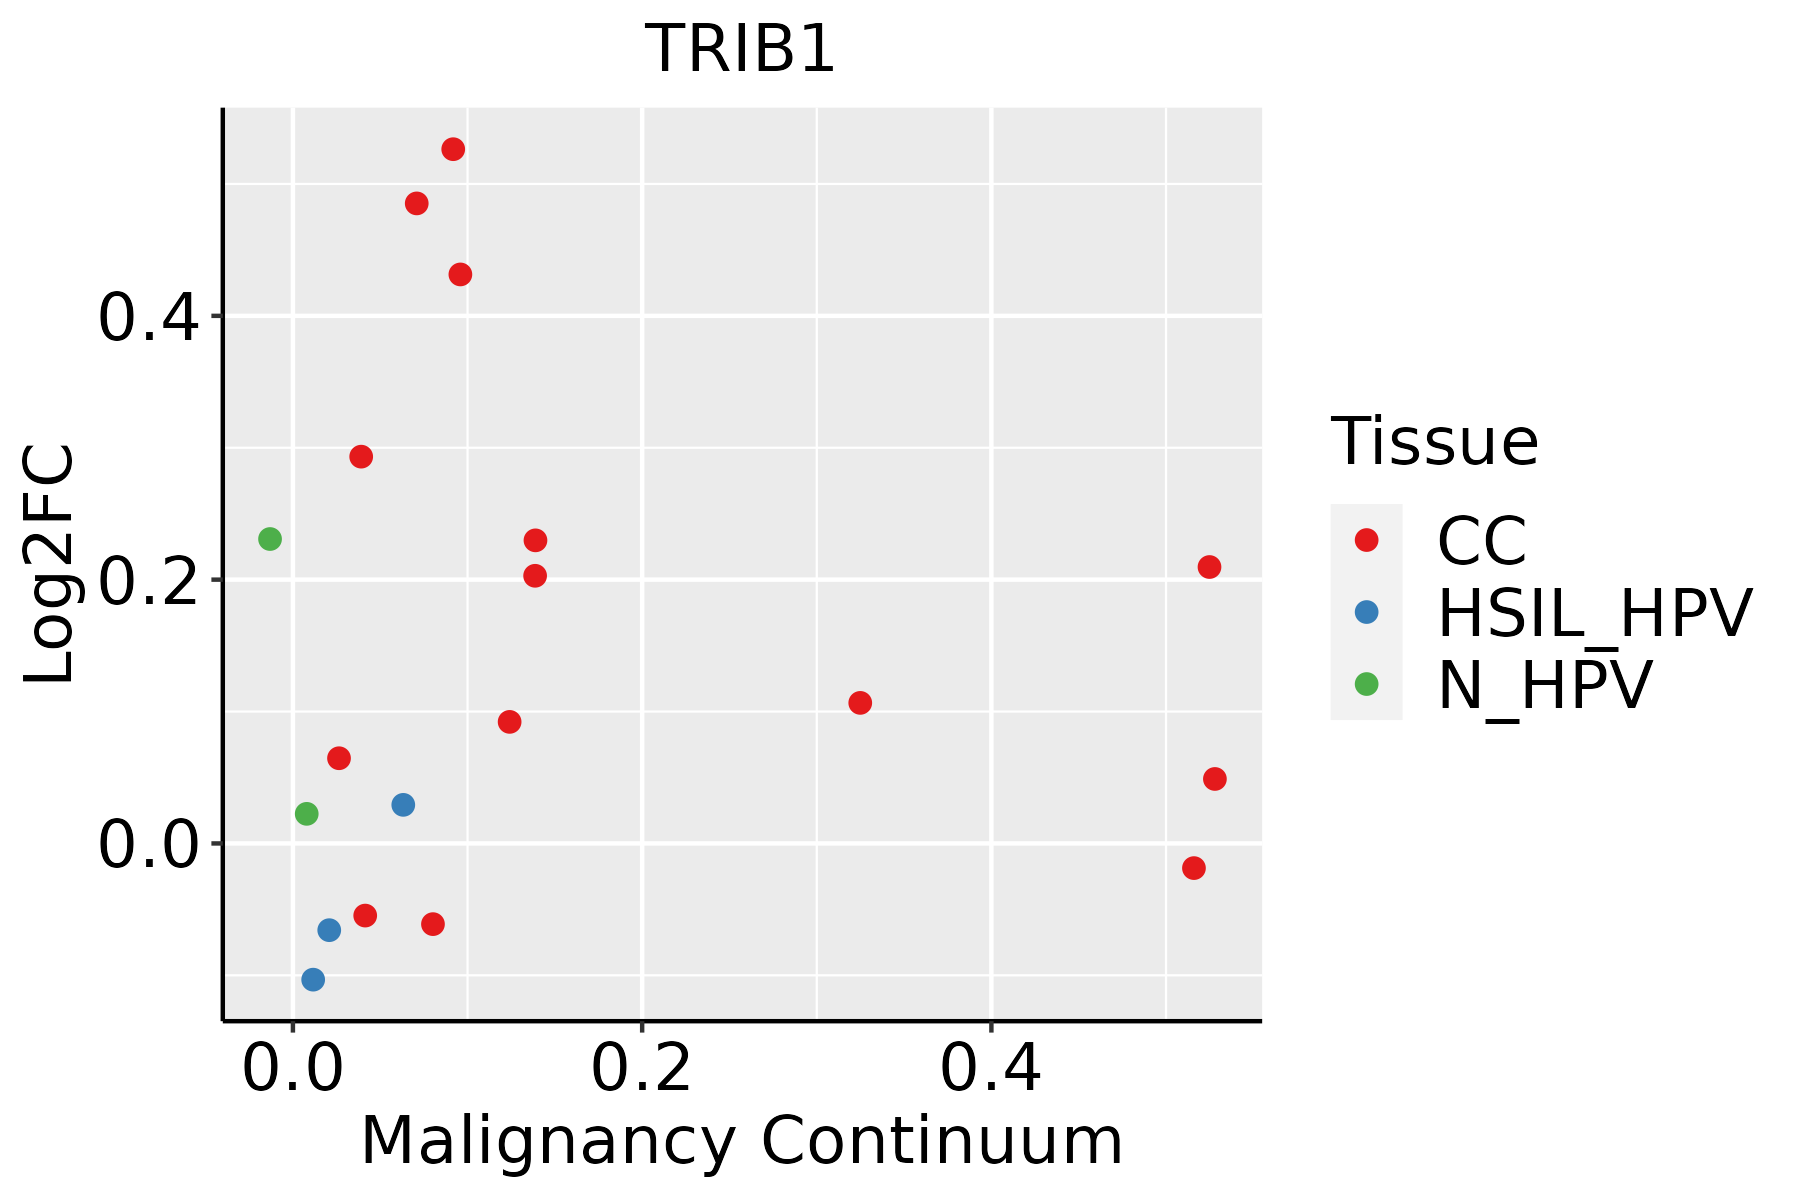 | CC: Cervix cancer |
| HSIL_HPV: HPV-infected high-grade squamous intraepithelial lesions |
| N_HPV: HPV-infected normal cervix |
| Esophagus | 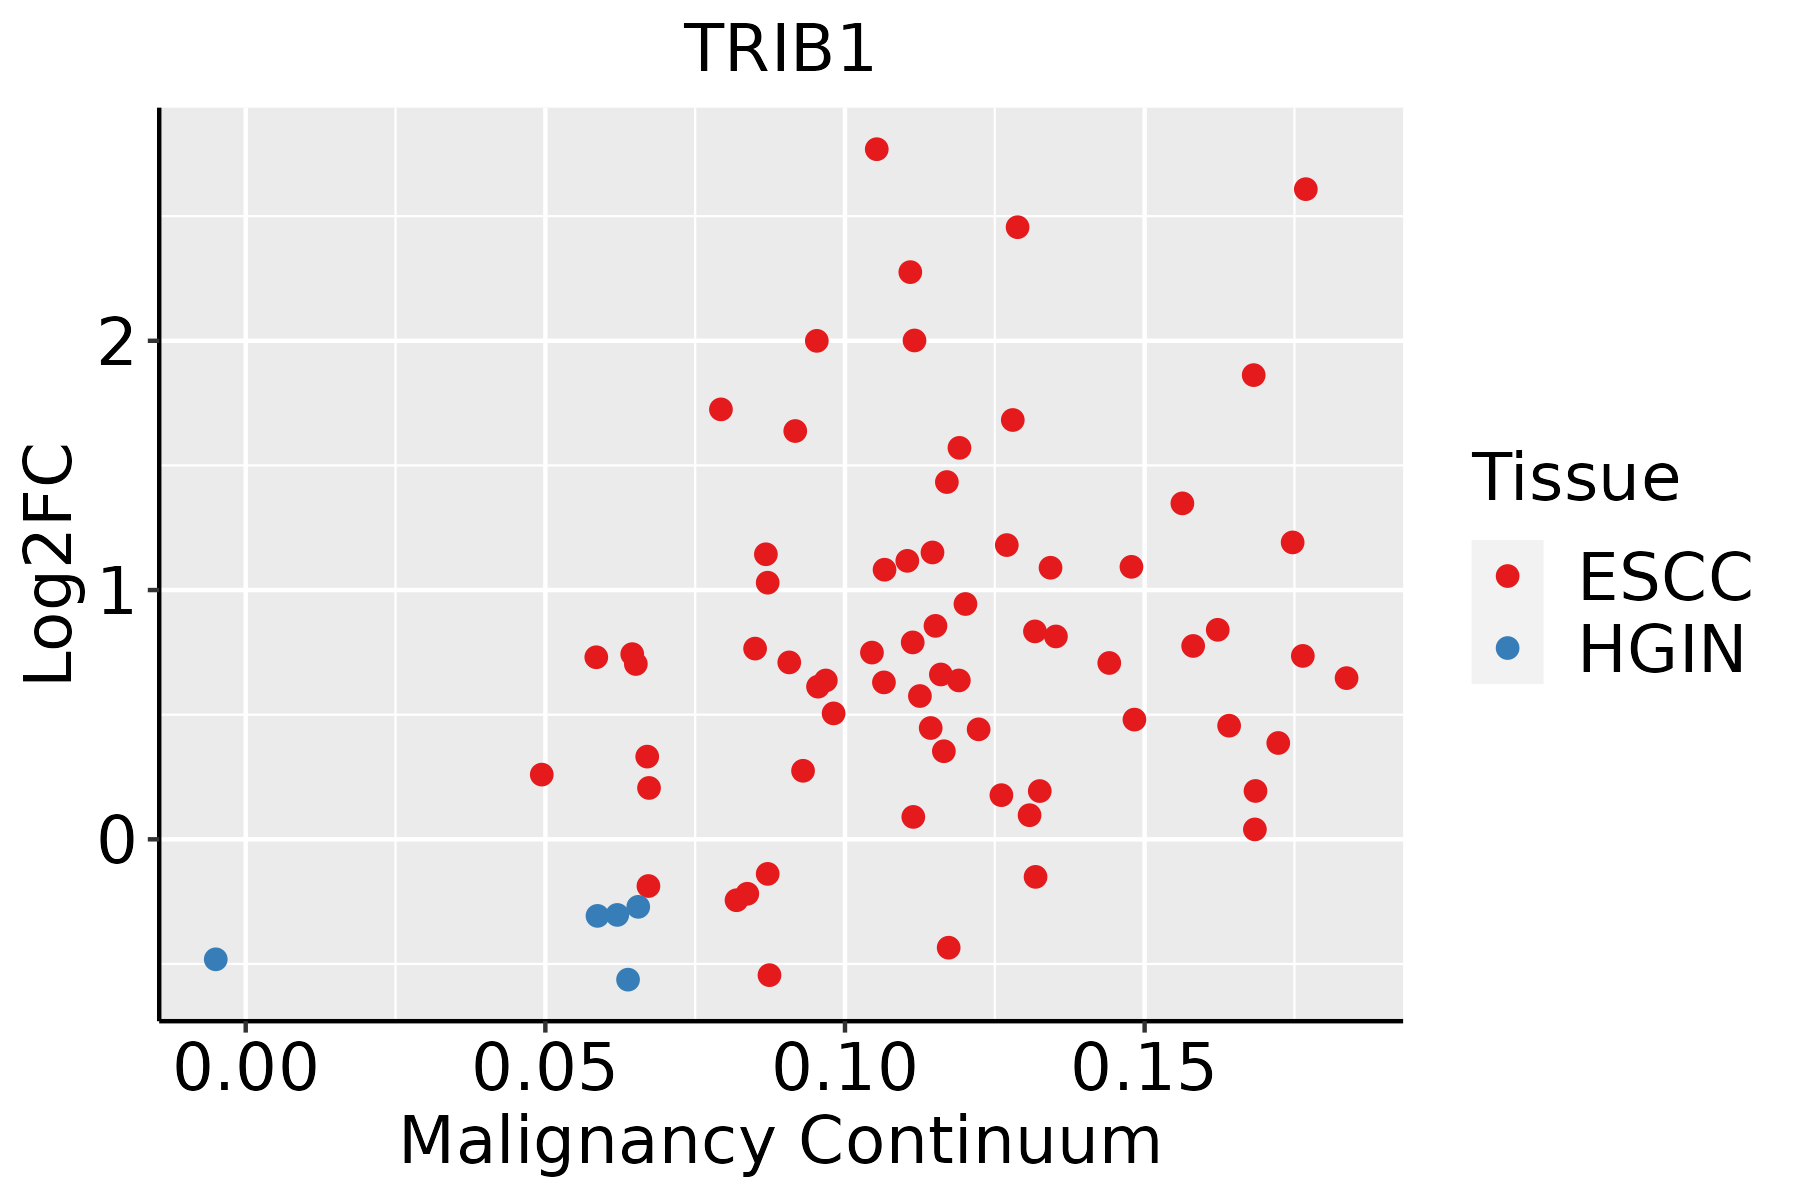 | ESCC: Esophageal squamous cell carcinoma |
| HGIN: High-grade intraepithelial neoplasias |
| LGIN: Low-grade intraepithelial neoplasias |
| Liver | 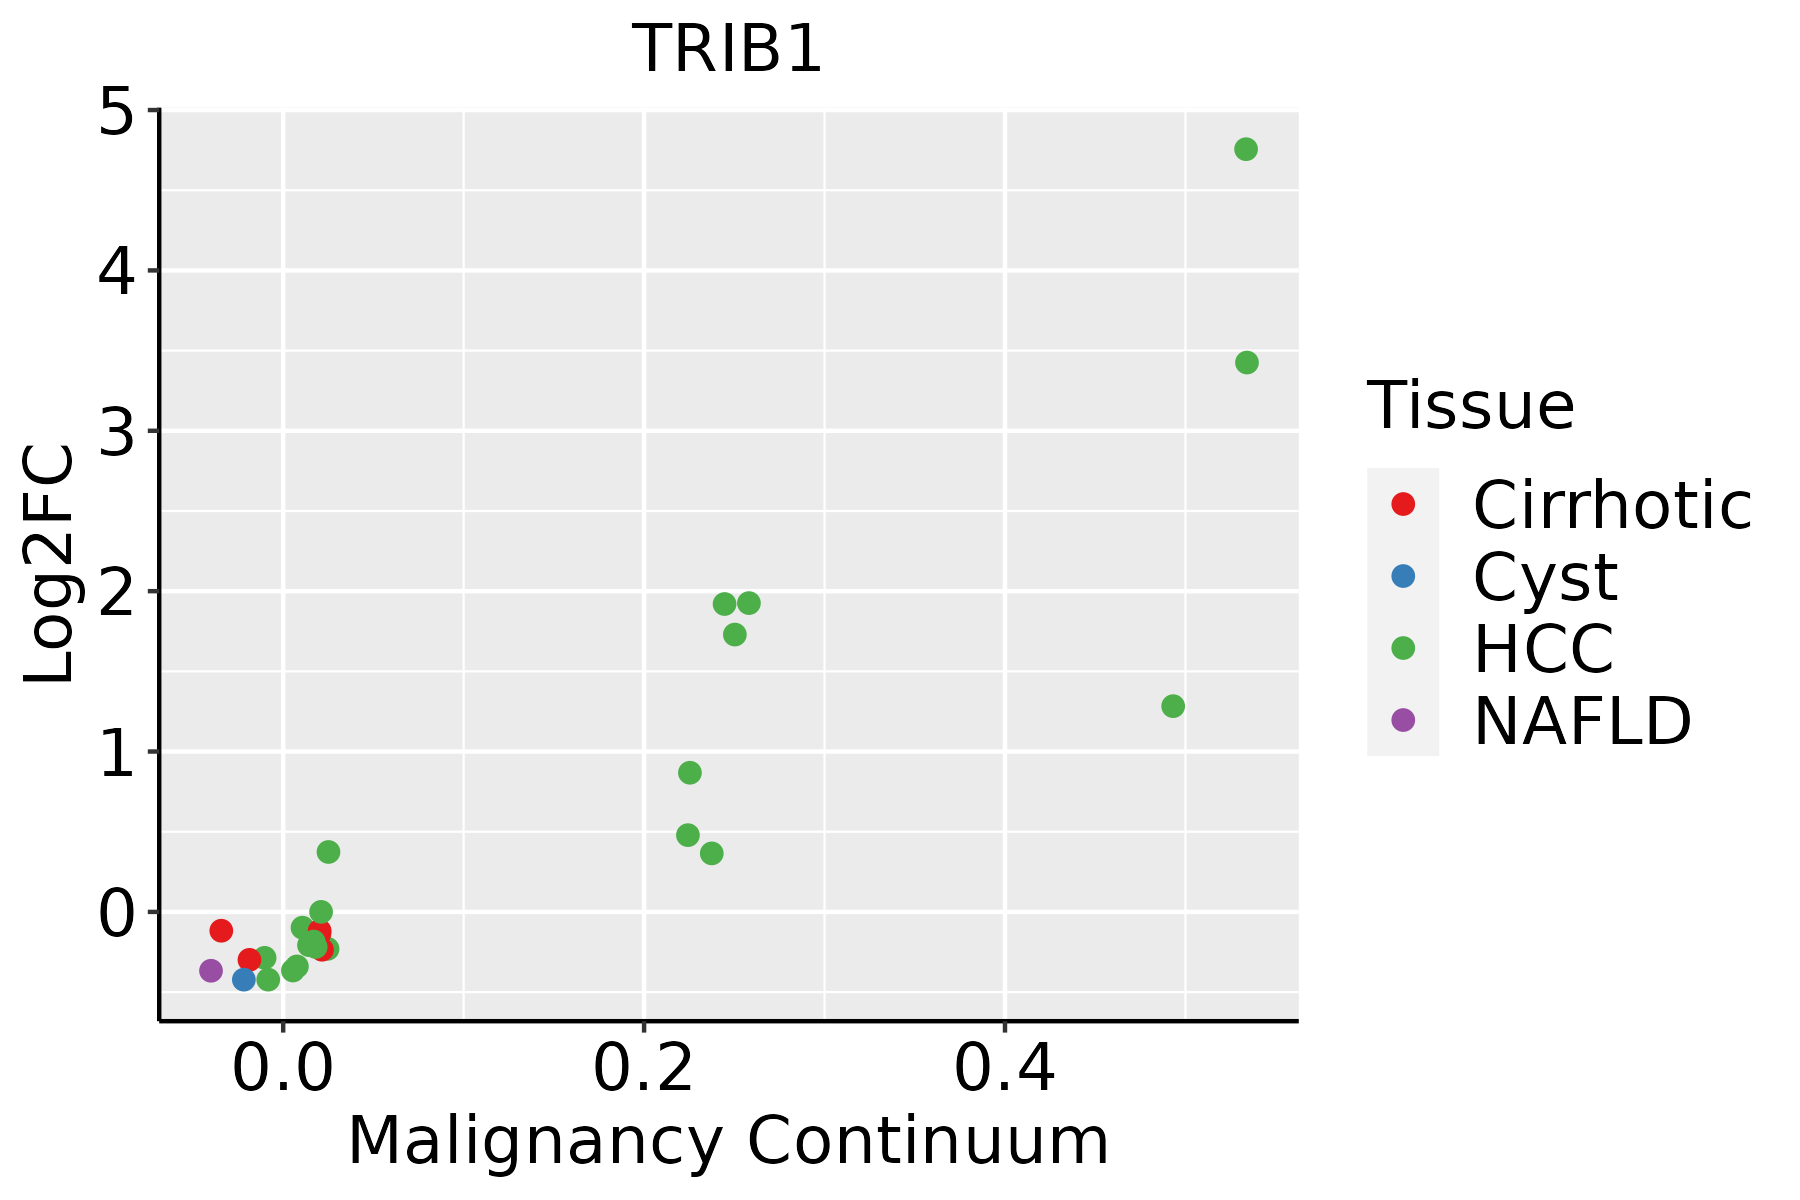 | HCC: Hepatocellular carcinoma |
| NAFLD: Non-alcoholic fatty liver disease |
| Oral Cavity | 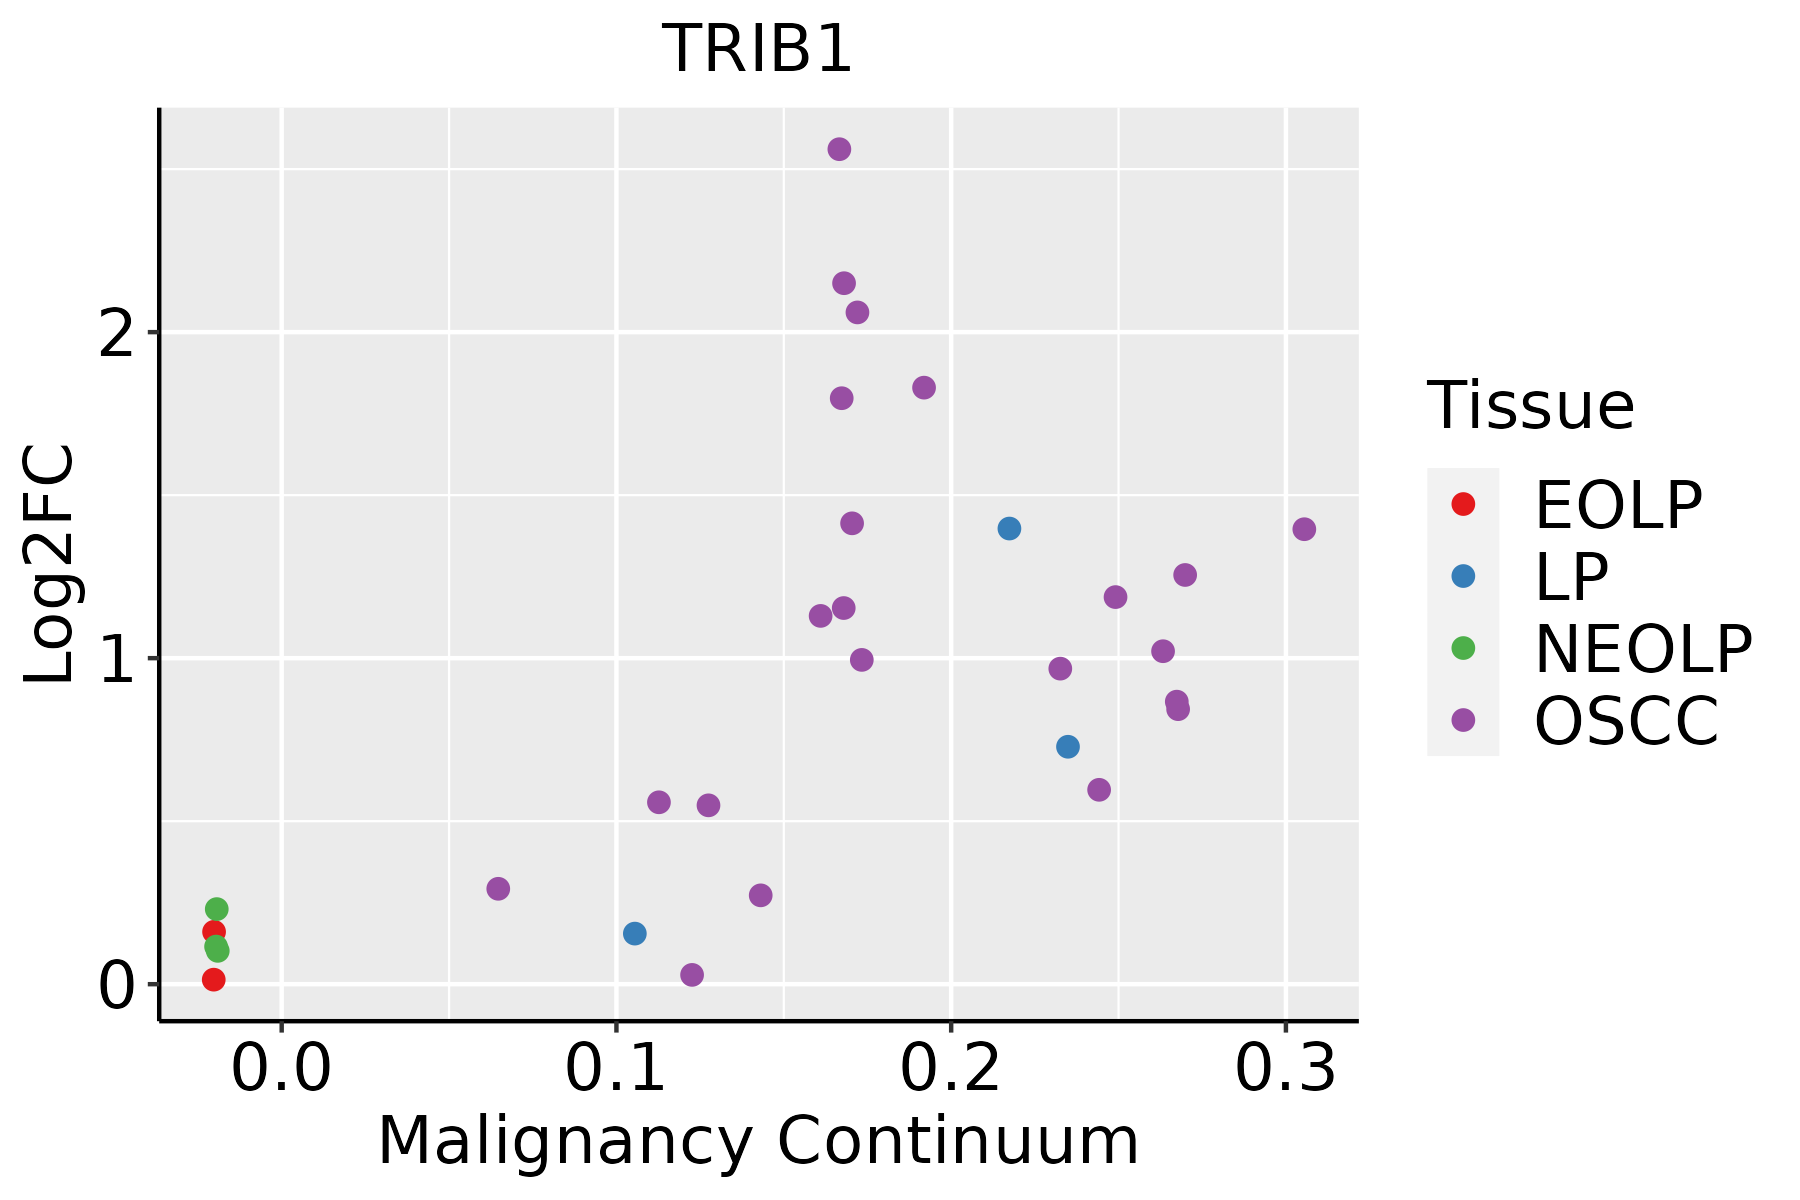 | EOLP: Erosive Oral lichen planus |
| LP: leukoplakia |
| NEOLP: Non-erosive oral lichen planus |
| OSCC: Oral squamous cell carcinoma |
| Prostate | 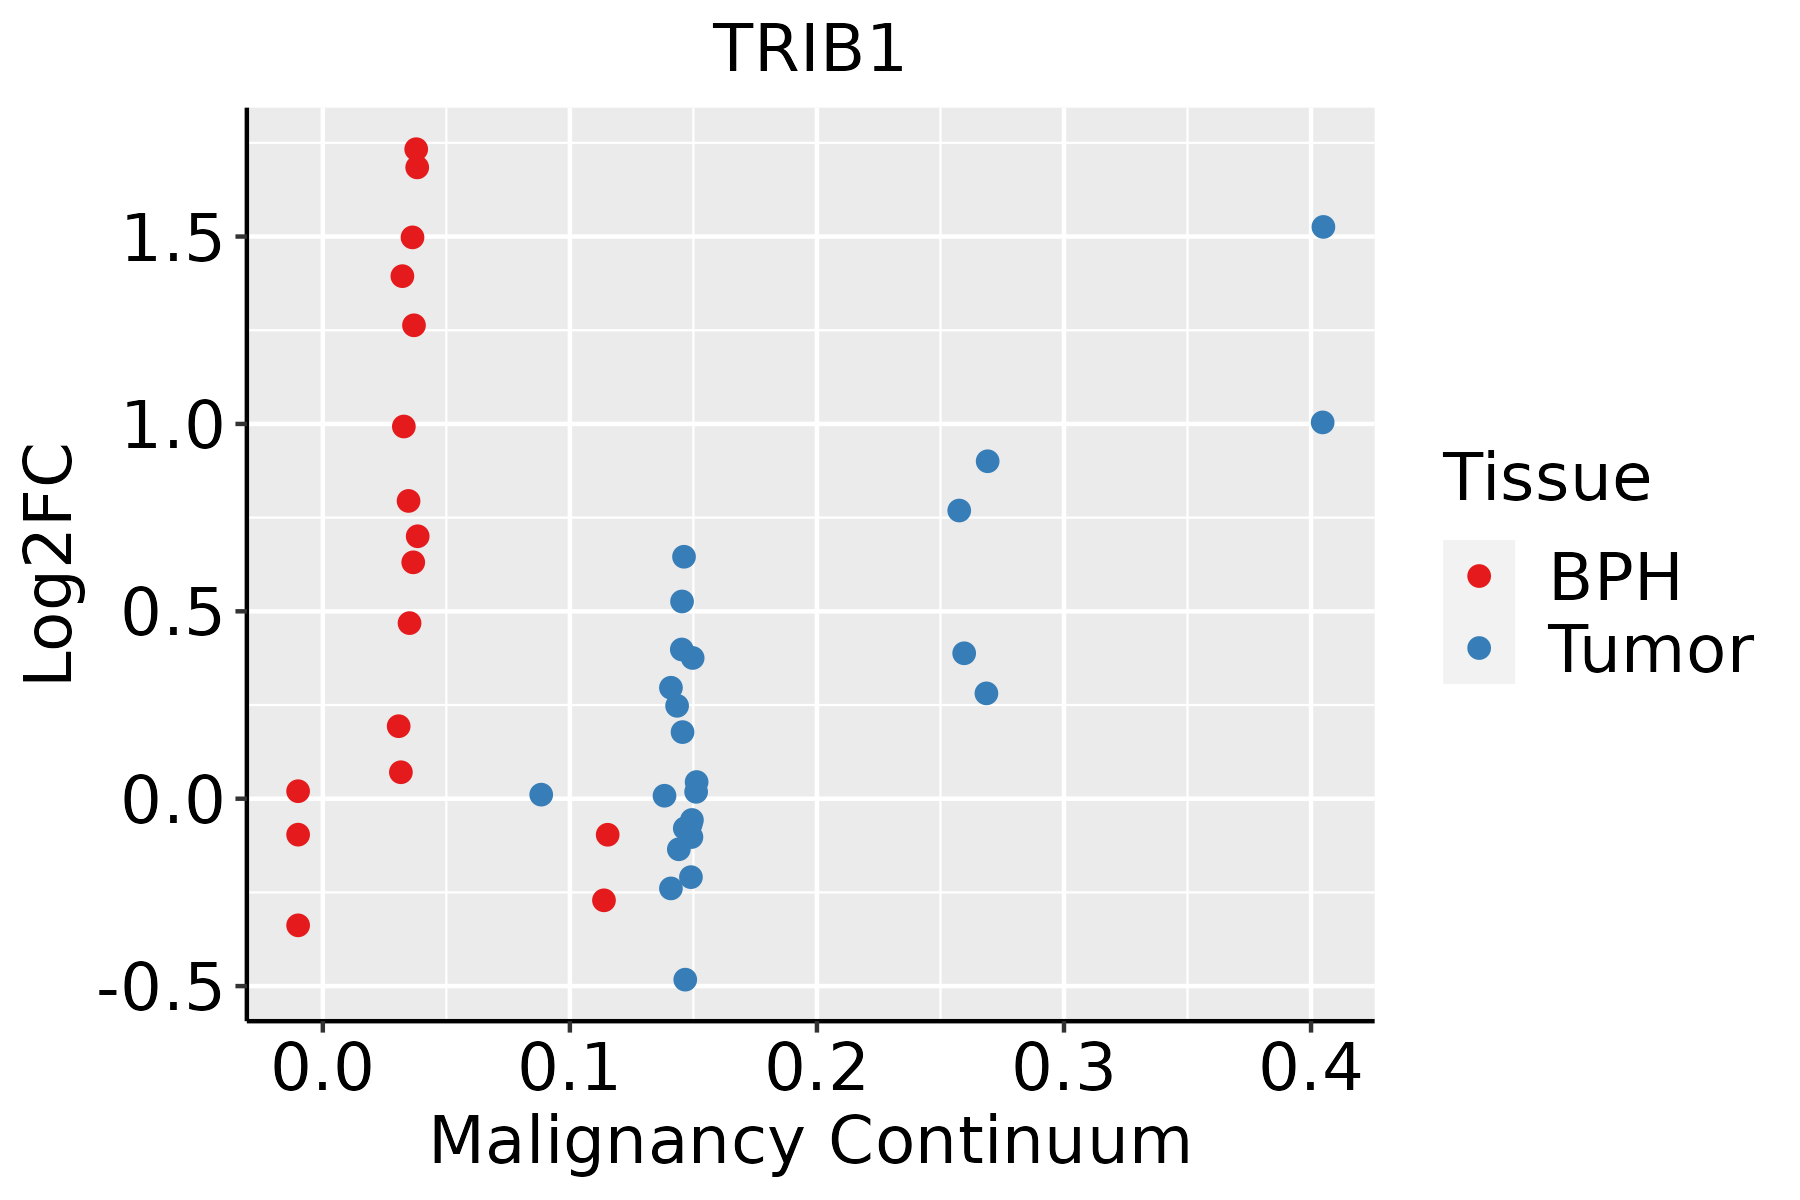 | BPH: Benign Prostatic Hyperplasia |
| Skin |  | AK: Actinic keratosis |
| cSCC: Cutaneous squamous cell carcinoma |
| SCCIS:squamous cell carcinoma in situ |
| Thyroid | 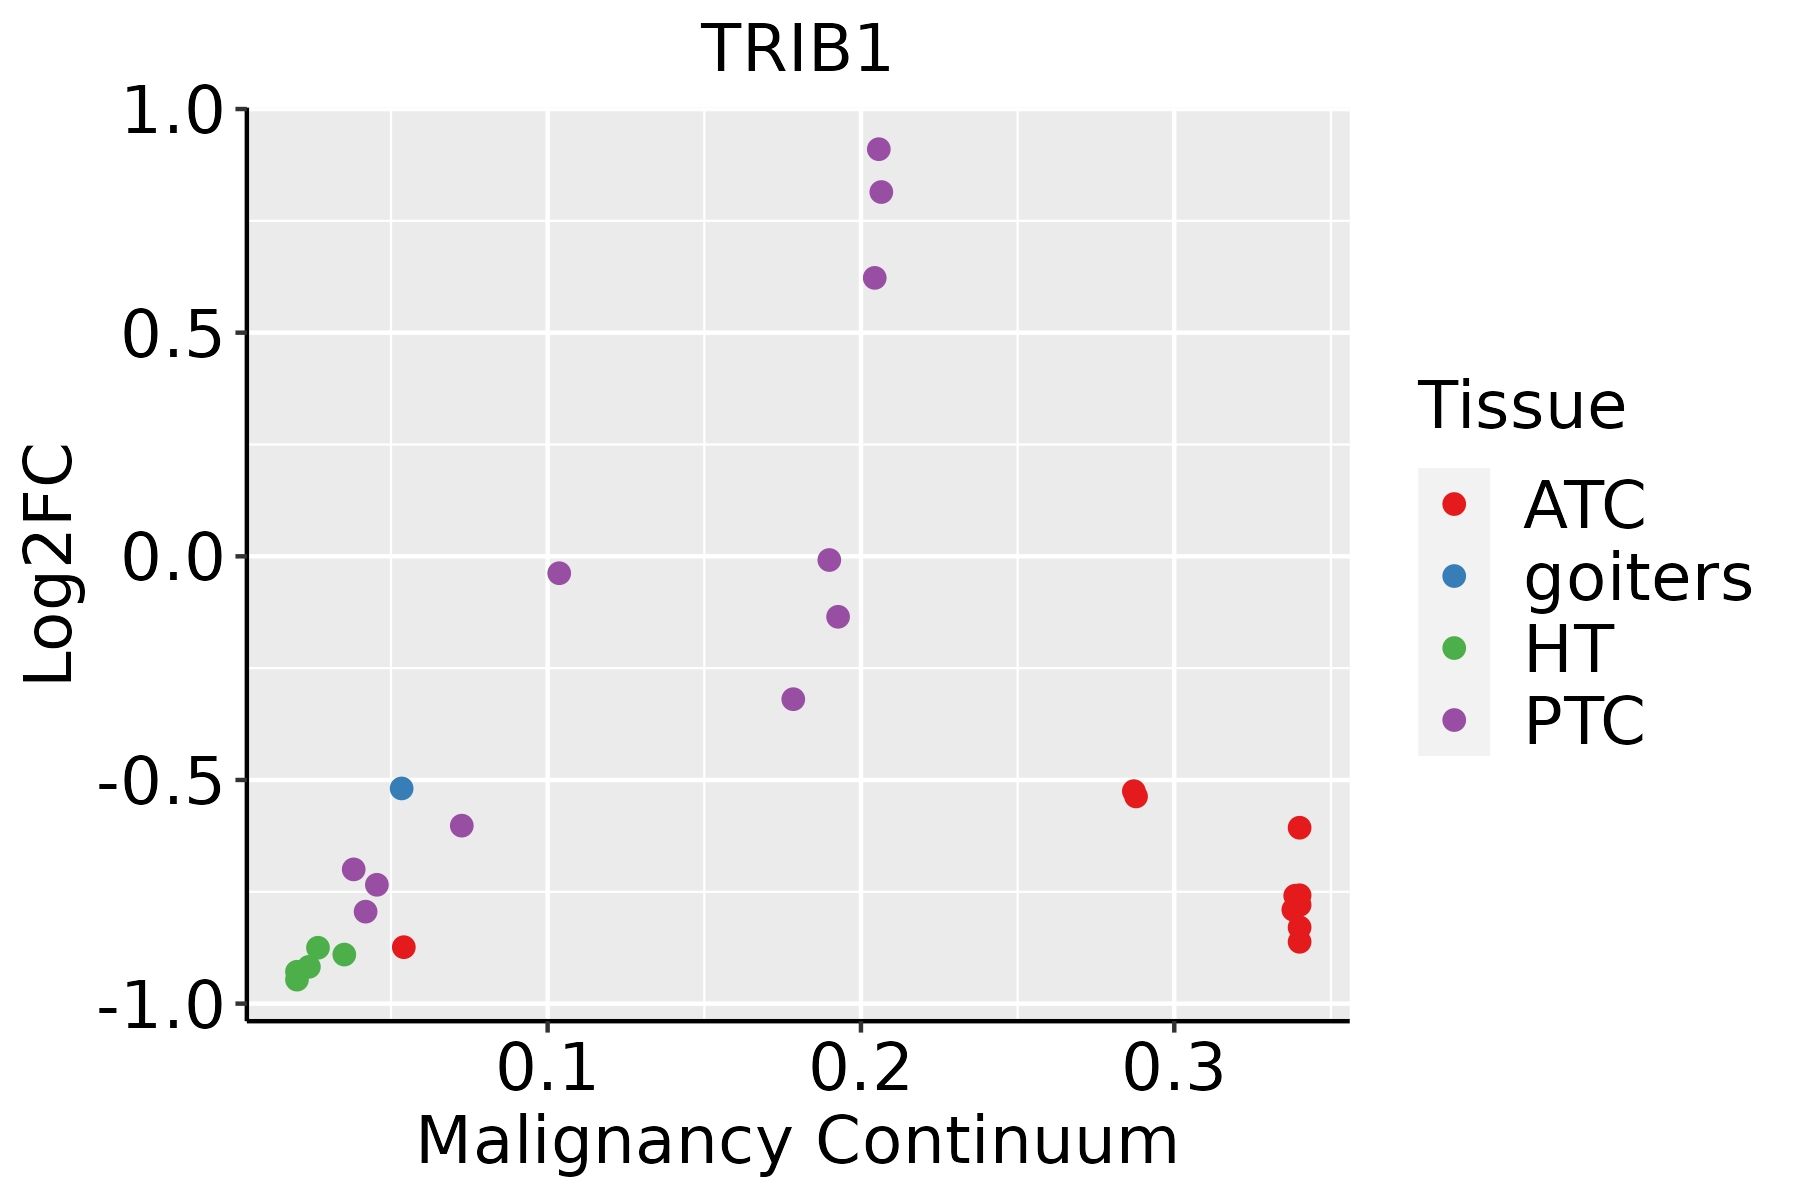 | ATC: Anaplastic thyroid cancer |
| HT: Hashimoto's thyroiditis |
| PTC: Papillary thyroid cancer |
| GO ID | Tissue | Disease Stage | Description | Gene Ratio | Bg Ratio | pvalue | p.adjust | Count |
| GO:007190023 | Oral cavity | EOLP | regulation of protein serine/threonine kinase activity | 75/2218 | 359/18723 | 5.81e-07 | 1.53e-05 | 75 |
| GO:190210514 | Oral cavity | EOLP | regulation of leukocyte differentiation | 62/2218 | 279/18723 | 6.18e-07 | 1.60e-05 | 62 |
| GO:003300212 | Oral cavity | EOLP | muscle cell proliferation | 56/2218 | 248/18723 | 1.25e-06 | 3.00e-05 | 56 |
| GO:004573226 | Oral cavity | EOLP | positive regulation of protein catabolic process | 53/2218 | 231/18723 | 1.43e-06 | 3.42e-05 | 53 |
| GO:004865915 | Oral cavity | EOLP | smooth muscle cell proliferation | 44/2218 | 184/18723 | 3.47e-06 | 7.48e-05 | 44 |
| GO:000257323 | Oral cavity | EOLP | myeloid leukocyte differentiation | 48/2218 | 208/18723 | 3.71e-06 | 7.88e-05 | 48 |
| GO:006113626 | Oral cavity | EOLP | regulation of proteasomal protein catabolic process | 44/2218 | 187/18723 | 5.44e-06 | 1.08e-04 | 44 |
| GO:190336426 | Oral cavity | EOLP | positive regulation of cellular protein catabolic process | 38/2218 | 155/18723 | 8.47e-06 | 1.61e-04 | 38 |
| GO:004866015 | Oral cavity | EOLP | regulation of smooth muscle cell proliferation | 42/2218 | 180/18723 | 1.10e-05 | 1.93e-04 | 42 |
| GO:000283221 | Oral cavity | EOLP | negative regulation of response to biotic stimulus | 28/2218 | 108/18723 | 4.29e-05 | 5.82e-04 | 28 |
| GO:001072021 | Oral cavity | EOLP | positive regulation of cell development | 59/2218 | 298/18723 | 4.72e-05 | 6.25e-04 | 59 |
| GO:005109021 | Oral cavity | EOLP | regulation of DNA-binding transcription factor activity | 80/2218 | 440/18723 | 5.77e-05 | 7.31e-04 | 80 |
| GO:003249623 | Oral cavity | EOLP | response to lipopolysaccharide | 65/2218 | 343/18723 | 8.02e-05 | 9.65e-04 | 65 |
| GO:004340521 | Oral cavity | EOLP | regulation of MAP kinase activity | 39/2218 | 177/18723 | 8.57e-05 | 1.02e-03 | 39 |
| GO:200006024 | Oral cavity | EOLP | positive regulation of ubiquitin-dependent protein catabolic process | 27/2218 | 107/18723 | 9.64e-05 | 1.12e-03 | 27 |
| GO:004563916 | Oral cavity | EOLP | positive regulation of myeloid cell differentiation | 26/2218 | 103/18723 | 1.28e-04 | 1.41e-03 | 26 |
| GO:000223724 | Oral cavity | EOLP | response to molecule of bacterial origin | 67/2218 | 363/18723 | 1.42e-04 | 1.53e-03 | 67 |
| GO:00303366 | Oral cavity | EOLP | negative regulation of cell migration | 64/2218 | 344/18723 | 1.57e-04 | 1.67e-03 | 64 |
| GO:00321023 | Oral cavity | EOLP | negative regulation of response to external stimulus | 75/2218 | 420/18723 | 1.74e-04 | 1.80e-03 | 75 |
| GO:003109824 | Oral cavity | EOLP | stress-activated protein kinase signaling cascade | 49/2218 | 247/18723 | 1.89e-04 | 1.94e-03 | 49 |
| Hugo Symbol | Variant Class | Variant Classification | dbSNP RS | HGVSc | HGVSp | HGVSp Short | SWISSPROT | BIOTYPE | SIFT | PolyPhen | Tumor Sample Barcode | Tissue | Histology | Sex | Age | Stage | Therapy Types | Drugs | Outcome |
| TRIB1 | SNV | Missense_Mutation | | c.616N>G | p.Leu206Val | p.L206V | Q96RU8 | protein_coding | deleterious(0.01) | probably_damaging(0.999) | TCGA-A2-A04Y-01 | Breast | breast invasive carcinoma | Female | <65 | I/II | Chemotherapy | cytoxan | SD |
| TRIB1 | SNV | Missense_Mutation | | c.1015N>A | p.Glu339Lys | p.E339K | Q96RU8 | protein_coding | tolerated(0.45) | benign(0.003) | TCGA-AC-A23H-01 | Breast | breast invasive carcinoma | Female | >=65 | I/II | Unknown | Unknown | PD |
| TRIB1 | SNV | Missense_Mutation | rs138022510 | c.947G>A | p.Arg316His | p.R316H | Q96RU8 | protein_coding | deleterious(0.03) | probably_damaging(0.986) | TCGA-AO-A03O-01 | Breast | breast invasive carcinoma | Female | >=65 | I/II | Chemotherapy | doxorubicin | SD |
| TRIB1 | SNV | Missense_Mutation | | c.424N>C | p.Asn142His | p.N142H | Q96RU8 | protein_coding | tolerated(0.53) | benign(0.115) | TCGA-B6-A0RS-01 | Breast | breast invasive carcinoma | Female | <65 | I/II | Unknown | Unknown | PD |
| TRIB1 | insertion | Frame_Shift_Ins | novel | c.565_566insACCC | p.Ile189AsnfsTer22 | p.I189Nfs*22 | Q96RU8 | protein_coding | | | TCGA-AN-A04A-01 | Breast | breast invasive carcinoma | Female | <65 | III/IV | Unknown | Unknown | SD |
| TRIB1 | insertion | Nonsense_Mutation | novel | c.566_567insTTGGGTATTTGCAAGTCTAGAGCTTTAGG | p.Val190TrpfsTer9 | p.V190Wfs*9 | Q96RU8 | protein_coding | | | TCGA-AN-A04A-01 | Breast | breast invasive carcinoma | Female | <65 | III/IV | Unknown | Unknown | SD |
| TRIB1 | insertion | Frame_Shift_Ins | novel | c.742_743insCTTGTAAGCTCCAGCATTATGAATACTATTTGGGGCTTTGCCTC | p.Tyr248SerfsTer17 | p.Y248Sfs*17 | Q96RU8 | protein_coding | | | TCGA-AO-A03T-01 | Breast | breast invasive carcinoma | Female | <65 | I/II | Chemotherapy | cyclophosphamide | SD |
| TRIB1 | insertion | Frame_Shift_Ins | novel | c.507dupC | p.Tyr170LeufsTer40 | p.Y170Lfs*40 | Q96RU8 | protein_coding | | | TCGA-AR-A250-01 | Breast | breast invasive carcinoma | Female | <65 | I/II | Chemotherapy | doxorubicin | SD |
| TRIB1 | SNV | Missense_Mutation | novel | c.974N>G | p.Glu325Gly | p.E325G | Q96RU8 | protein_coding | deleterious(0) | probably_damaging(0.989) | TCGA-ZJ-AB0I-01 | Cervix | cervical & endocervical cancer | Female | <65 | I/II | Unknown | Unknown | SD |
| TRIB1 | SNV | Missense_Mutation | rs776955393 | c.1039A>G | p.Ile347Val | p.I347V | Q96RU8 | protein_coding | tolerated(0.54) | benign(0) | TCGA-A6-6781-01 | Colorectum | colon adenocarcinoma | Male | <65 | III/IV | Chemotherapy | oxaliplatin | SD |


