
|
|||||
|
 | |
| |
| |
| |
| |
| |
|
Gene: TAOK1 |
Gene summary for TAOK1 |
| Gene information | Species | Human | Gene symbol | TAOK1 | Gene ID | 57551 |
| Gene name | TAO kinase 1 | |
| Gene Alias | KFC-B | |
| Cytomap | 17q11.2 | |
| Gene Type | protein-coding | GO ID | GO:0000075 | UniProtAcc | A0A024QZ70 |
Top |
Malignant transformation analysis |
| Identification of the aberrant gene expression in precancerous and cancerous lesions by comparing the gene expression of stem-like cells in diseased tissues with normal stem cells |
| Entrez ID | Symbol | Replicates | Species | Organ | Tissue | Adj P-value | Log2FC | Malignancy |
| 57551 | TAOK1 | N_HPV_1 | Human | Cervix | N_HPV | 8.53e-05 | -1.53e-01 | 0.0079 |
| 57551 | TAOK1 | CCI_1 | Human | Cervix | CC | 2.34e-02 | 5.47e-01 | 0.528 |
| 57551 | TAOK1 | CCI_3 | Human | Cervix | CC | 7.65e-04 | 5.70e-01 | 0.516 |
| 57551 | TAOK1 | HTA11_866_3004761011 | Human | Colorectum | AD | 1.98e-03 | -4.05e-01 | 0.096 |
| 57551 | TAOK1 | HTA11_6818_2000001021 | Human | Colorectum | AD | 2.32e-02 | -3.58e-01 | 0.0588 |
| 57551 | TAOK1 | F007 | Human | Colorectum | FAP | 1.48e-02 | -2.64e-01 | 0.1176 |
| 57551 | TAOK1 | A002-C-010 | Human | Colorectum | FAP | 2.62e-03 | -1.99e-01 | 0.242 |
| 57551 | TAOK1 | A015-C-203 | Human | Colorectum | FAP | 2.03e-32 | -4.08e-01 | -0.1294 |
| 57551 | TAOK1 | A015-C-204 | Human | Colorectum | FAP | 3.44e-08 | -3.99e-01 | -0.0228 |
| 57551 | TAOK1 | A014-C-040 | Human | Colorectum | FAP | 8.25e-07 | -5.98e-01 | -0.1184 |
| 57551 | TAOK1 | A002-C-201 | Human | Colorectum | FAP | 1.34e-13 | -4.09e-01 | 0.0324 |
| 57551 | TAOK1 | A002-C-203 | Human | Colorectum | FAP | 1.96e-04 | -1.96e-01 | 0.2786 |
| 57551 | TAOK1 | A001-C-119 | Human | Colorectum | FAP | 2.19e-07 | -7.70e-04 | -0.1557 |
| 57551 | TAOK1 | A001-C-108 | Human | Colorectum | FAP | 1.19e-19 | -2.54e-01 | -0.0272 |
| 57551 | TAOK1 | A002-C-205 | Human | Colorectum | FAP | 4.24e-23 | -3.31e-01 | -0.1236 |
| 57551 | TAOK1 | A001-C-104 | Human | Colorectum | FAP | 1.80e-04 | -2.53e-01 | 0.0184 |
| 57551 | TAOK1 | A015-C-005 | Human | Colorectum | FAP | 8.18e-05 | -2.63e-01 | -0.0336 |
| 57551 | TAOK1 | A015-C-006 | Human | Colorectum | FAP | 4.52e-16 | -4.35e-01 | -0.0994 |
| 57551 | TAOK1 | A015-C-106 | Human | Colorectum | FAP | 2.66e-15 | -3.22e-01 | -0.0511 |
| 57551 | TAOK1 | A002-C-114 | Human | Colorectum | FAP | 8.20e-20 | -3.90e-01 | -0.1561 |
| Page: 1 2 3 4 5 6 7 8 9 10 |
| Tissue | Expression Dynamics | Abbreviation |
| Cervix | 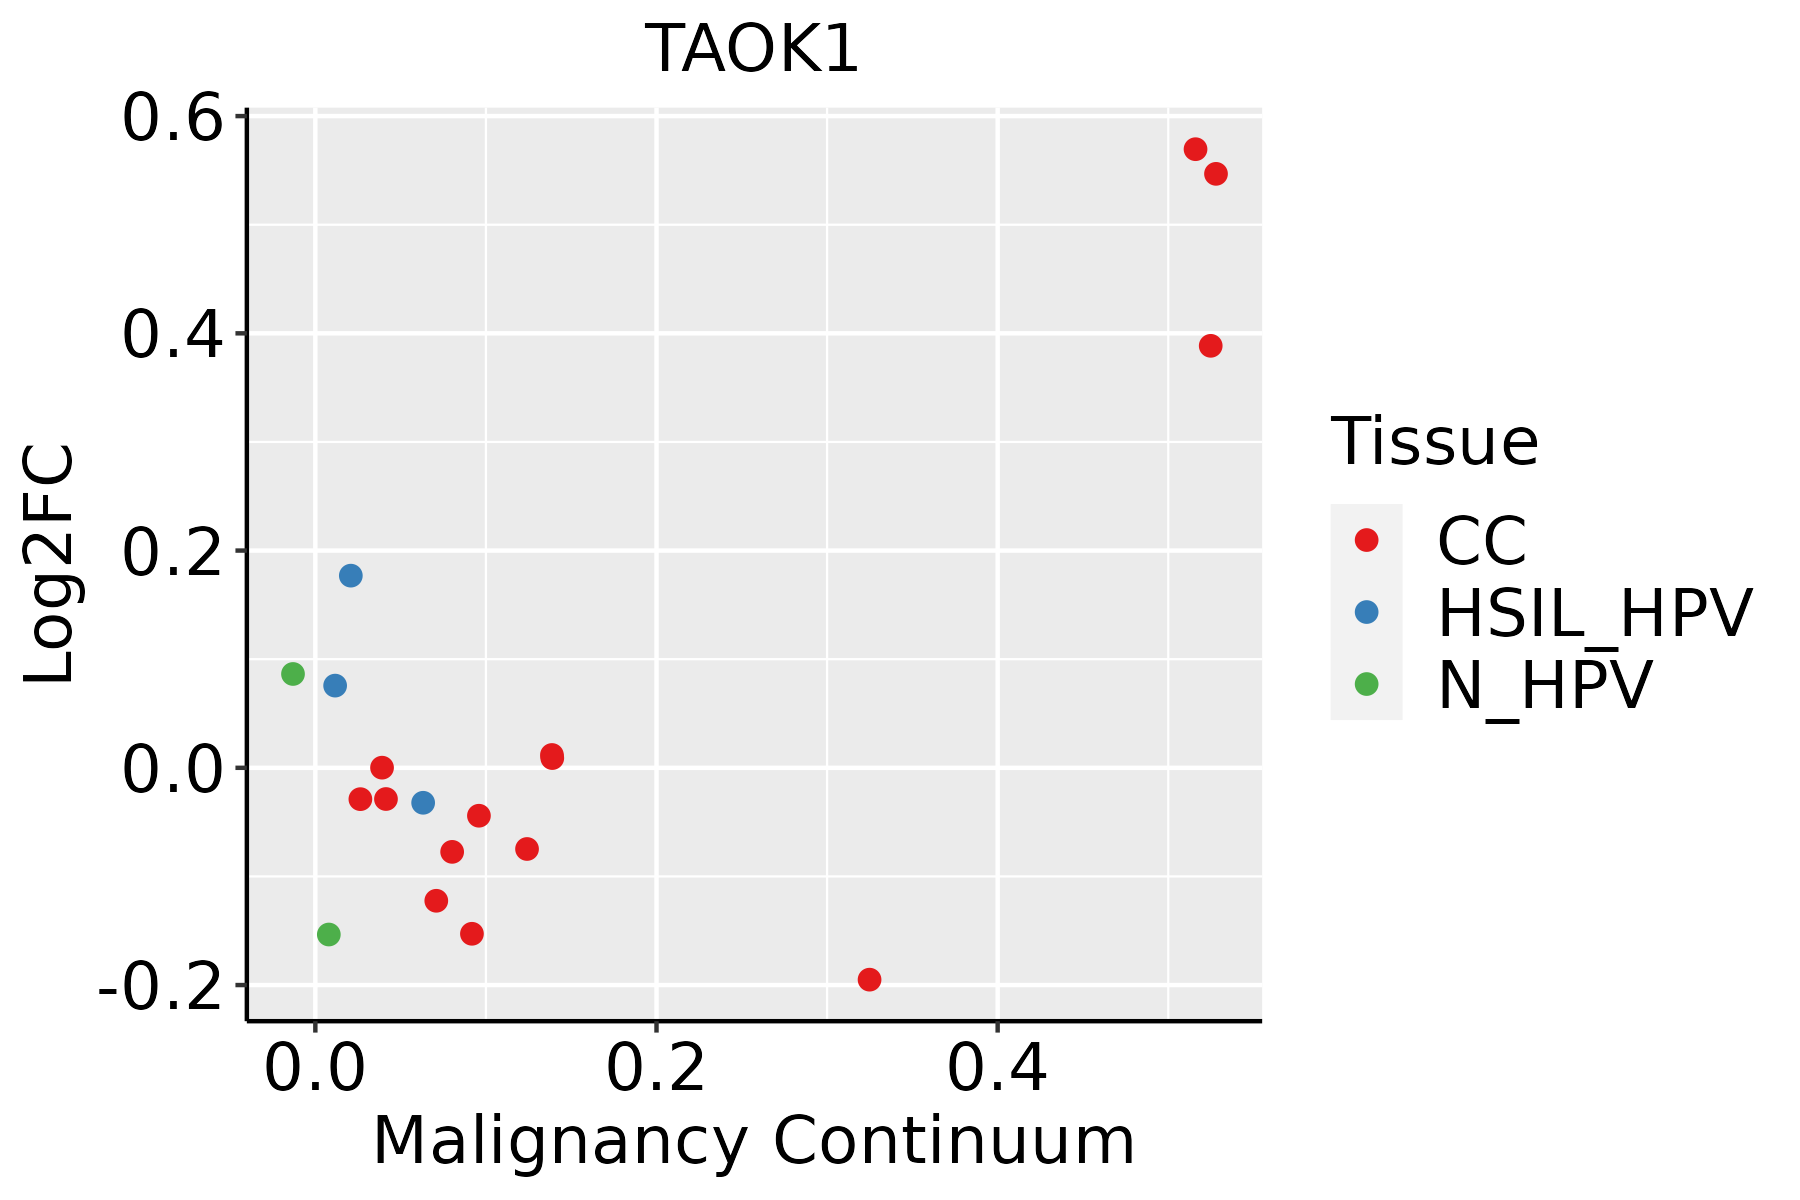 | CC: Cervix cancer |
| HSIL_HPV: HPV-infected high-grade squamous intraepithelial lesions | ||
| N_HPV: HPV-infected normal cervix | ||
| Colorectum (GSE201348) |  | FAP: Familial adenomatous polyposis |
| CRC: Colorectal cancer | ||
| Colorectum (HTA11) | 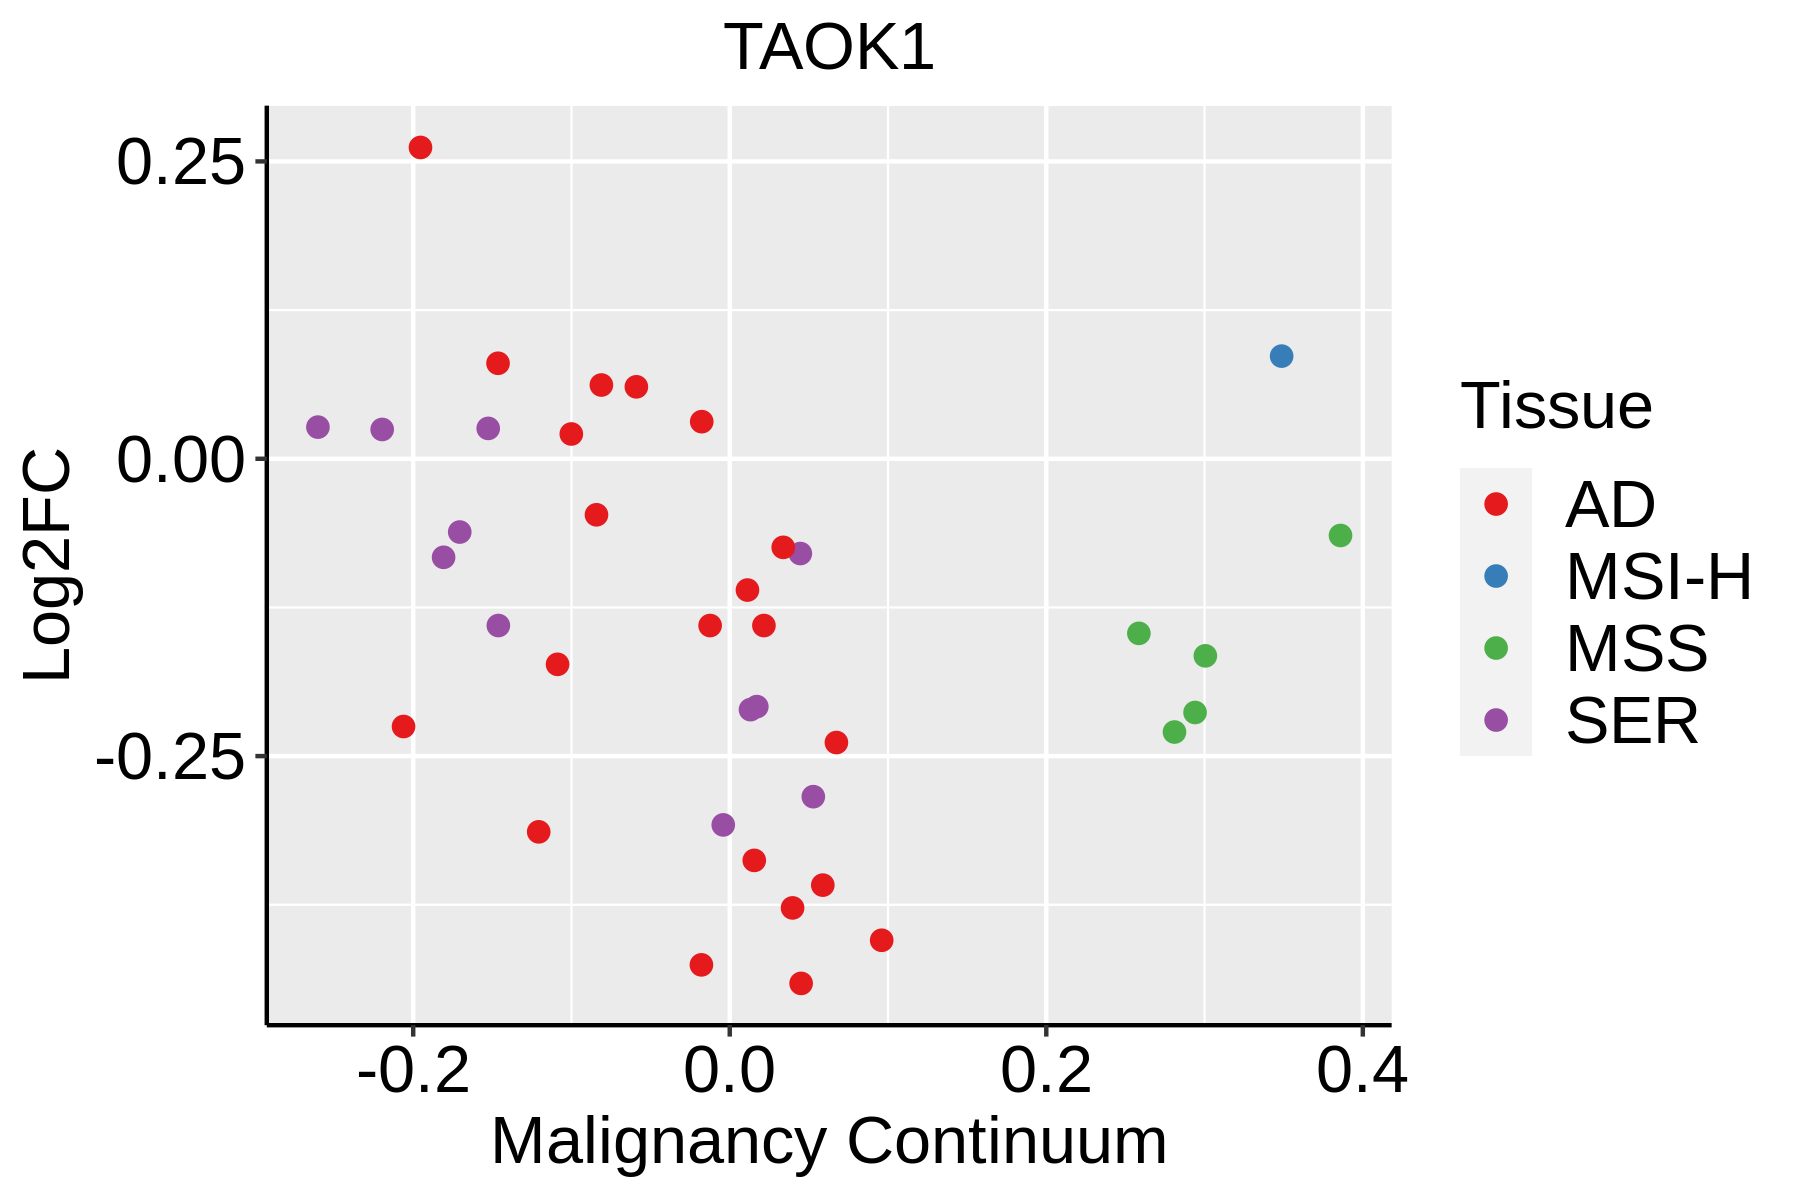 | AD: Adenomas |
| SER: Sessile serrated lesions | ||
| MSI-H: Microsatellite-high colorectal cancer | ||
| MSS: Microsatellite stable colorectal cancer | ||
| Endometrium | 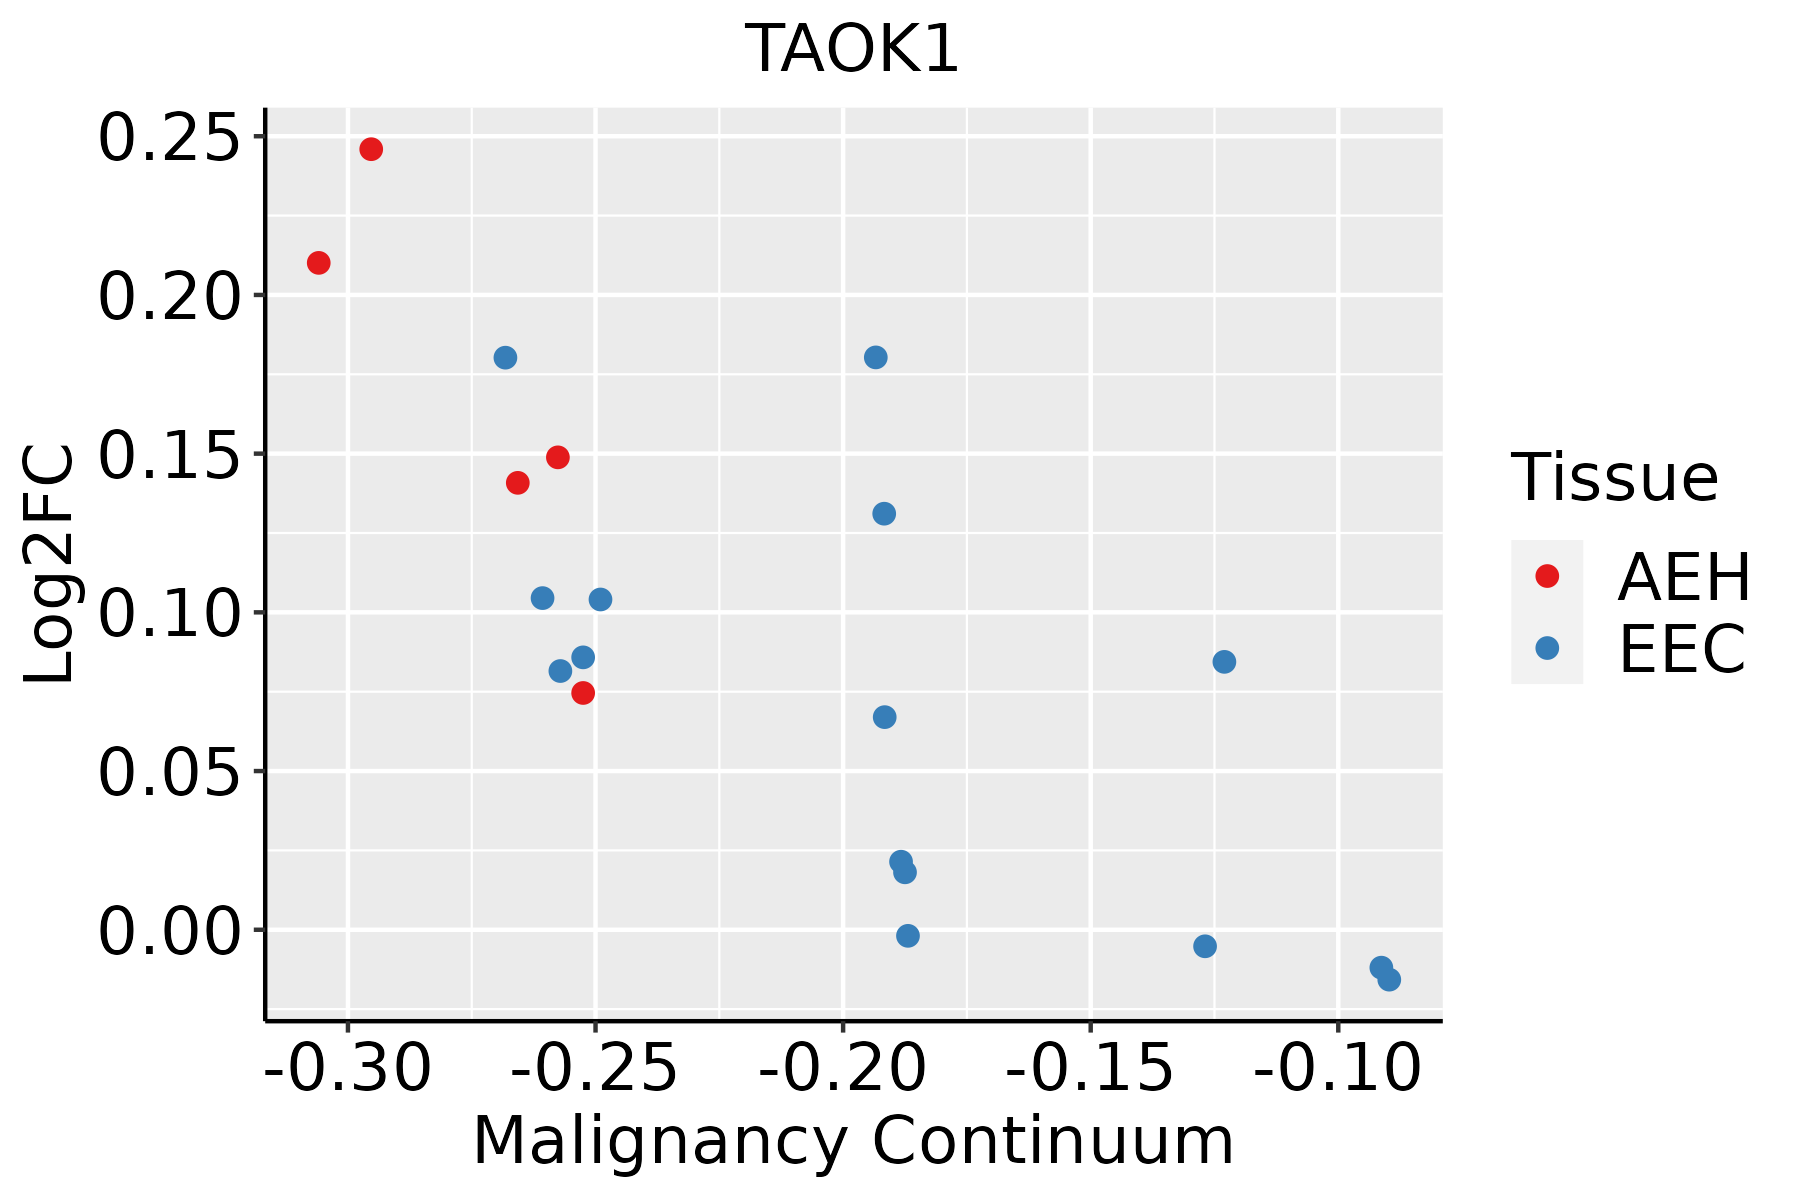 | AEH: Atypical endometrial hyperplasia |
| EEC: Endometrioid Cancer | ||
| Esophagus | 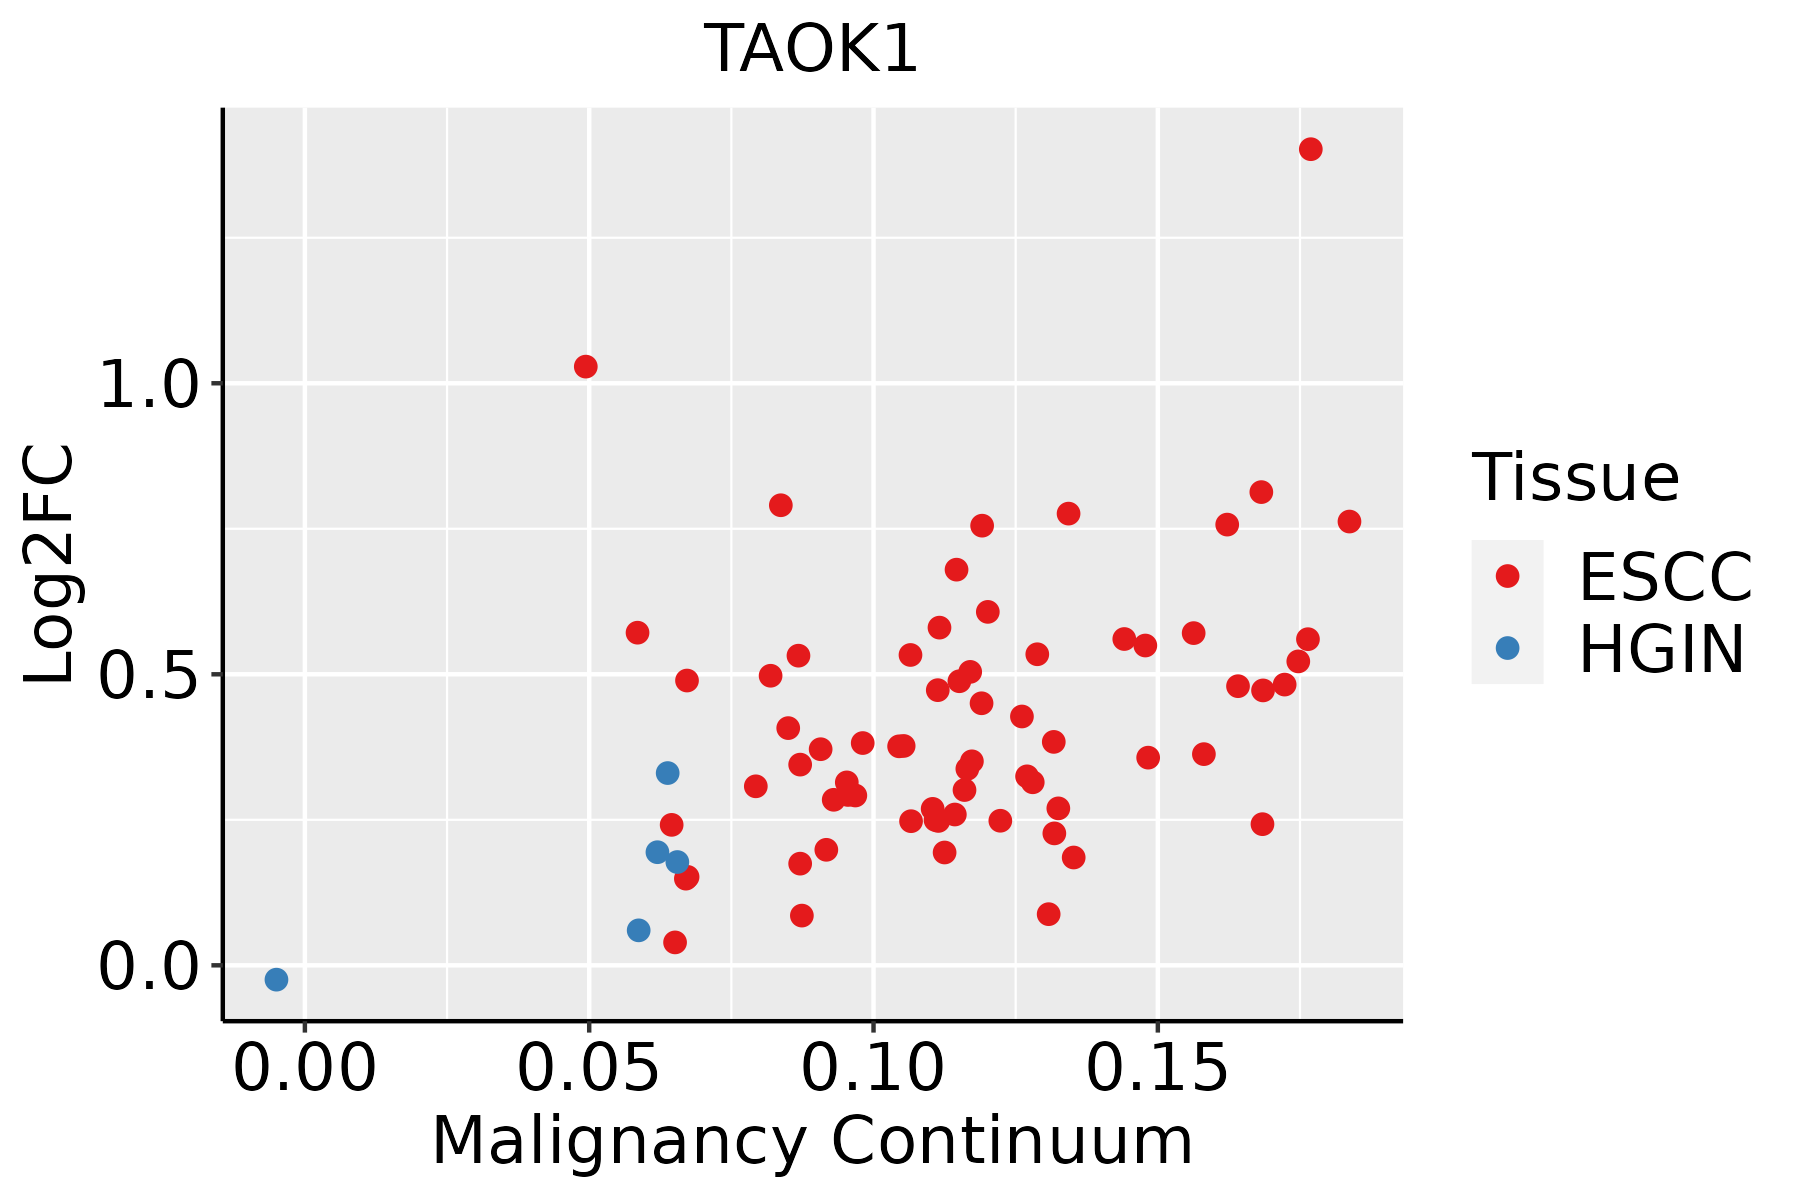 | ESCC: Esophageal squamous cell carcinoma |
| HGIN: High-grade intraepithelial neoplasias | ||
| LGIN: Low-grade intraepithelial neoplasias | ||
| Liver | 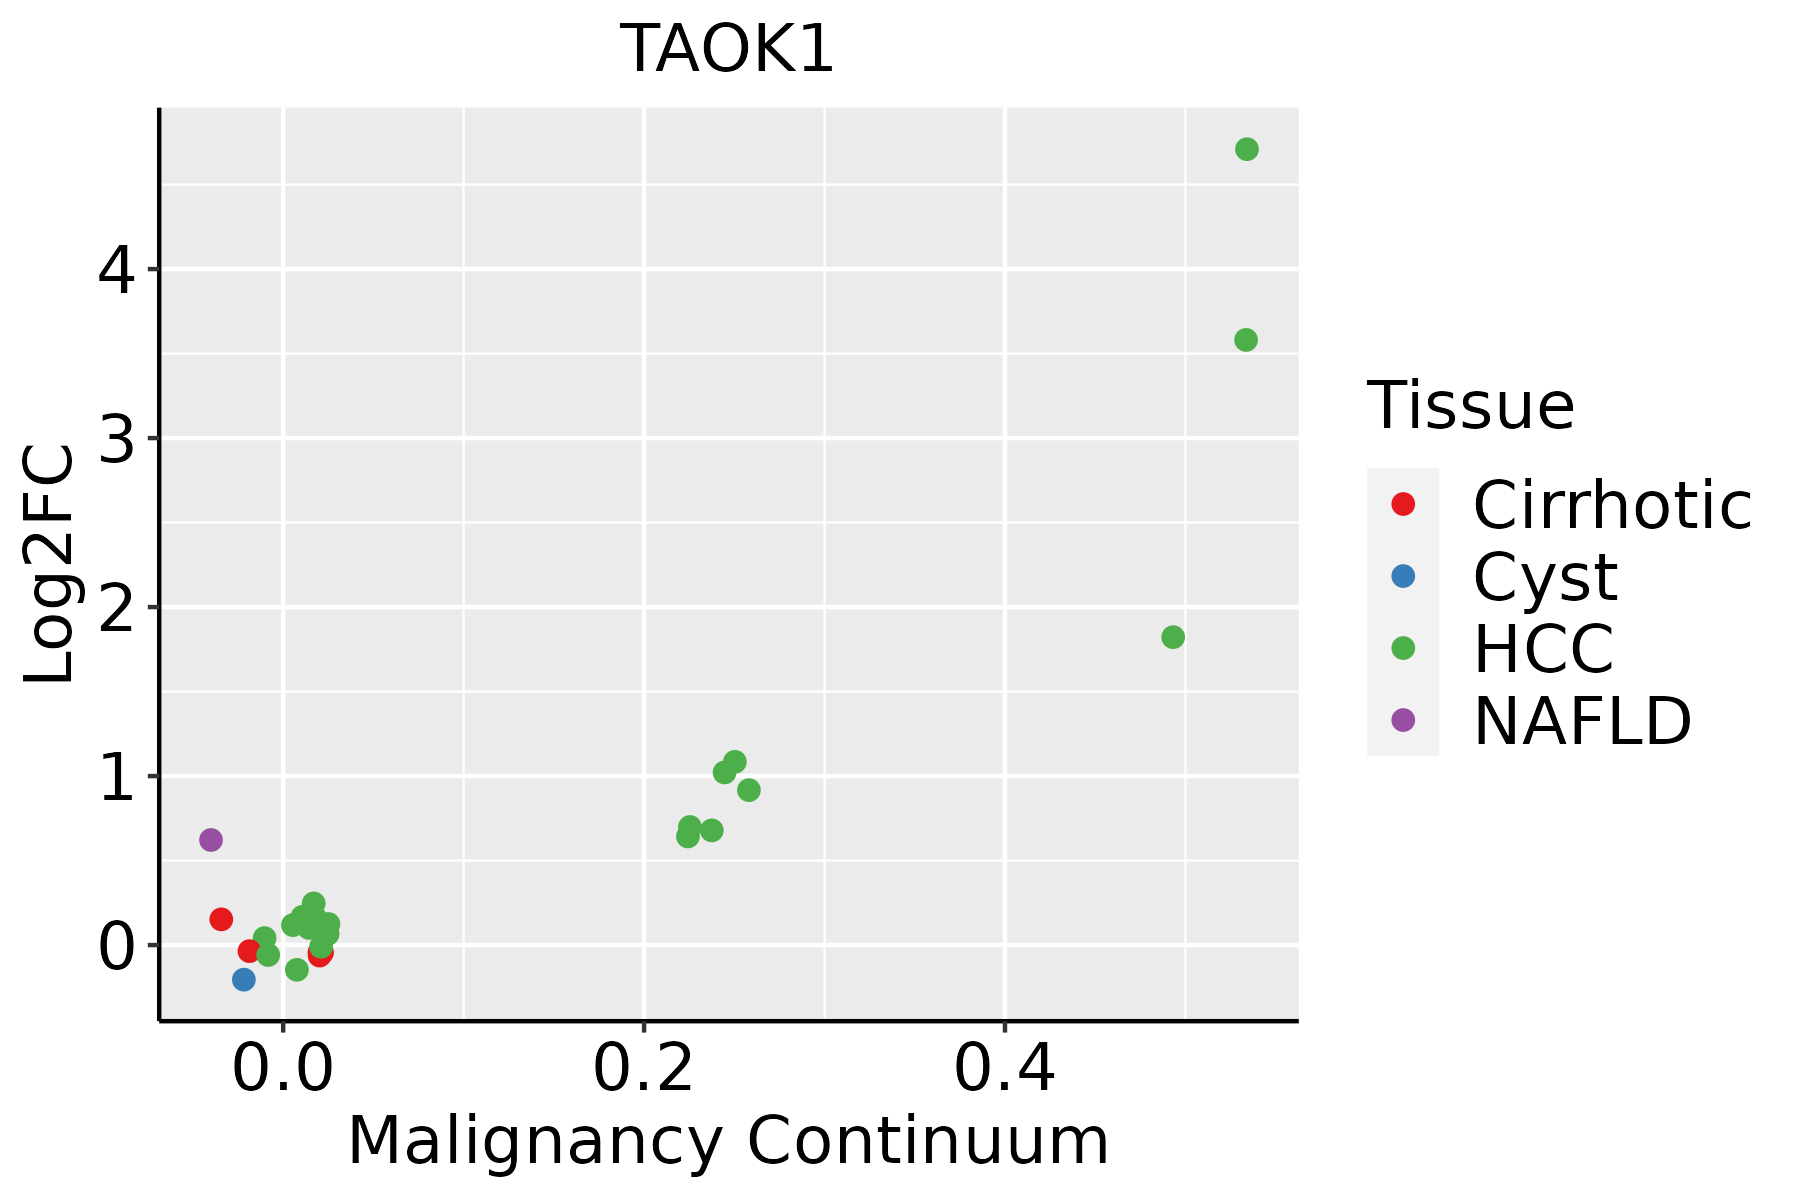 | HCC: Hepatocellular carcinoma |
| NAFLD: Non-alcoholic fatty liver disease | ||
| Oral Cavity | 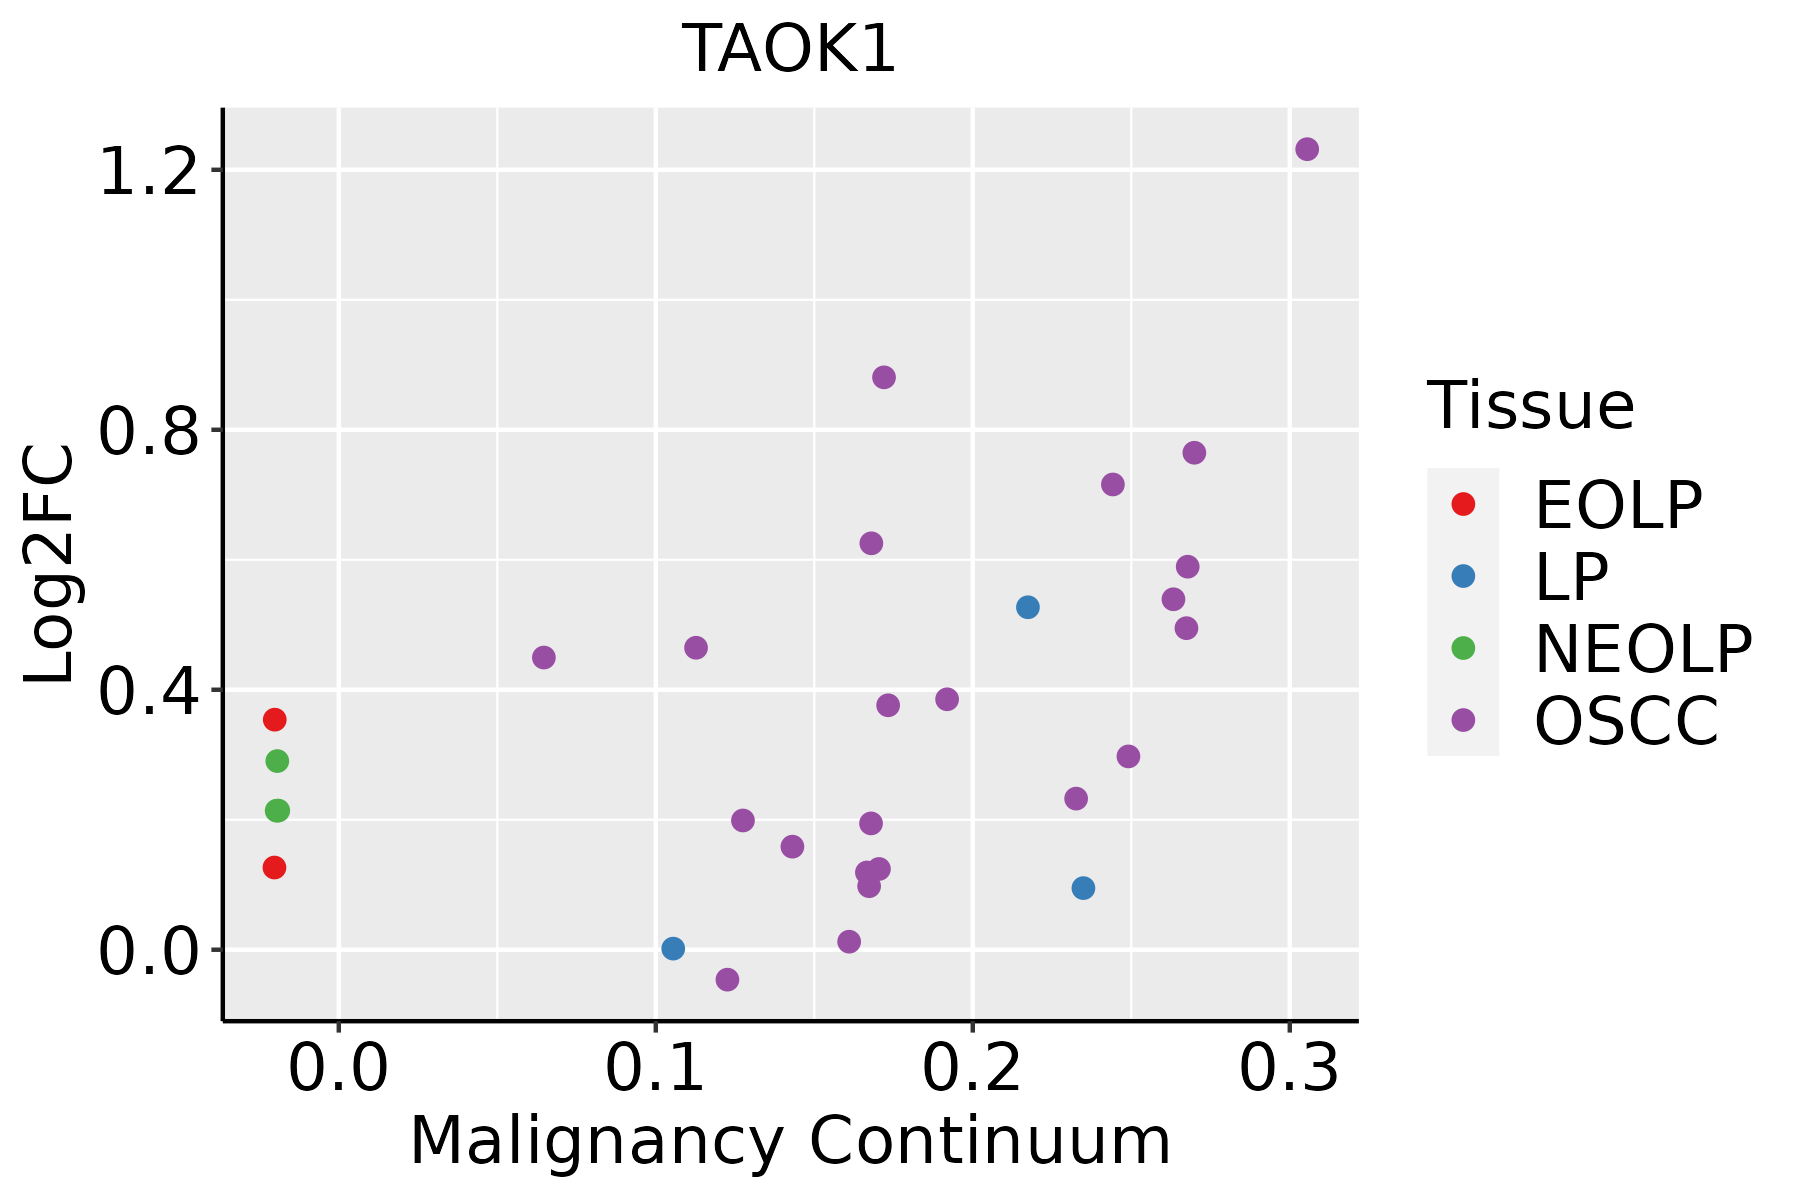 | EOLP: Erosive Oral lichen planus |
| LP: leukoplakia | ||
| NEOLP: Non-erosive oral lichen planus | ||
| OSCC: Oral squamous cell carcinoma | ||
| Prostate | 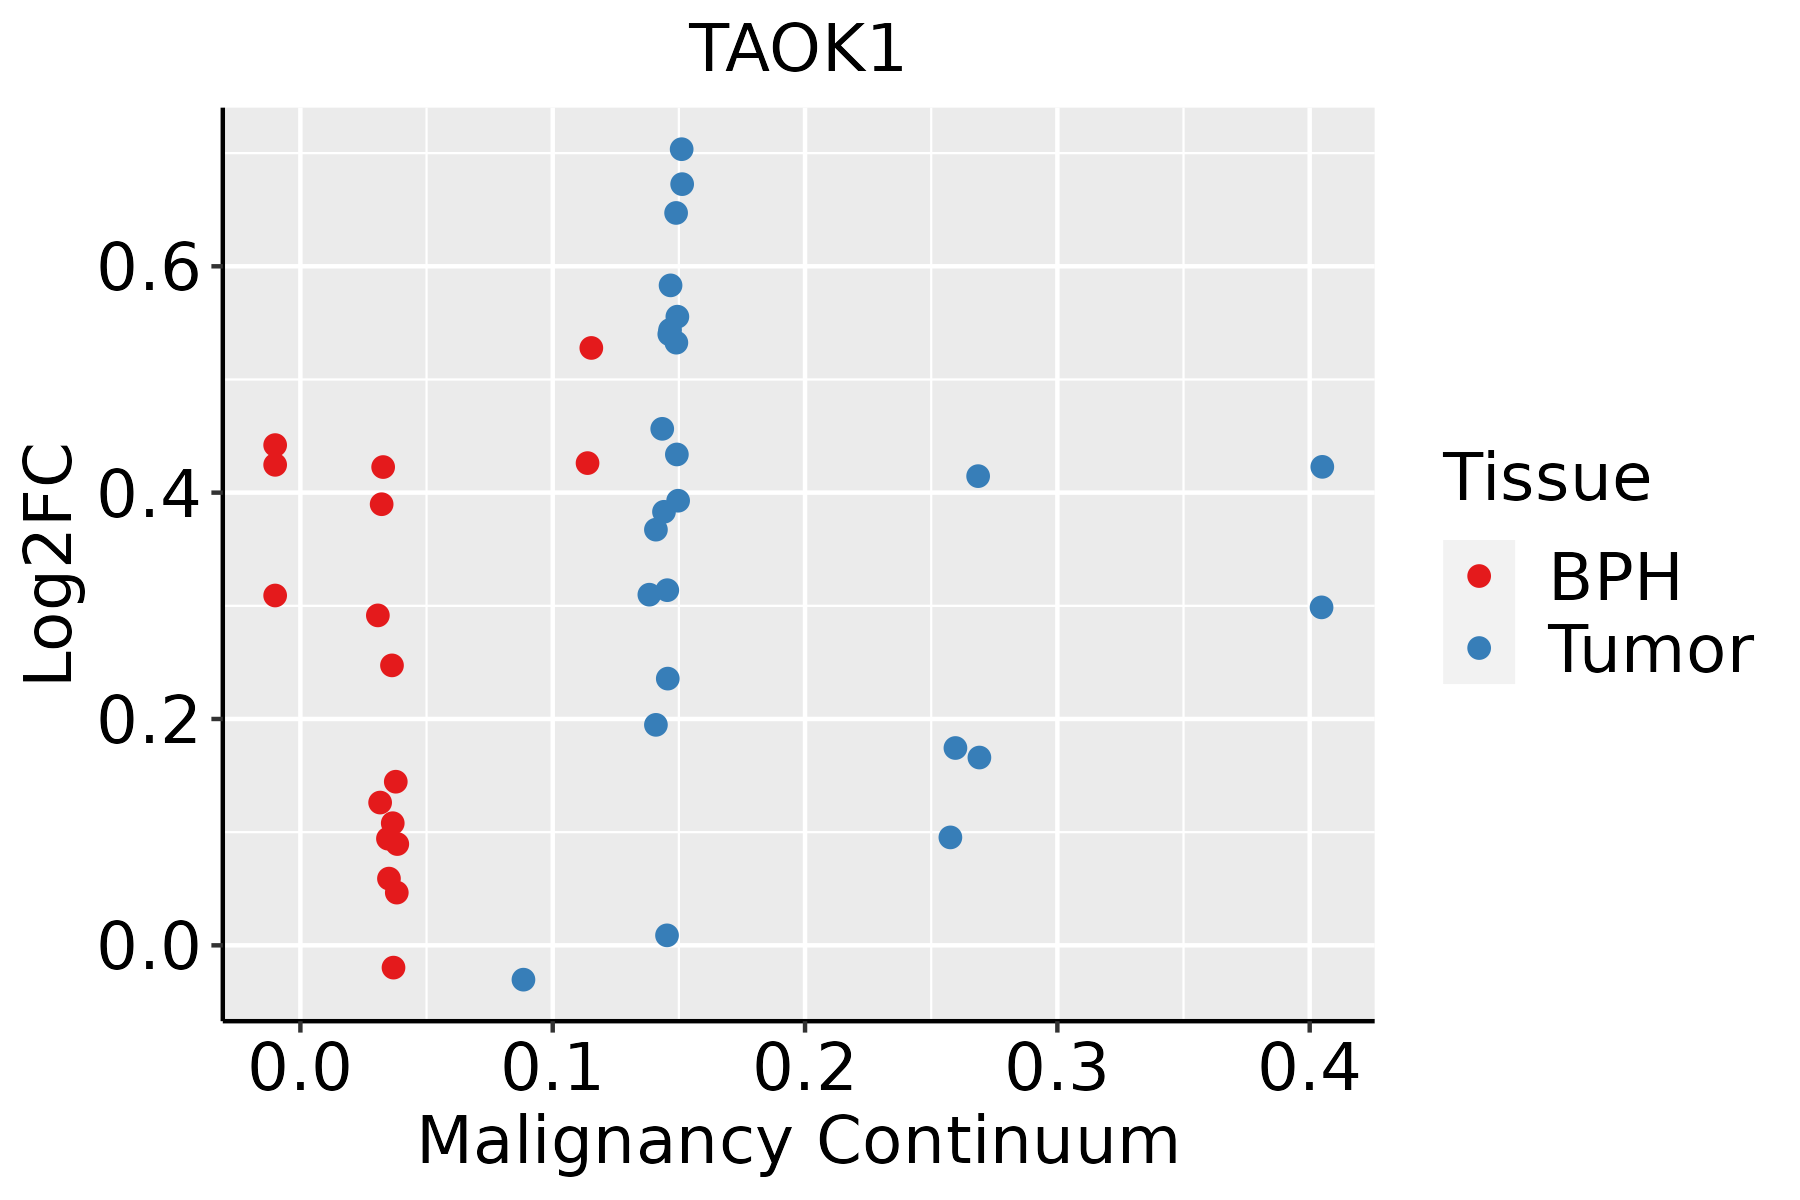 | BPH: Benign Prostatic Hyperplasia |
| Skin | 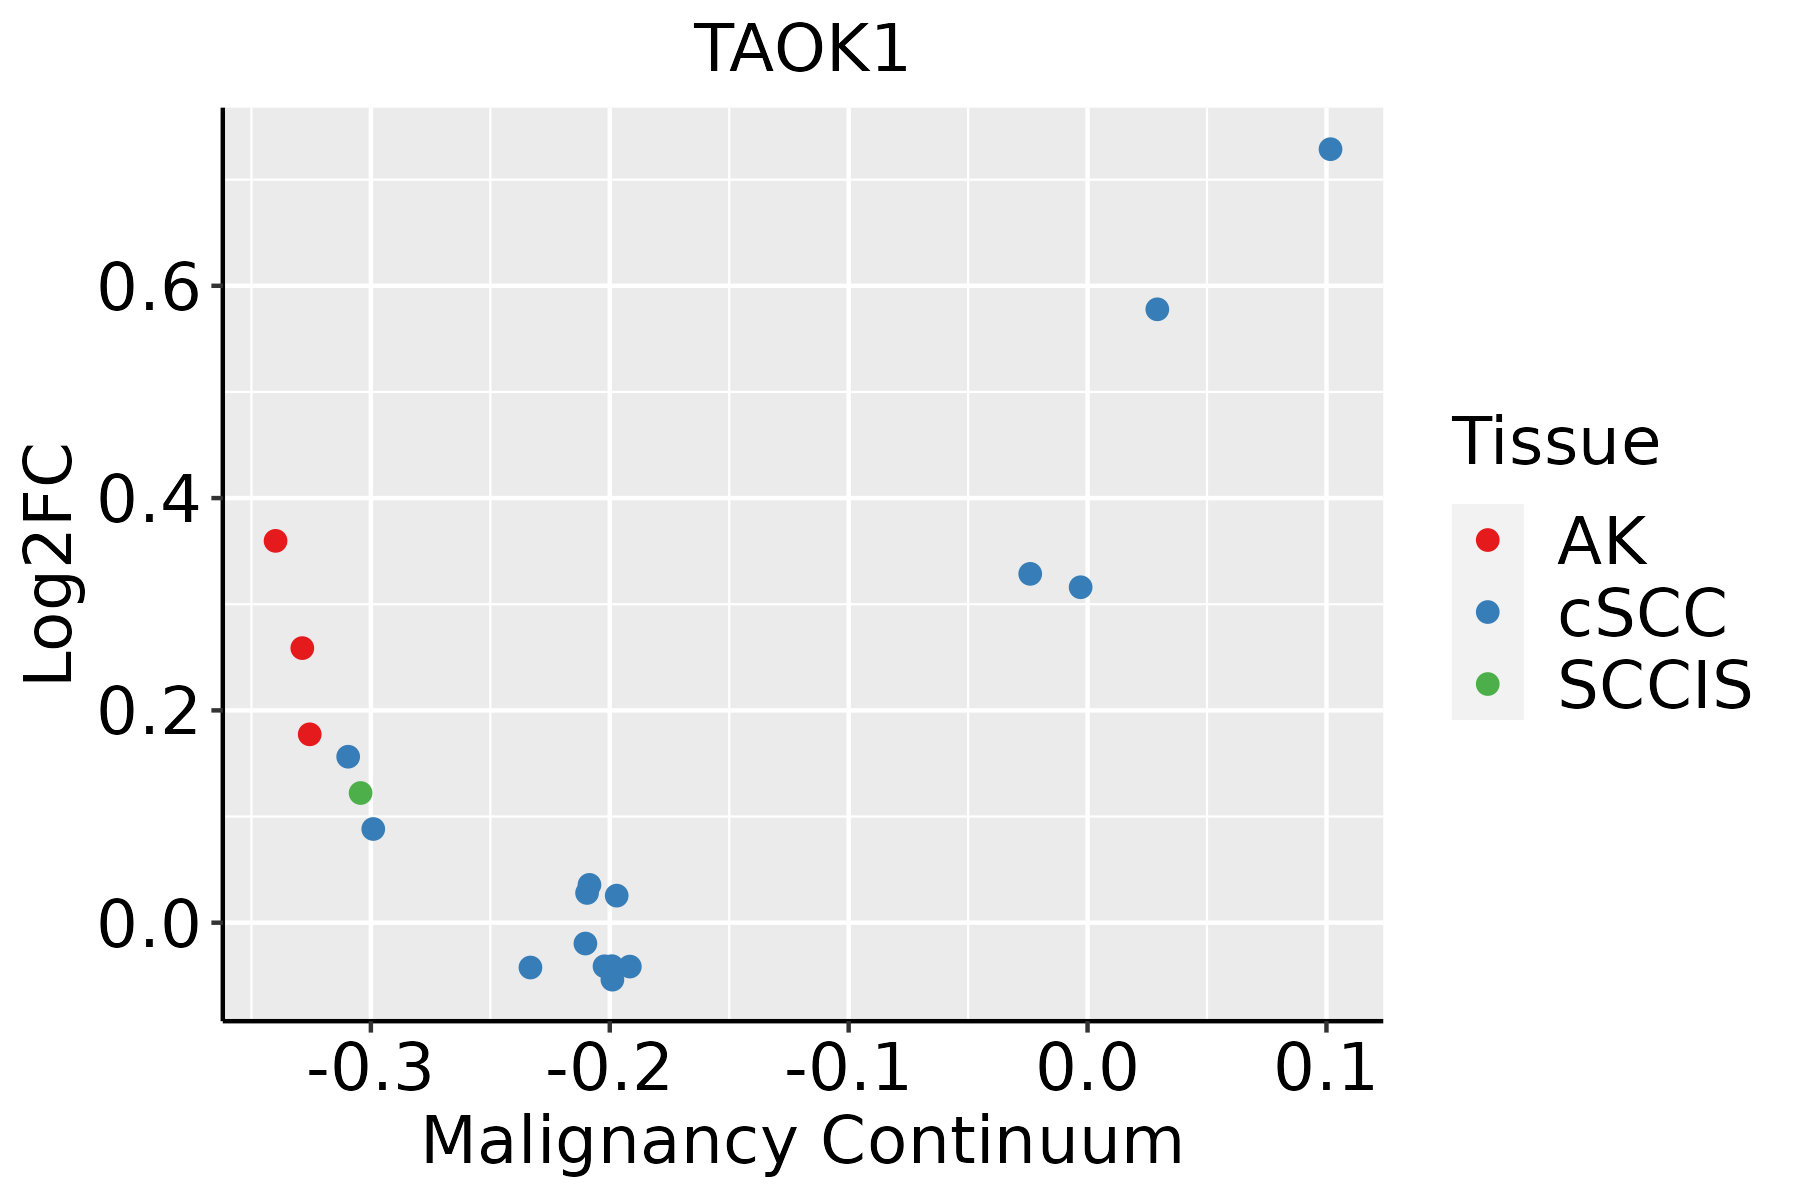 | AK: Actinic keratosis |
| cSCC: Cutaneous squamous cell carcinoma | ||
| SCCIS:squamous cell carcinoma in situ | ||
| Thyroid |  | ATC: Anaplastic thyroid cancer |
| HT: Hashimoto's thyroiditis | ||
| PTC: Papillary thyroid cancer |
| ∗log2FC in expression of this searched gene in stem-like cells from each diseased tissue sample relative to stem-like cells in normal samples in each tissue plotted against the malignancy continuum. Samples are colored based on if they are from different disease stage. |
Top |
Malignant transformation related pathway analysis |
| Find out the enriched GO biological processes and KEGG pathways involved in transition from healthy to precancer to cancer |
| Tissue | Disease Stage | Enriched GO biological Processes |
| Colorectum | AD |  |
| Colorectum | SER |  |
| Colorectum | MSS |  |
| Colorectum | MSI-H |  |
| Colorectum | FAP |  |
| ∗Top 15 enriched GO BP terms are showed in the bar plot of each disease state in each tissue. Each row represents a significant GO biological process which is colored according to the -log10(p.adjust). |
| Page: 1 2 3 4 5 6 7 8 9 |
| GO ID | Tissue | Disease Stage | Description | Gene Ratio | Bg Ratio | pvalue | p.adjust | Count |
| GO:190290412 | Liver | HCC | negative regulation of supramolecular fiber organization | 90/7958 | 167/18723 | 1.90e-03 | 9.69e-03 | 90 |
| GO:0031109 | Liver | HCC | microtubule polymerization or depolymerization | 68/7958 | 122/18723 | 2.14e-03 | 1.08e-02 | 68 |
| GO:0031110 | Liver | HCC | regulation of microtubule polymerization or depolymerization | 51/7958 | 88/18723 | 2.46e-03 | 1.19e-02 | 51 |
| GO:0000086 | Liver | HCC | G2/M transition of mitotic cell cycle | 75/7958 | 137/18723 | 2.52e-03 | 1.22e-02 | 75 |
| GO:000725412 | Liver | HCC | JNK cascade | 89/7958 | 167/18723 | 3.09e-03 | 1.44e-02 | 89 |
| GO:0044774 | Liver | HCC | mitotic DNA integrity checkpoint | 49/7958 | 85/18723 | 3.44e-03 | 1.55e-02 | 49 |
| GO:0032886 | Liver | HCC | regulation of microtubule-based process | 123/7958 | 240/18723 | 3.69e-03 | 1.64e-02 | 123 |
| GO:0044839 | Liver | HCC | cell cycle G2/M phase transition | 79/7958 | 148/18723 | 4.82e-03 | 2.03e-02 | 79 |
| GO:00432444 | Liver | HCC | regulation of protein-containing complex disassembly | 66/7958 | 121/18723 | 4.94e-03 | 2.07e-02 | 66 |
| GO:0097194 | Liver | HCC | execution phase of apoptosis | 48/7958 | 85/18723 | 6.47e-03 | 2.63e-02 | 48 |
| GO:00514946 | Liver | HCC | negative regulation of cytoskeleton organization | 84/7958 | 163/18723 | 1.22e-02 | 4.43e-02 | 84 |
| GO:1901985 | Liver | HCC | positive regulation of protein acetylation | 27/7958 | 45/18723 | 1.35e-02 | 4.80e-02 | 27 |
| GO:00436242 | Liver | HCC | cellular protein complex disassembly | 71/7958 | 136/18723 | 1.39e-02 | 4.95e-02 | 71 |
| GO:002241119 | Oral cavity | OSCC | cellular component disassembly | 283/7305 | 443/18723 | 9.57e-27 | 3.37e-24 | 283 |
| GO:00447728 | Oral cavity | OSCC | mitotic cell cycle phase transition | 255/7305 | 424/18723 | 5.29e-19 | 6.98e-17 | 255 |
| GO:00073469 | Oral cavity | OSCC | regulation of mitotic cell cycle | 266/7305 | 457/18723 | 3.87e-17 | 3.41e-15 | 266 |
| GO:00435434 | Oral cavity | OSCC | protein acylation | 149/7305 | 243/18723 | 1.33e-12 | 5.80e-11 | 149 |
| GO:19019905 | Oral cavity | OSCC | regulation of mitotic cell cycle phase transition | 173/7305 | 299/18723 | 2.49e-11 | 8.35e-10 | 173 |
| GO:003298410 | Oral cavity | OSCC | protein-containing complex disassembly | 136/7305 | 224/18723 | 3.42e-11 | 1.13e-09 | 136 |
| GO:007190010 | Oral cavity | OSCC | regulation of protein serine/threonine kinase activity | 201/7305 | 359/18723 | 3.90e-11 | 1.27e-09 | 201 |
| Page: 1 2 3 4 5 6 7 8 9 10 11 12 13 14 15 16 17 18 19 20 21 22 23 24 25 26 27 28 29 30 31 32 33 34 35 36 37 |
| Pathway ID | Tissue | Disease Stage | Description | Gene Ratio | Bg Ratio | pvalue | p.adjust | qvalue | Count |
| hsa040109 | Cervix | CC | MAPK signaling pathway | 62/1267 | 302/8465 | 4.89e-03 | 1.67e-02 | 9.86e-03 | 62 |
| hsa0401012 | Cervix | CC | MAPK signaling pathway | 62/1267 | 302/8465 | 4.89e-03 | 1.67e-02 | 9.86e-03 | 62 |
| hsa04010 | Colorectum | FAP | MAPK signaling pathway | 68/1404 | 302/8465 | 4.00e-03 | 1.67e-02 | 1.02e-02 | 68 |
| hsa040101 | Colorectum | FAP | MAPK signaling pathway | 68/1404 | 302/8465 | 4.00e-03 | 1.67e-02 | 1.02e-02 | 68 |
| hsa040102 | Colorectum | CRC | MAPK signaling pathway | 56/1091 | 302/8465 | 2.76e-03 | 1.77e-02 | 1.20e-02 | 56 |
| hsa040103 | Colorectum | CRC | MAPK signaling pathway | 56/1091 | 302/8465 | 2.76e-03 | 1.77e-02 | 1.20e-02 | 56 |
| hsa0401014 | Oral cavity | OSCC | MAPK signaling pathway | 165/3704 | 302/8465 | 7.11e-05 | 2.74e-04 | 1.40e-04 | 165 |
| hsa0401015 | Oral cavity | OSCC | MAPK signaling pathway | 165/3704 | 302/8465 | 7.11e-05 | 2.74e-04 | 1.40e-04 | 165 |
| hsa0401023 | Oral cavity | EOLP | MAPK signaling pathway | 68/1218 | 302/8465 | 7.48e-05 | 3.40e-04 | 2.01e-04 | 68 |
| hsa0401033 | Oral cavity | EOLP | MAPK signaling pathway | 68/1218 | 302/8465 | 7.48e-05 | 3.40e-04 | 2.01e-04 | 68 |
| hsa0401041 | Oral cavity | NEOLP | MAPK signaling pathway | 59/1112 | 302/8465 | 9.40e-04 | 4.67e-03 | 2.94e-03 | 59 |
| hsa0401051 | Oral cavity | NEOLP | MAPK signaling pathway | 59/1112 | 302/8465 | 9.40e-04 | 4.67e-03 | 2.94e-03 | 59 |
| hsa0401010 | Prostate | BPH | MAPK signaling pathway | 87/1718 | 302/8465 | 2.05e-04 | 1.13e-03 | 6.98e-04 | 87 |
| hsa0401013 | Prostate | BPH | MAPK signaling pathway | 87/1718 | 302/8465 | 2.05e-04 | 1.13e-03 | 6.98e-04 | 87 |
| hsa0401022 | Prostate | Tumor | MAPK signaling pathway | 87/1791 | 302/8465 | 8.46e-04 | 3.94e-03 | 2.45e-03 | 87 |
| hsa0401032 | Prostate | Tumor | MAPK signaling pathway | 87/1791 | 302/8465 | 8.46e-04 | 3.94e-03 | 2.45e-03 | 87 |
| Page: 1 |
Top |
Cell-cell communication analysis |
| Identification of potential cell-cell interactions between two cell types and their ligand-receptor pairs for different disease states |
| Ligand | Receptor | LRpair | Pathway | Tissue | Disease Stage |
| Page: 1 |
Top |
Single-cell gene regulatory network inference analysis |
| Find out the significant the regulons (TFs) and the target genes of each regulon across cell types for different disease states |
| TF | Cell Type | Tissue | Disease Stage | Target Gene | RSS | Regulon Activity |
| ∗The dot plots of a searched regulon are shown for all cell subpopulations in each disease state of each tissue based on the regulon specific score inferred using pySCENIC and by calculating the average expression. |
| Page: 1 |
Top |
Somatic mutation of malignant transformation related genes |
| Annotation of somatic variants for genes involved in malignant transformation |
| Hugo Symbol | Variant Class | Variant Classification | dbSNP RS | HGVSc | HGVSp | HGVSp Short | SWISSPROT | BIOTYPE | SIFT | PolyPhen | Tumor Sample Barcode | Tissue | Histology | Sex | Age | Stage | Therapy Types | Drugs | Outcome |
| TAOK1 | SNV | Missense_Mutation | c.1103N>G | p.Val368Gly | p.V368G | Q7L7X3 | protein_coding | deleterious(0.04) | probably_damaging(0.986) | TCGA-A2-A0YM-01 | Breast | breast invasive carcinoma | Female | >=65 | I/II | Unknown | Unknown | SD | |
| TAOK1 | SNV | Missense_Mutation | novel | c.2957C>A | p.Thr986Lys | p.T986K | Q7L7X3 | protein_coding | deleterious_low_confidence(0) | benign(0.198) | TCGA-AR-A0U0-01 | Breast | breast invasive carcinoma | Female | >=65 | I/II | Unknown | Unknown | SD |
| TAOK1 | SNV | Missense_Mutation | novel | c.2999N>C | p.Tyr1000Ser | p.Y1000S | Q7L7X3 | protein_coding | deleterious_low_confidence(0) | benign(0.021) | TCGA-B6-A0IK-01 | Breast | breast invasive carcinoma | Female | <65 | III/IV | Unknown | Unknown | PD |
| TAOK1 | SNV | Missense_Mutation | novel | c.3001N>T | p.Thr1001Ser | p.T1001S | Q7L7X3 | protein_coding | tolerated_low_confidence(0.75) | benign(0.003) | TCGA-B6-A0IK-01 | Breast | breast invasive carcinoma | Female | <65 | III/IV | Unknown | Unknown | PD |
| TAOK1 | SNV | Missense_Mutation | c.2921N>G | p.Ser974Cys | p.S974C | Q7L7X3 | protein_coding | deleterious_low_confidence(0) | possibly_damaging(0.838) | TCGA-C8-A1HM-01 | Breast | breast invasive carcinoma | Female | >=65 | I/II | Chemotherapy | doxorubicin | CR | |
| TAOK1 | SNV | Missense_Mutation | c.404N>G | p.Ala135Gly | p.A135G | Q7L7X3 | protein_coding | deleterious(0.04) | benign(0.057) | TCGA-D8-A142-01 | Breast | breast invasive carcinoma | Female | >=65 | I/II | Chemotherapy | cyclophosphamid | SD | |
| TAOK1 | SNV | Missense_Mutation | c.58T>C | p.Phe20Leu | p.F20L | Q7L7X3 | protein_coding | tolerated(0.6) | benign(0.058) | TCGA-D8-A1XK-01 | Breast | breast invasive carcinoma | Female | <65 | I/II | Chemotherapy | doxorubicine+cyclophosphamide | SD | |
| TAOK1 | SNV | Missense_Mutation | novel | c.709N>G | p.Ile237Val | p.I237V | Q7L7X3 | protein_coding | deleterious(0) | possibly_damaging(0.811) | TCGA-LL-A6FP-01 | Breast | breast invasive carcinoma | Female | >=65 | I/II | Hormone Therapy | arimidex | SD |
| TAOK1 | insertion | Nonsense_Mutation | novel | c.84_85insTGAACTTTCACACCTGGCCT | p.Thr29Ter | p.T29* | Q7L7X3 | protein_coding | TCGA-B6-A0IN-01 | Breast | breast invasive carcinoma | Female | <65 | I/II | Unknown | Unknown | PD | ||
| TAOK1 | deletion | Frame_Shift_Del | novel | c.2425delC | p.Leu809TrpfsTer4 | p.L809Wfs*4 | Q7L7X3 | protein_coding | TCGA-EW-A2FV-01 | Breast | breast invasive carcinoma | Female | <65 | III/IV | Chemotherapy | docetaxel | SD |
| Page: 1 2 3 4 5 6 7 8 9 10 |
Top |
Related drugs of malignant transformation related genes |
| Identification of chemicals and drugs interact with genes involved in malignant transfromation |
| (DGIdb 4.0) |
| Entrez ID | Symbol | Category | Interaction Types | Drug Claim Name | Drug Name | PMIDs |
| 57551 | TAOK1 | SERINE THREONINE KINASE, KINASE, DRUGGABLE GENOME, DNA REPAIR, ENZYME | PHA-767491 | CHEMBL225519 | ||
| 57551 | TAOK1 | SERINE THREONINE KINASE, KINASE, DRUGGABLE GENOME, DNA REPAIR, ENZYME | PF-562271 | PF-00562271 | ||
| 57551 | TAOK1 | SERINE THREONINE KINASE, KINASE, DRUGGABLE GENOME, DNA REPAIR, ENZYME | TAE-684 | TAE-684 | ||
| 57551 | TAOK1 | SERINE THREONINE KINASE, KINASE, DRUGGABLE GENOME, DNA REPAIR, ENZYME | ENTRECTINIB | ENTRECTINIB | ||
| 57551 | TAOK1 | SERINE THREONINE KINASE, KINASE, DRUGGABLE GENOME, DNA REPAIR, ENZYME | LY-2090314 | LY-2090314 | ||
| 57551 | TAOK1 | SERINE THREONINE KINASE, KINASE, DRUGGABLE GENOME, DNA REPAIR, ENZYME | CENISERTIB | CENISERTIB | ||
| 57551 | TAOK1 | SERINE THREONINE KINASE, KINASE, DRUGGABLE GENOME, DNA REPAIR, ENZYME | DNDI1417467 | CHEMBL1997335 | ||
| 57551 | TAOK1 | SERINE THREONINE KINASE, KINASE, DRUGGABLE GENOME, DNA REPAIR, ENZYME | BMS-387032 | BMS-387032 | ||
| 57551 | TAOK1 | SERINE THREONINE KINASE, KINASE, DRUGGABLE GENOME, DNA REPAIR, ENZYME | LINIFANIB | LINIFANIB | ||
| 57551 | TAOK1 | SERINE THREONINE KINASE, KINASE, DRUGGABLE GENOME, DNA REPAIR, ENZYME | BMS-345541 | BMS-345541 |
| Page: 1 2 3 4 |

Copyright 2023-Present -The University of Texas Health Science Center at Houston |