| Tissue | Expression Dynamics | Abbreviation |
| Cervix |  | CC: Cervix cancer |
| HSIL_HPV: HPV-infected high-grade squamous intraepithelial lesions |
| N_HPV: HPV-infected normal cervix |
| Colorectum (GSE201348) |  | FAP: Familial adenomatous polyposis |
| CRC: Colorectal cancer |
| Colorectum (HTA11) |  | AD: Adenomas |
| SER: Sessile serrated lesions |
| MSI-H: Microsatellite-high colorectal cancer |
| MSS: Microsatellite stable colorectal cancer |
| Endometrium | 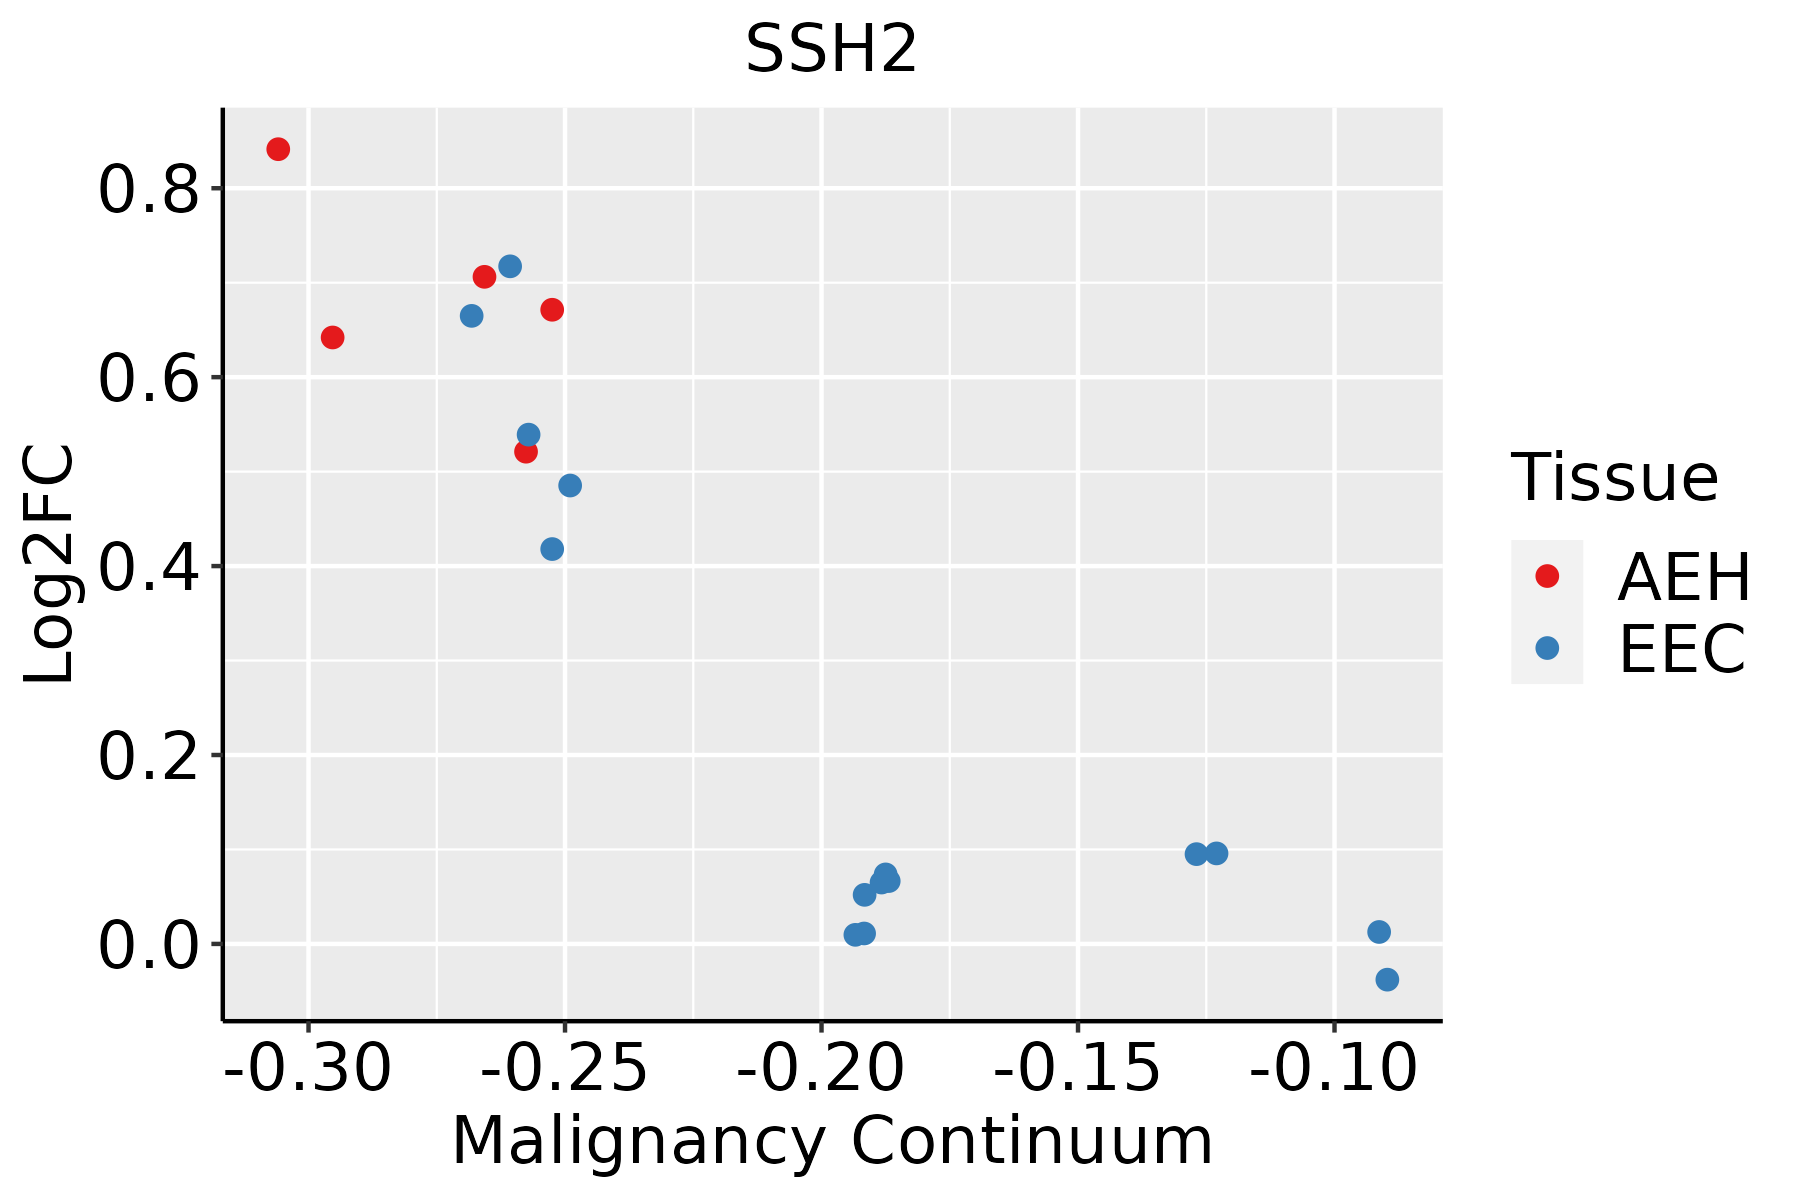 | AEH: Atypical endometrial hyperplasia |
| EEC: Endometrioid Cancer |
| Esophagus | 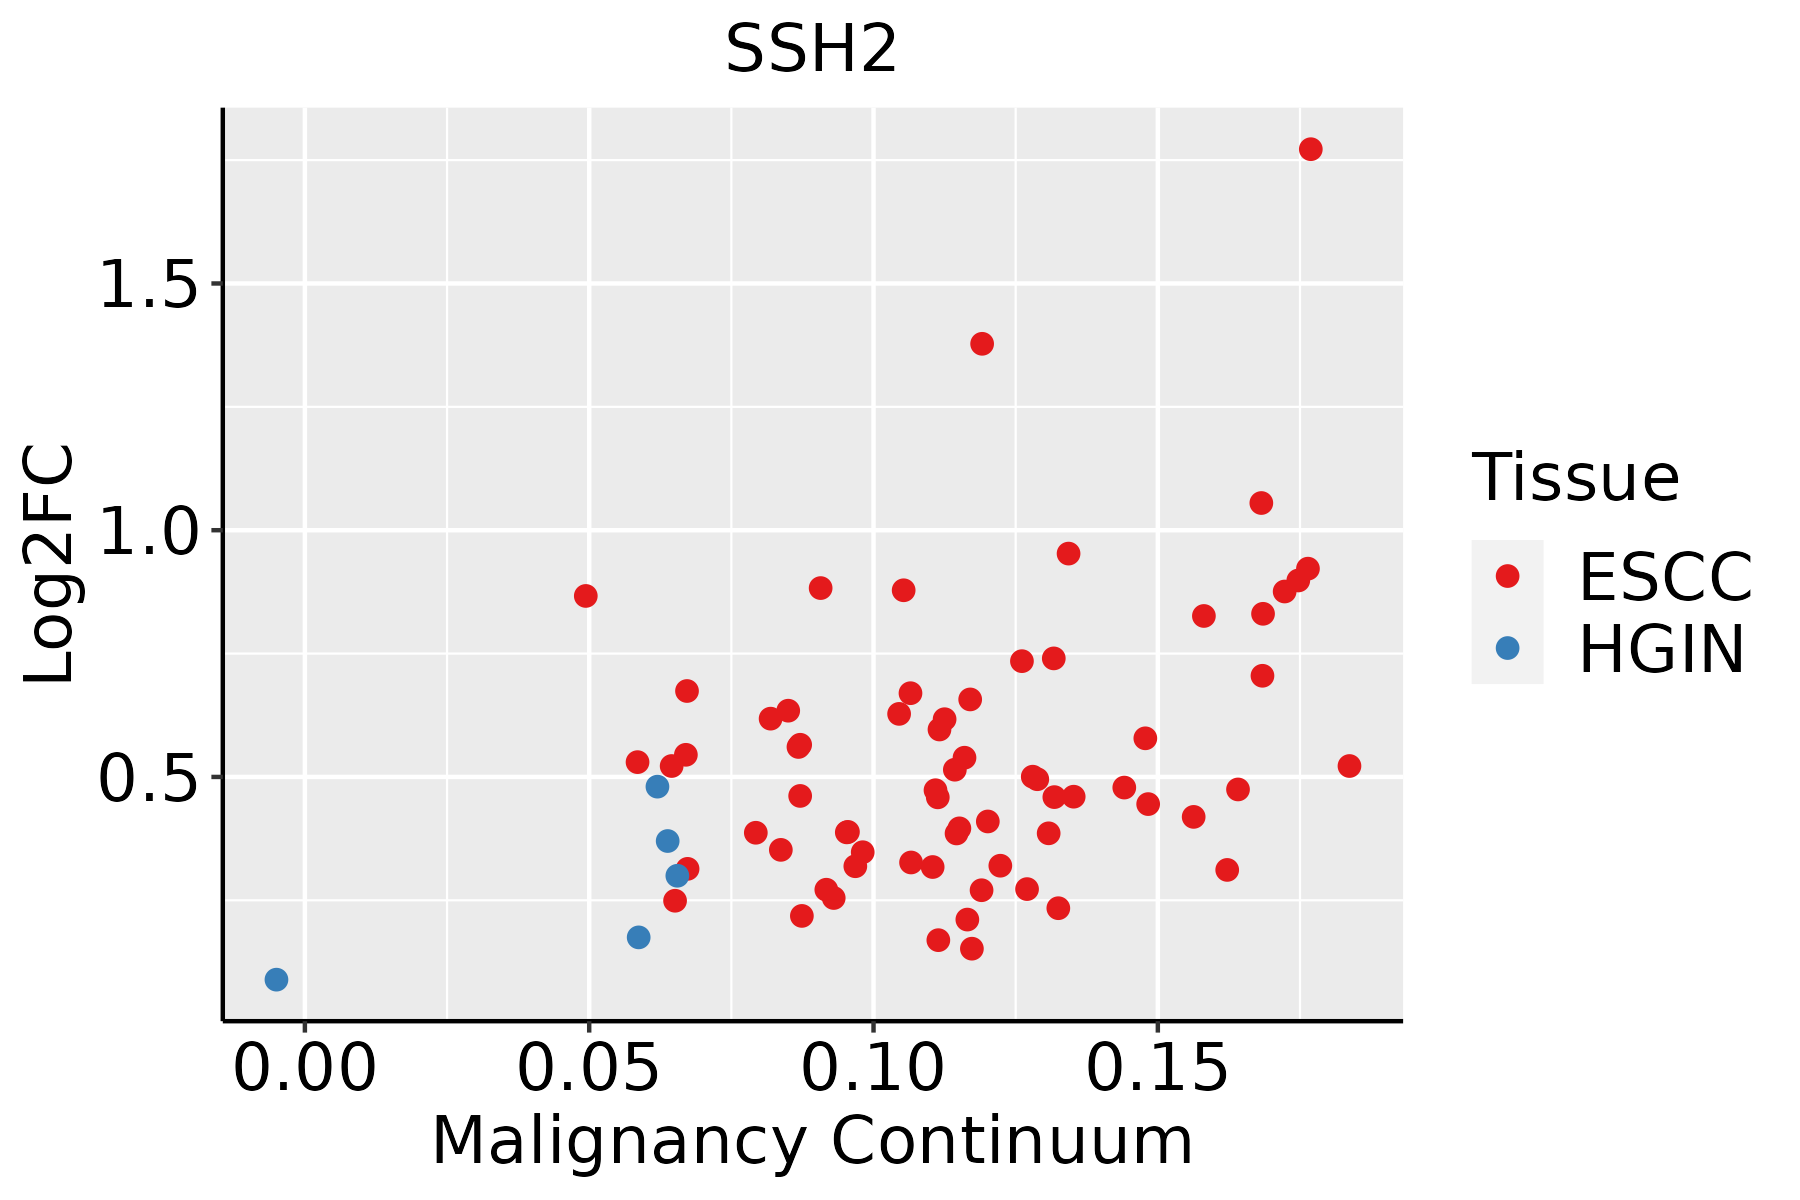 | ESCC: Esophageal squamous cell carcinoma |
| HGIN: High-grade intraepithelial neoplasias |
| LGIN: Low-grade intraepithelial neoplasias |
| GC | 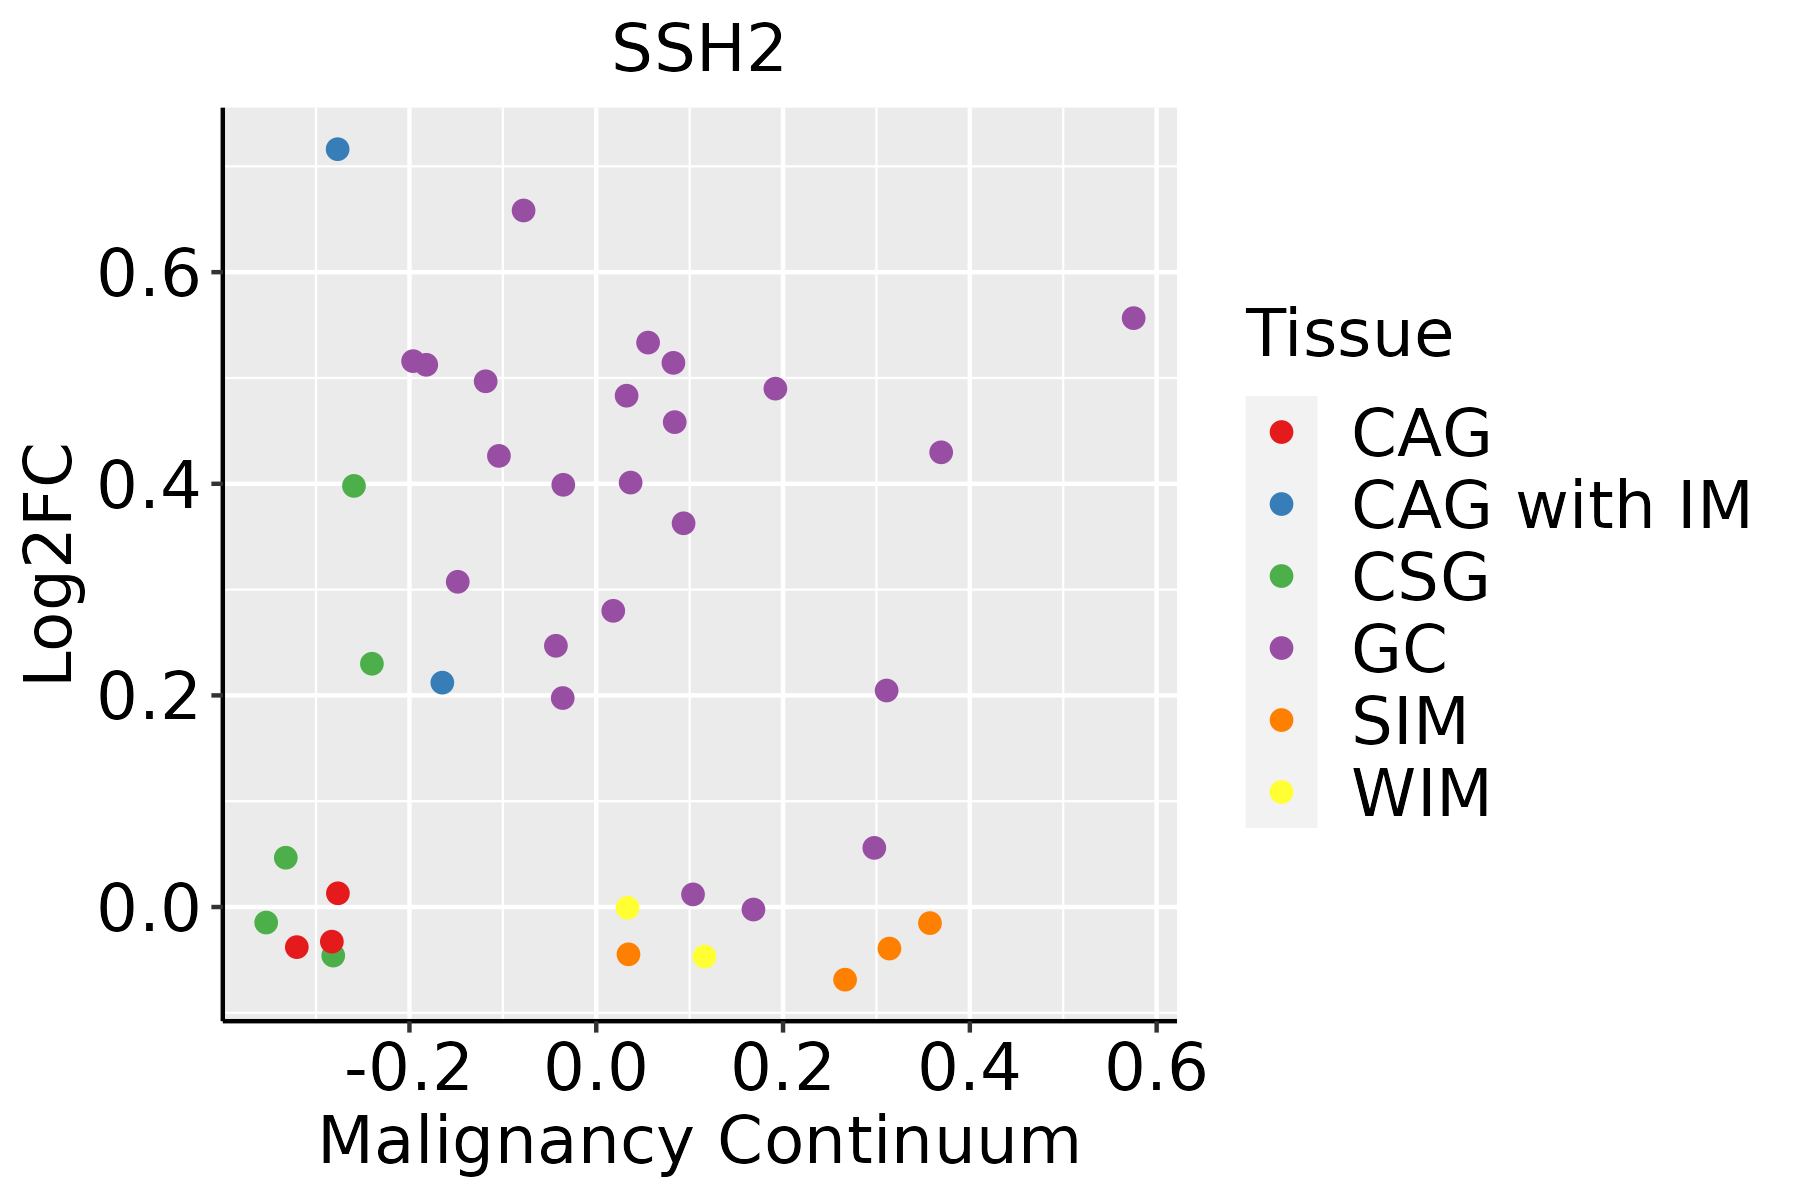 | CAG: Chronic atrophic gastritis |
| CAG with IM: Chronic atrophic gastritis with intestinal metaplasia |
| CSG: Chronic superficial gastritis |
| GC: Gastric cancer |
| SIM: Severe intestinal metaplasia |
| WIM: Wild intestinal metaplasia |
| Liver | 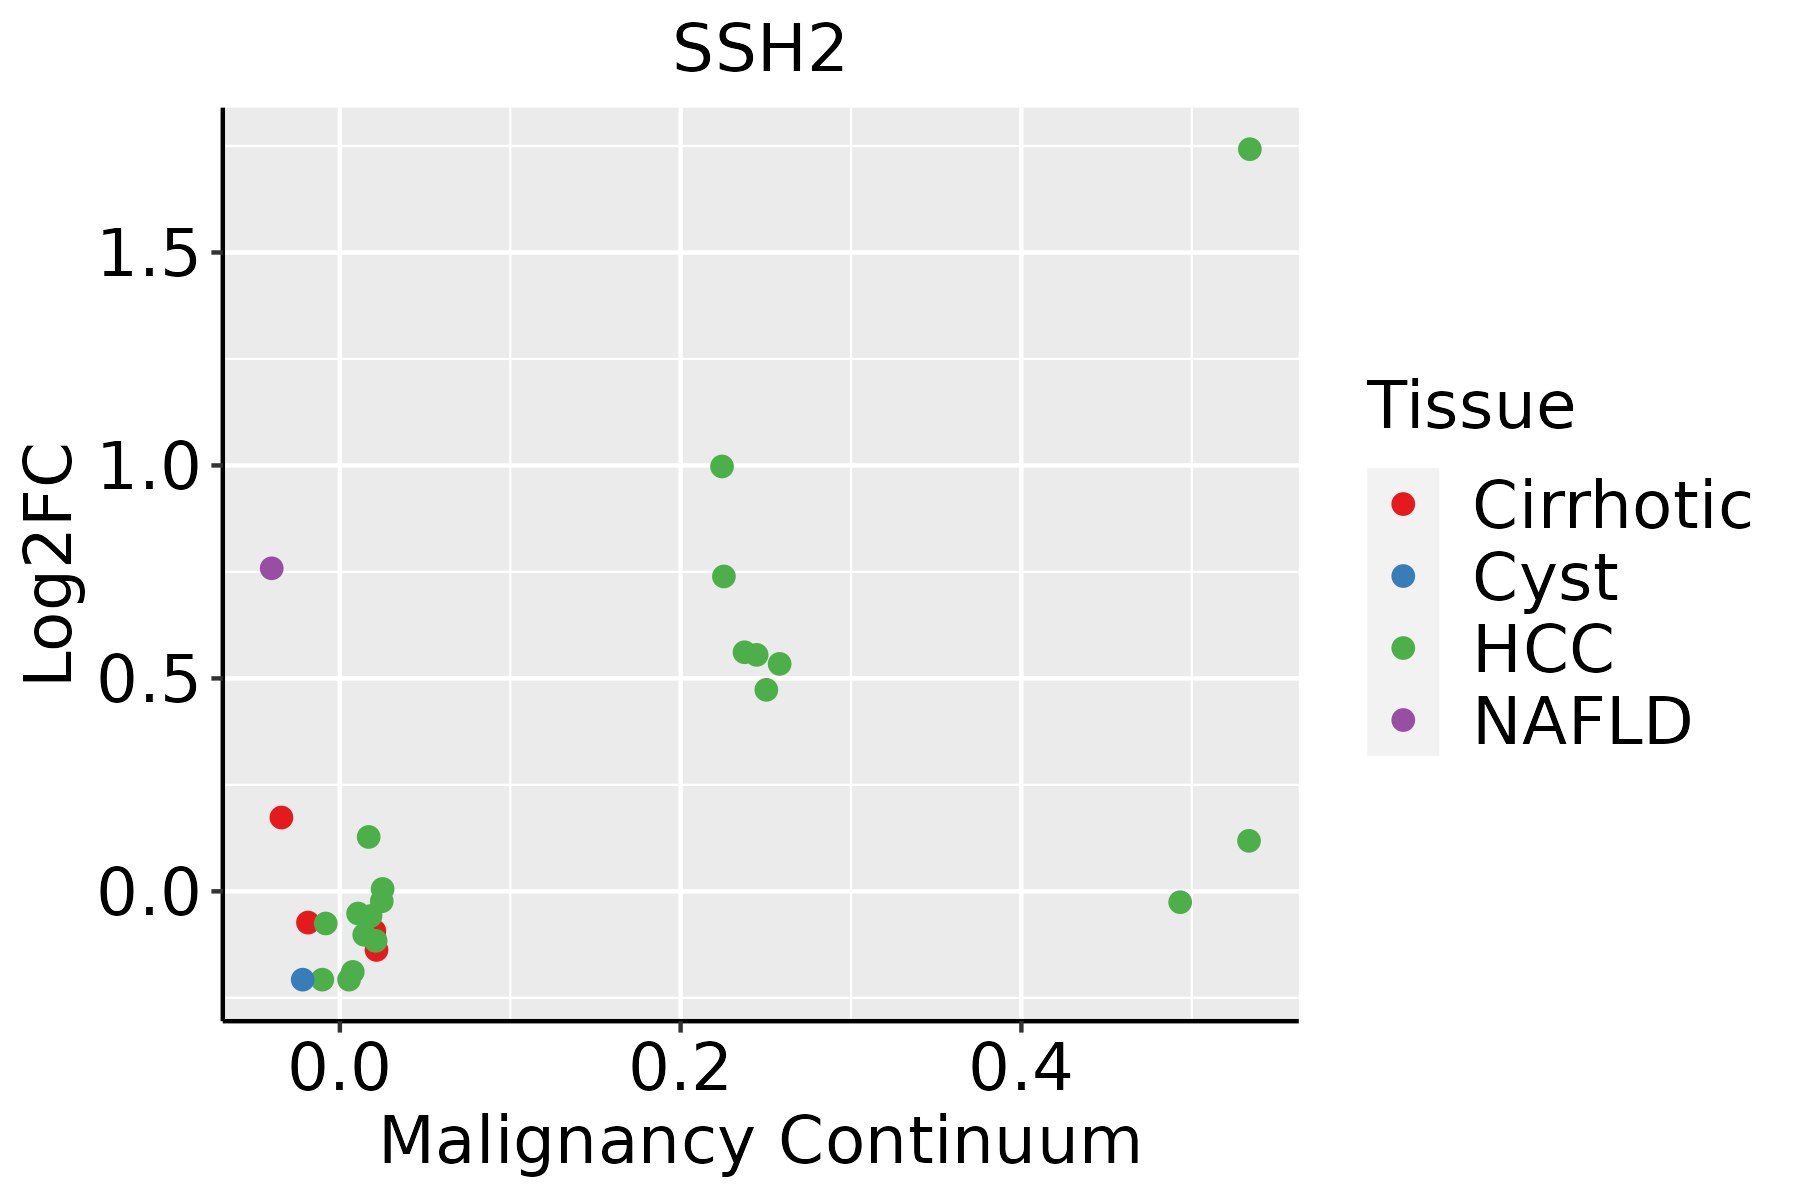 | HCC: Hepatocellular carcinoma |
| NAFLD: Non-alcoholic fatty liver disease |
| Lung | 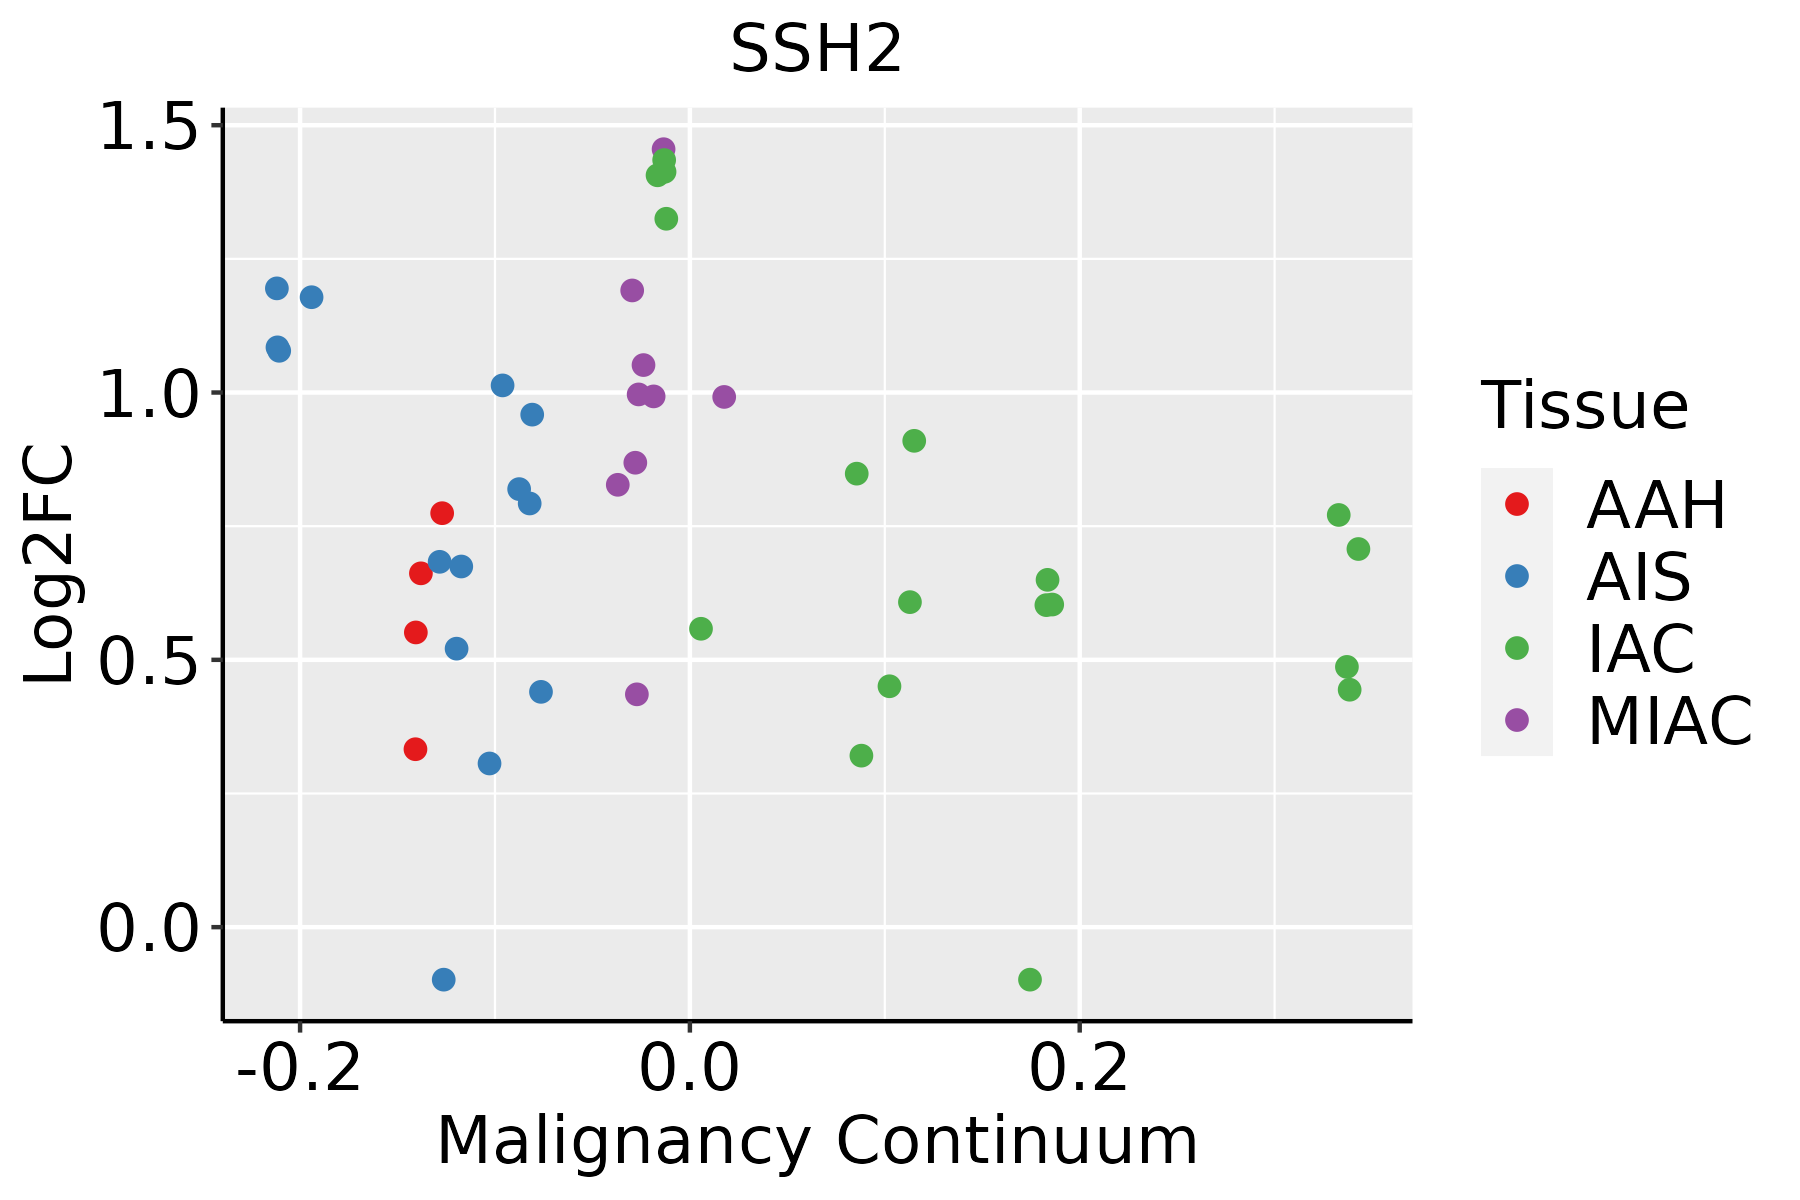 | AAH: Atypical adenomatous hyperplasia |
| AIS: Adenocarcinoma in situ |
| IAC: Invasive lung adenocarcinoma |
| MIA: Minimally invasive adenocarcinoma |
| Oral Cavity |  | EOLP: Erosive Oral lichen planus |
| LP: leukoplakia |
| NEOLP: Non-erosive oral lichen planus |
| OSCC: Oral squamous cell carcinoma |
| Prostate | 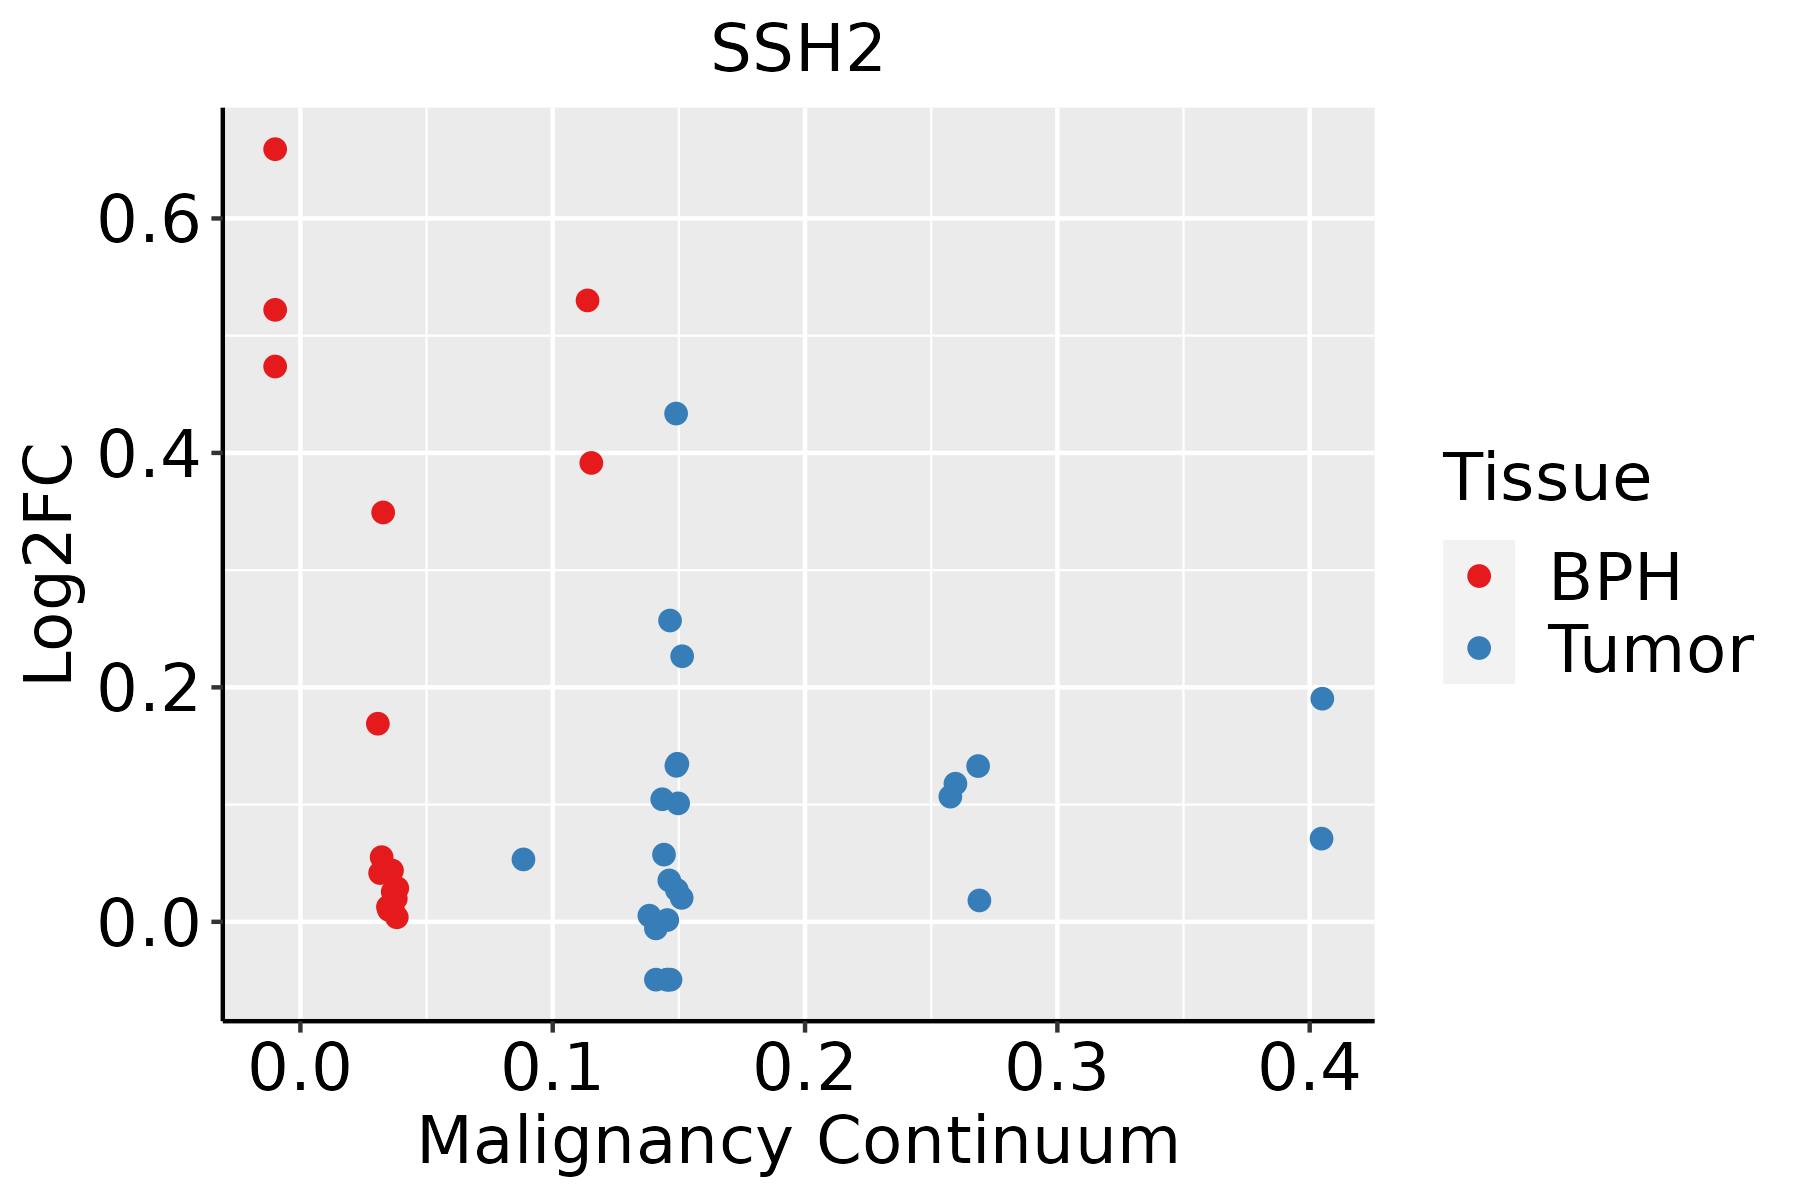 | BPH: Benign Prostatic Hyperplasia |
| Skin | 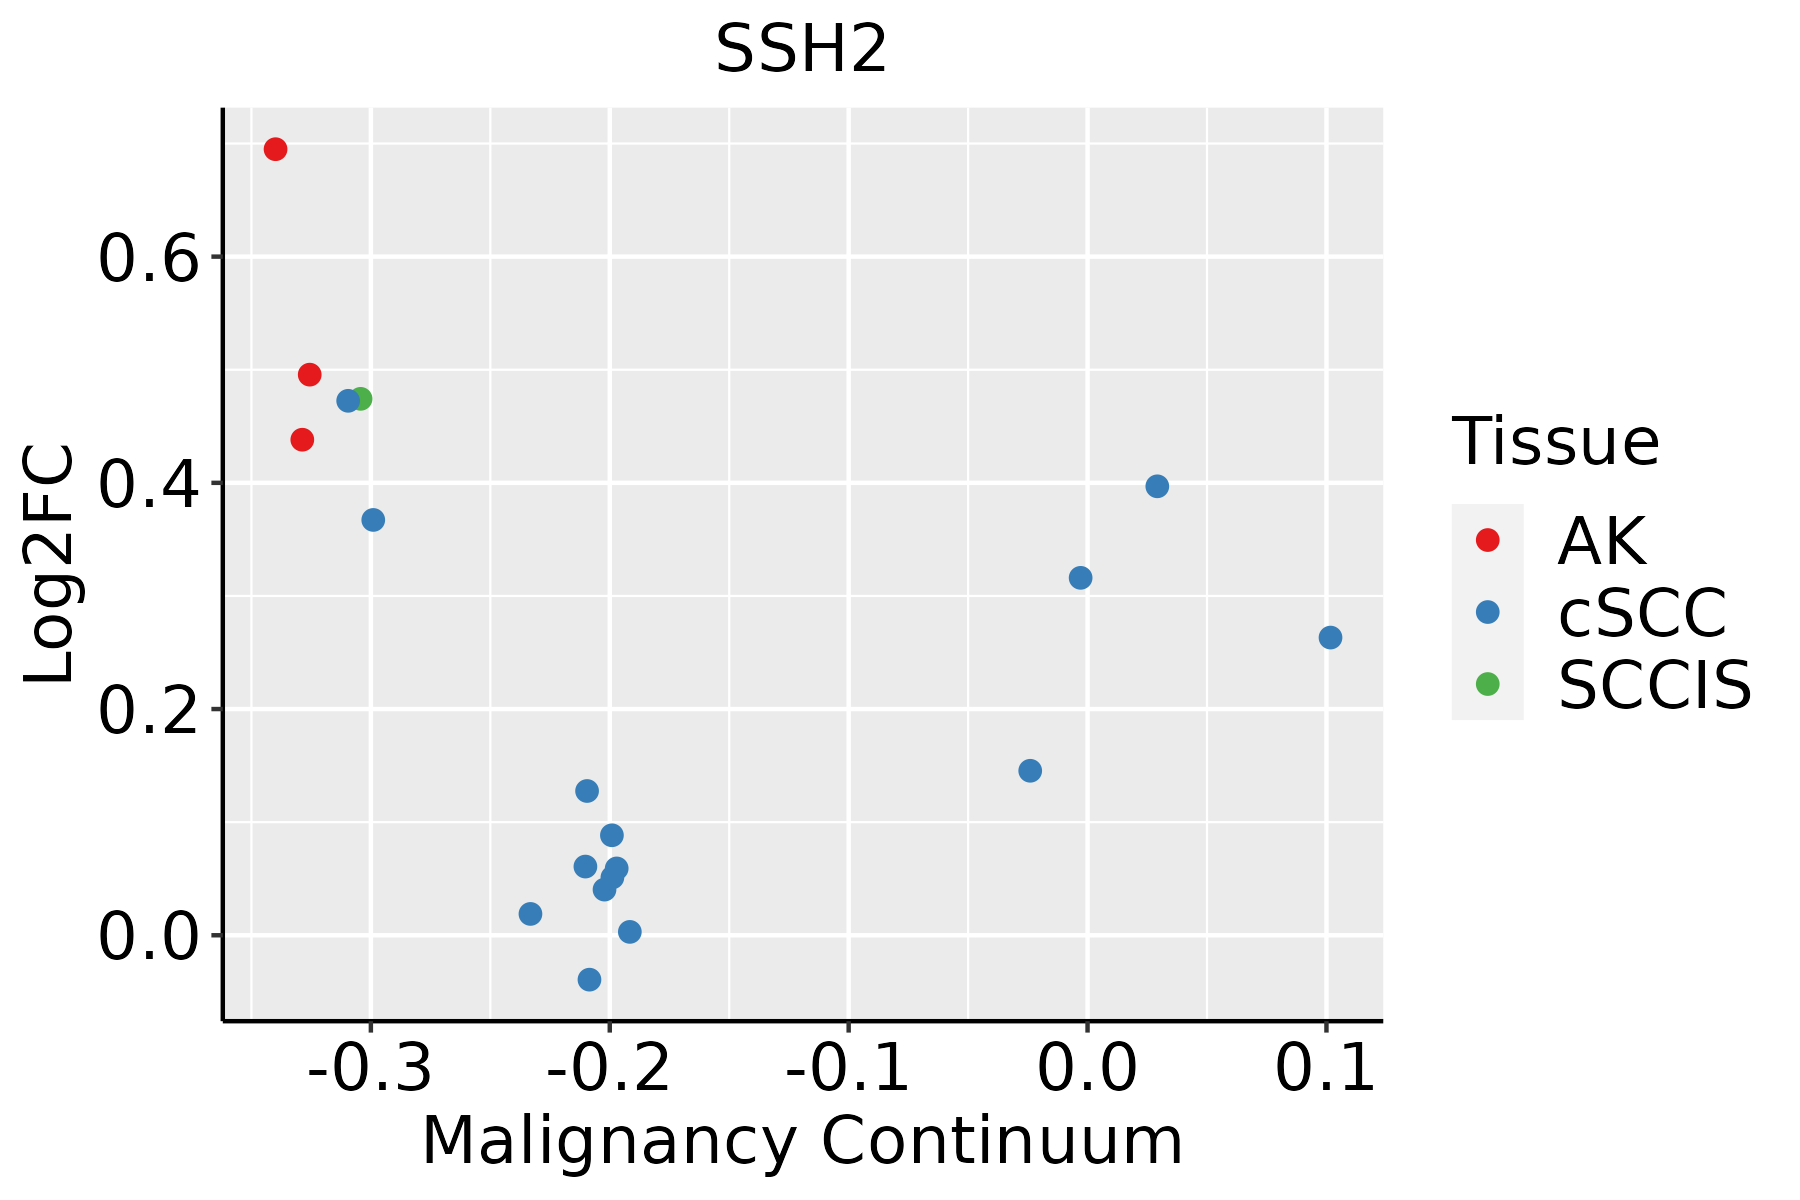 | AK: Actinic keratosis |
| cSCC: Cutaneous squamous cell carcinoma |
| SCCIS:squamous cell carcinoma in situ |
| GO ID | Tissue | Disease Stage | Description | Gene Ratio | Bg Ratio | pvalue | p.adjust | Count |
| GO:000647022 | Lung | AAH | protein dephosphorylation | 21/613 | 281/18723 | 4.01e-04 | 1.78e-02 | 21 |
| GO:011005323 | Lung | AAH | regulation of actin filament organization | 20/613 | 278/18723 | 8.79e-04 | 2.88e-02 | 20 |
| GO:005149422 | Lung | AAH | negative regulation of cytoskeleton organization | 14/613 | 163/18723 | 9.62e-04 | 2.94e-02 | 14 |
| GO:00353352 | Lung | AAH | peptidyl-tyrosine dephosphorylation | 10/613 | 97/18723 | 1.28e-03 | 3.52e-02 | 10 |
| GO:003083313 | Lung | AAH | regulation of actin filament polymerization | 14/613 | 172/18723 | 1.61e-03 | 3.96e-02 | 14 |
| GO:003227123 | Lung | AAH | regulation of protein polymerization | 17/613 | 233/18723 | 1.79e-03 | 4.22e-02 | 17 |
| GO:000815423 | Lung | AAH | actin polymerization or depolymerization | 16/613 | 218/18723 | 2.27e-03 | 4.84e-02 | 16 |
| GO:000701533 | Lung | MIAC | actin filament organization | 50/967 | 442/18723 | 1.64e-07 | 3.81e-05 | 50 |
| GO:005125823 | Lung | MIAC | protein polymerization | 35/967 | 297/18723 | 4.69e-06 | 4.81e-04 | 35 |
| GO:190290333 | Lung | MIAC | regulation of supramolecular fiber organization | 41/967 | 383/18723 | 8.33e-06 | 7.24e-04 | 41 |
| GO:003227132 | Lung | MIAC | regulation of protein polymerization | 29/967 | 233/18723 | 1.06e-05 | 8.86e-04 | 29 |
| GO:004325423 | Lung | MIAC | regulation of protein-containing complex assembly | 44/967 | 428/18723 | 1.11e-05 | 9.00e-04 | 44 |
| GO:011005332 | Lung | MIAC | regulation of actin filament organization | 32/967 | 278/18723 | 1.91e-05 | 1.27e-03 | 32 |
| GO:003297032 | Lung | MIAC | regulation of actin filament-based process | 41/967 | 397/18723 | 1.96e-05 | 1.28e-03 | 41 |
| GO:003295632 | Lung | MIAC | regulation of actin cytoskeleton organization | 37/967 | 358/18723 | 4.85e-05 | 2.49e-03 | 37 |
| GO:001063922 | Lung | MIAC | negative regulation of organelle organization | 36/967 | 348/18723 | 5.99e-05 | 2.98e-03 | 36 |
| GO:005149431 | Lung | MIAC | negative regulation of cytoskeleton organization | 21/967 | 163/18723 | 1.03e-04 | 4.44e-03 | 21 |
| GO:190290432 | Lung | MIAC | negative regulation of supramolecular fiber organization | 19/967 | 167/18723 | 1.03e-03 | 2.10e-02 | 19 |
| GO:000647031 | Lung | MIAC | protein dephosphorylation | 27/967 | 281/18723 | 1.47e-03 | 2.55e-02 | 27 |
| GO:003083323 | Lung | MIAC | regulation of actin filament polymerization | 19/967 | 172/18723 | 1.47e-03 | 2.55e-02 | 19 |
| Pathway ID | Tissue | Disease Stage | Description | Gene Ratio | Bg Ratio | pvalue | p.adjust | qvalue | Count |
| hsa0481016 | Cervix | CC | Regulation of actin cytoskeleton | 64/1267 | 229/8465 | 2.24e-07 | 2.59e-06 | 1.53e-06 | 64 |
| hsa043609 | Cervix | CC | Axon guidance | 47/1267 | 182/8465 | 8.13e-05 | 5.38e-04 | 3.18e-04 | 47 |
| hsa0481017 | Cervix | CC | Regulation of actin cytoskeleton | 64/1267 | 229/8465 | 2.24e-07 | 2.59e-06 | 1.53e-06 | 64 |
| hsa0436012 | Cervix | CC | Axon guidance | 47/1267 | 182/8465 | 8.13e-05 | 5.38e-04 | 3.18e-04 | 47 |
| hsa04810 | Colorectum | AD | Regulation of actin cytoskeleton | 75/2092 | 229/8465 | 3.36e-03 | 1.76e-02 | 1.12e-02 | 75 |
| hsa04360 | Colorectum | AD | Axon guidance | 61/2092 | 182/8465 | 4.36e-03 | 2.17e-02 | 1.38e-02 | 61 |
| hsa048101 | Colorectum | AD | Regulation of actin cytoskeleton | 75/2092 | 229/8465 | 3.36e-03 | 1.76e-02 | 1.12e-02 | 75 |
| hsa043601 | Colorectum | AD | Axon guidance | 61/2092 | 182/8465 | 4.36e-03 | 2.17e-02 | 1.38e-02 | 61 |
| hsa048102 | Colorectum | SER | Regulation of actin cytoskeleton | 60/1580 | 229/8465 | 2.74e-03 | 2.02e-02 | 1.47e-02 | 60 |
| hsa048103 | Colorectum | SER | Regulation of actin cytoskeleton | 60/1580 | 229/8465 | 2.74e-03 | 2.02e-02 | 1.47e-02 | 60 |
| hsa048104 | Colorectum | MSS | Regulation of actin cytoskeleton | 68/1875 | 229/8465 | 4.27e-03 | 1.86e-02 | 1.14e-02 | 68 |
| hsa043602 | Colorectum | MSS | Axon guidance | 54/1875 | 182/8465 | 1.03e-02 | 3.69e-02 | 2.26e-02 | 54 |
| hsa048105 | Colorectum | MSS | Regulation of actin cytoskeleton | 68/1875 | 229/8465 | 4.27e-03 | 1.86e-02 | 1.14e-02 | 68 |
| hsa043603 | Colorectum | MSS | Axon guidance | 54/1875 | 182/8465 | 1.03e-02 | 3.69e-02 | 2.26e-02 | 54 |
| hsa048106 | Colorectum | FAP | Regulation of actin cytoskeleton | 65/1404 | 229/8465 | 4.07e-06 | 5.91e-05 | 3.59e-05 | 65 |
| hsa043604 | Colorectum | FAP | Axon guidance | 47/1404 | 182/8465 | 9.09e-04 | 5.20e-03 | 3.16e-03 | 47 |
| hsa048107 | Colorectum | FAP | Regulation of actin cytoskeleton | 65/1404 | 229/8465 | 4.07e-06 | 5.91e-05 | 3.59e-05 | 65 |
| hsa043605 | Colorectum | FAP | Axon guidance | 47/1404 | 182/8465 | 9.09e-04 | 5.20e-03 | 3.16e-03 | 47 |
| hsa048108 | Colorectum | CRC | Regulation of actin cytoskeleton | 52/1091 | 229/8465 | 2.34e-05 | 5.57e-04 | 3.78e-04 | 52 |
| hsa043606 | Colorectum | CRC | Axon guidance | 43/1091 | 182/8465 | 4.38e-05 | 8.70e-04 | 5.90e-04 | 43 |
| Hugo Symbol | Variant Class | Variant Classification | dbSNP RS | HGVSc | HGVSp | HGVSp Short | SWISSPROT | BIOTYPE | SIFT | PolyPhen | Tumor Sample Barcode | Tissue | Histology | Sex | Age | Stage | Therapy Types | Drugs | Outcome |
| SSH2 | SNV | Missense_Mutation | novel | c.4126N>A | p.Glu1376Lys | p.E1376K | | protein_coding | deleterious_low_confidence(0) | possibly_damaging(0.737) | TCGA-5L-AAT1-01 | Breast | breast invasive carcinoma | Female | <65 | III/IV | Hormone Therapy | letrozol | SD |
| SSH2 | SNV | Missense_Mutation | novel | c.343N>T | p.Asp115Tyr | p.D115Y | | protein_coding | deleterious(0) | probably_damaging(0.997) | TCGA-A2-A4S1-01 | Breast | breast invasive carcinoma | Female | >=65 | I/II | Unknown | Unknown | SD |
| SSH2 | SNV | Missense_Mutation | | c.3790N>C | p.Glu1264Gln | p.E1264Q | | protein_coding | deleterious(0.01) | possibly_damaging(0.801) | TCGA-AN-A0XW-01 | Breast | breast invasive carcinoma | Female | <65 | III/IV | Unknown | Unknown | SD |
| SSH2 | SNV | Missense_Mutation | | c.2452N>C | p.Glu818Gln | p.E818Q | | protein_coding | deleterious_low_confidence(0) | probably_damaging(0.997) | TCGA-AO-A03V-01 | Breast | breast invasive carcinoma | Female | <65 | I/II | Chemotherapy | fluorouracil | SD |
| SSH2 | SNV | Missense_Mutation | | c.3183G>C | p.Glu1061Asp | p.E1061D | | protein_coding | tolerated_low_confidence(0.54) | benign(0.074) | TCGA-C8-A275-01 | Breast | breast invasive carcinoma | Female | <65 | I/II | Unknown | Unknown | SD |
| SSH2 | SNV | Missense_Mutation | novel | c.989N>A | p.Gly330Asp | p.G330D | | protein_coding | deleterious(0) | probably_damaging(0.997) | TCGA-E9-A3Q9-01 | Breast | breast invasive carcinoma | Female | >=65 | III/IV | Chemotherapy | cyclophosphane | CR |
| SSH2 | insertion | Frame_Shift_Ins | novel | c.3966_3967insTTTTACTGTTTCT | p.Asp1323PhefsTer5 | p.D1323Ffs*5 | | protein_coding | | | TCGA-A8-A0A4-01 | Breast | breast invasive carcinoma | Female | >=65 | I/II | Hormone Therapy | tamoxiphen | CR |
| SSH2 | insertion | In_Frame_Ins | novel | c.3964_3965insTATTTTGGT | p.Thr1322delinsIlePheTrpSer | p.T1322delinsIFWS | | protein_coding | | | TCGA-A8-A0A4-01 | Breast | breast invasive carcinoma | Female | >=65 | I/II | Hormone Therapy | tamoxiphen | CR |
| SSH2 | insertion | Frame_Shift_Ins | novel | c.2813_2814insGGAGGCCTTCCCGTGCTACAGACCCAGGGACTGCAGTGTGCATG | p.Gly939GlufsTer34 | p.G939Efs*34 | | protein_coding | | | TCGA-B6-A0I5-01 | Breast | breast invasive carcinoma | Female | <65 | I/II | Unknown | Unknown | SD |
| SSH2 | deletion | Frame_Shift_Del | novel | c.1929delG | p.Thr644HisfsTer4 | p.T644Hfs*4 | | protein_coding | | | TCGA-EW-A2FV-01 | Breast | breast invasive carcinoma | Female | <65 | III/IV | Chemotherapy | docetaxel | SD |


