
|
|||||
|
 | |
| |
| |
| |
| |
| |
|
Gene: SRSF9 |
Gene summary for SRSF9 |
| Gene information | Species | Human | Gene symbol | SRSF9 | Gene ID | 8683 |
| Gene name | serine and arginine rich splicing factor 9 | |
| Gene Alias | SFRS9 | |
| Cytomap | 12q24.31 | |
| Gene Type | protein-coding | GO ID | GO:0000245 | UniProtAcc | Q13242 |
Top |
Malignant transformation analysis |
| Identification of the aberrant gene expression in precancerous and cancerous lesions by comparing the gene expression of stem-like cells in diseased tissues with normal stem cells |
| Entrez ID | Symbol | Replicates | Species | Organ | Tissue | Adj P-value | Log2FC | Malignancy |
| 8683 | SRSF9 | GSM4909281 | Human | Breast | IDC | 2.81e-22 | 5.94e-01 | 0.21 |
| 8683 | SRSF9 | GSM4909286 | Human | Breast | IDC | 2.32e-26 | 5.74e-01 | 0.1081 |
| 8683 | SRSF9 | GSM4909287 | Human | Breast | IDC | 3.21e-02 | -2.26e-01 | 0.2057 |
| 8683 | SRSF9 | GSM4909290 | Human | Breast | IDC | 1.71e-13 | 5.23e-01 | 0.2096 |
| 8683 | SRSF9 | GSM4909294 | Human | Breast | IDC | 1.32e-08 | 1.53e-01 | 0.2022 |
| 8683 | SRSF9 | GSM4909296 | Human | Breast | IDC | 1.86e-22 | -4.68e-01 | 0.1524 |
| 8683 | SRSF9 | GSM4909297 | Human | Breast | IDC | 4.52e-23 | 4.88e-03 | 0.1517 |
| 8683 | SRSF9 | GSM4909298 | Human | Breast | IDC | 3.70e-10 | 4.69e-01 | 0.1551 |
| 8683 | SRSF9 | GSM4909308 | Human | Breast | IDC | 2.54e-02 | 2.98e-01 | 0.158 |
| 8683 | SRSF9 | GSM4909309 | Human | Breast | IDC | 2.52e-05 | 1.10e-01 | 0.0483 |
| 8683 | SRSF9 | GSM4909311 | Human | Breast | IDC | 5.27e-42 | -3.86e-01 | 0.1534 |
| 8683 | SRSF9 | GSM4909312 | Human | Breast | IDC | 5.23e-11 | -1.20e-01 | 0.1552 |
| 8683 | SRSF9 | GSM4909313 | Human | Breast | IDC | 5.94e-04 | 3.80e-02 | 0.0391 |
| 8683 | SRSF9 | GSM4909315 | Human | Breast | IDC | 5.26e-07 | 3.07e-01 | 0.21 |
| 8683 | SRSF9 | GSM4909316 | Human | Breast | IDC | 3.26e-07 | 2.81e-01 | 0.21 |
| 8683 | SRSF9 | GSM4909318 | Human | Breast | IDC | 1.08e-04 | 3.83e-01 | 0.2031 |
| 8683 | SRSF9 | GSM4909319 | Human | Breast | IDC | 7.11e-56 | -1.68e-01 | 0.1563 |
| 8683 | SRSF9 | GSM4909320 | Human | Breast | IDC | 2.47e-07 | -2.75e-01 | 0.1575 |
| 8683 | SRSF9 | GSM4909321 | Human | Breast | IDC | 2.04e-23 | 2.71e-01 | 0.1559 |
| 8683 | SRSF9 | brca1 | Human | Breast | Precancer | 1.33e-23 | 6.21e-01 | -0.0338 |
| Page: 1 2 3 4 5 6 7 8 9 10 11 12 |
| Tissue | Expression Dynamics | Abbreviation |
| Breast | 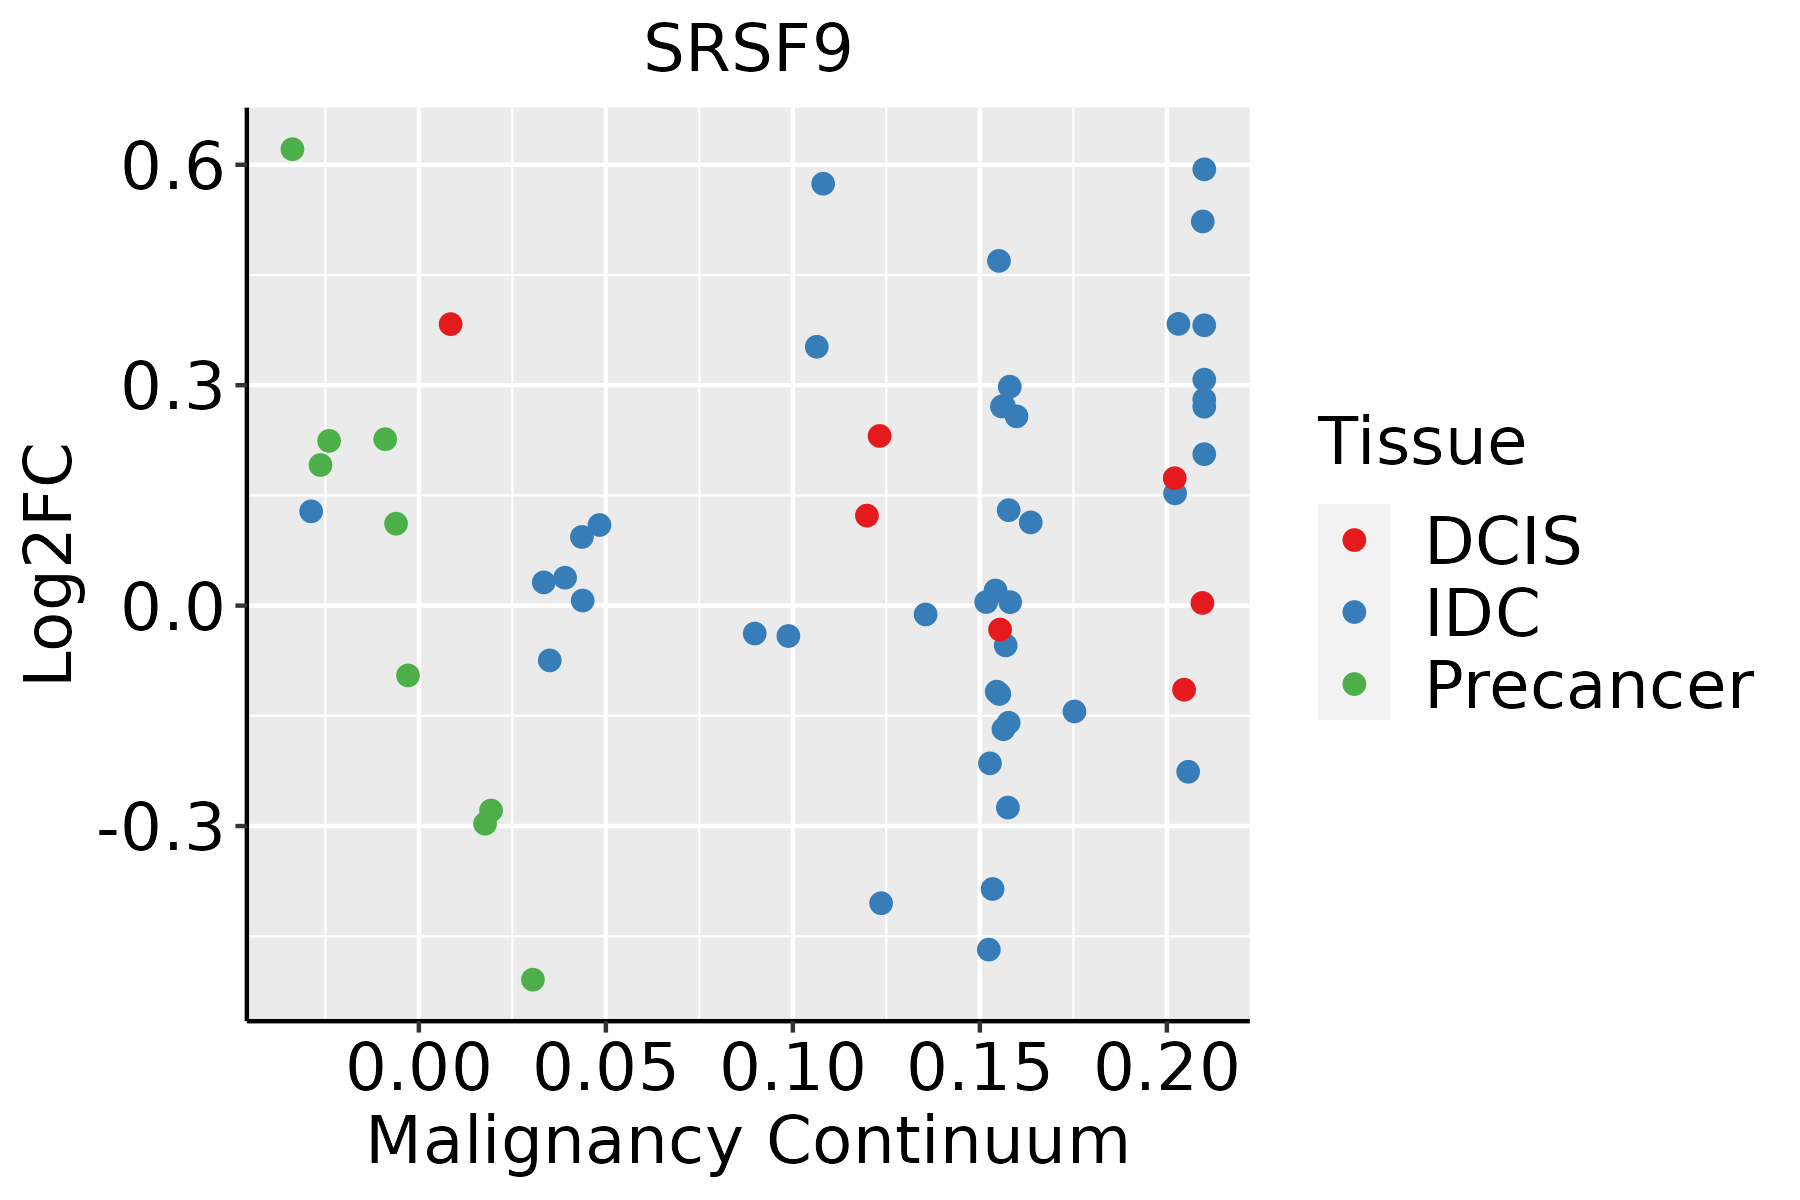 | IDC: Invasive ductal carcinoma |
| DCIS: Ductal carcinoma in situ | ||
| Precancer(BRCA1-mut): Precancerous lesion from BRCA1 mutation carriers | ||
| Cervix | 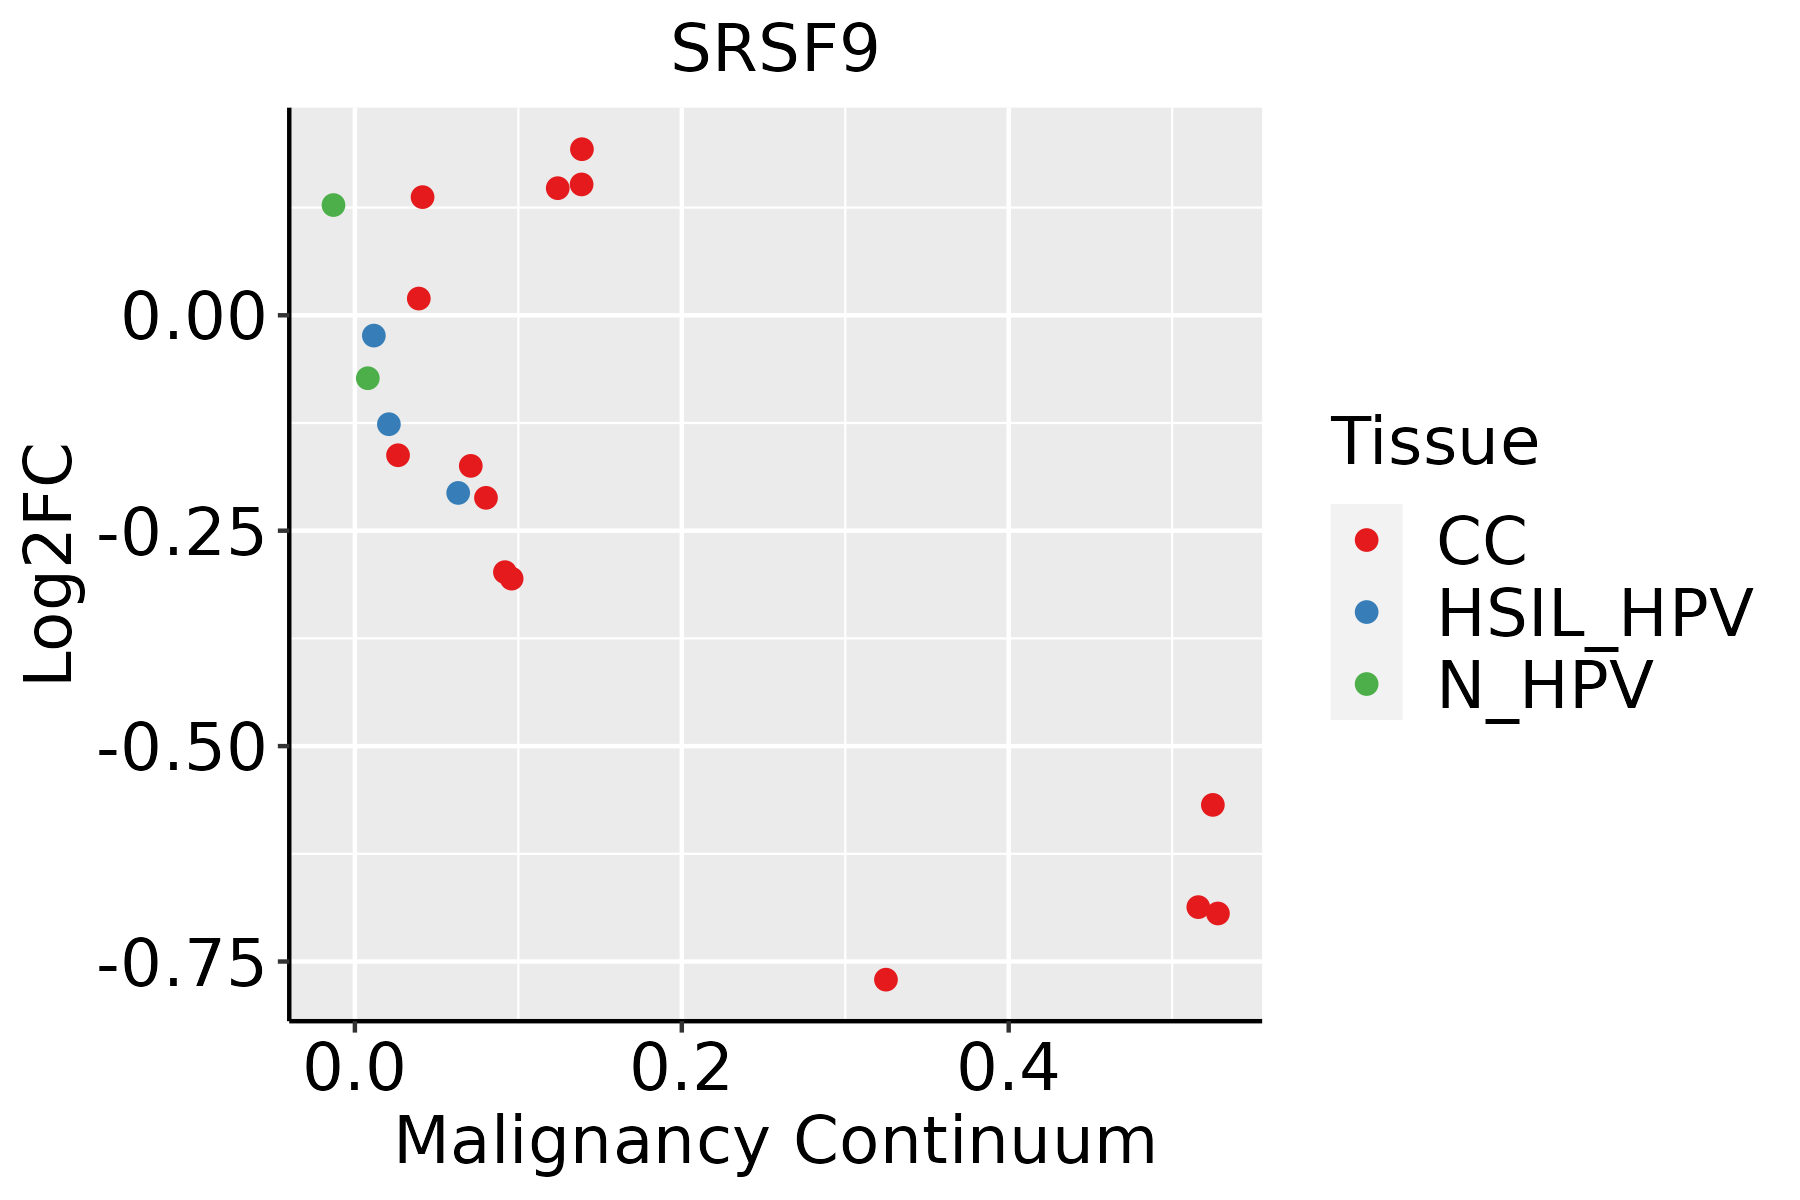 | CC: Cervix cancer |
| HSIL_HPV: HPV-infected high-grade squamous intraepithelial lesions | ||
| N_HPV: HPV-infected normal cervix | ||
| Endometrium | 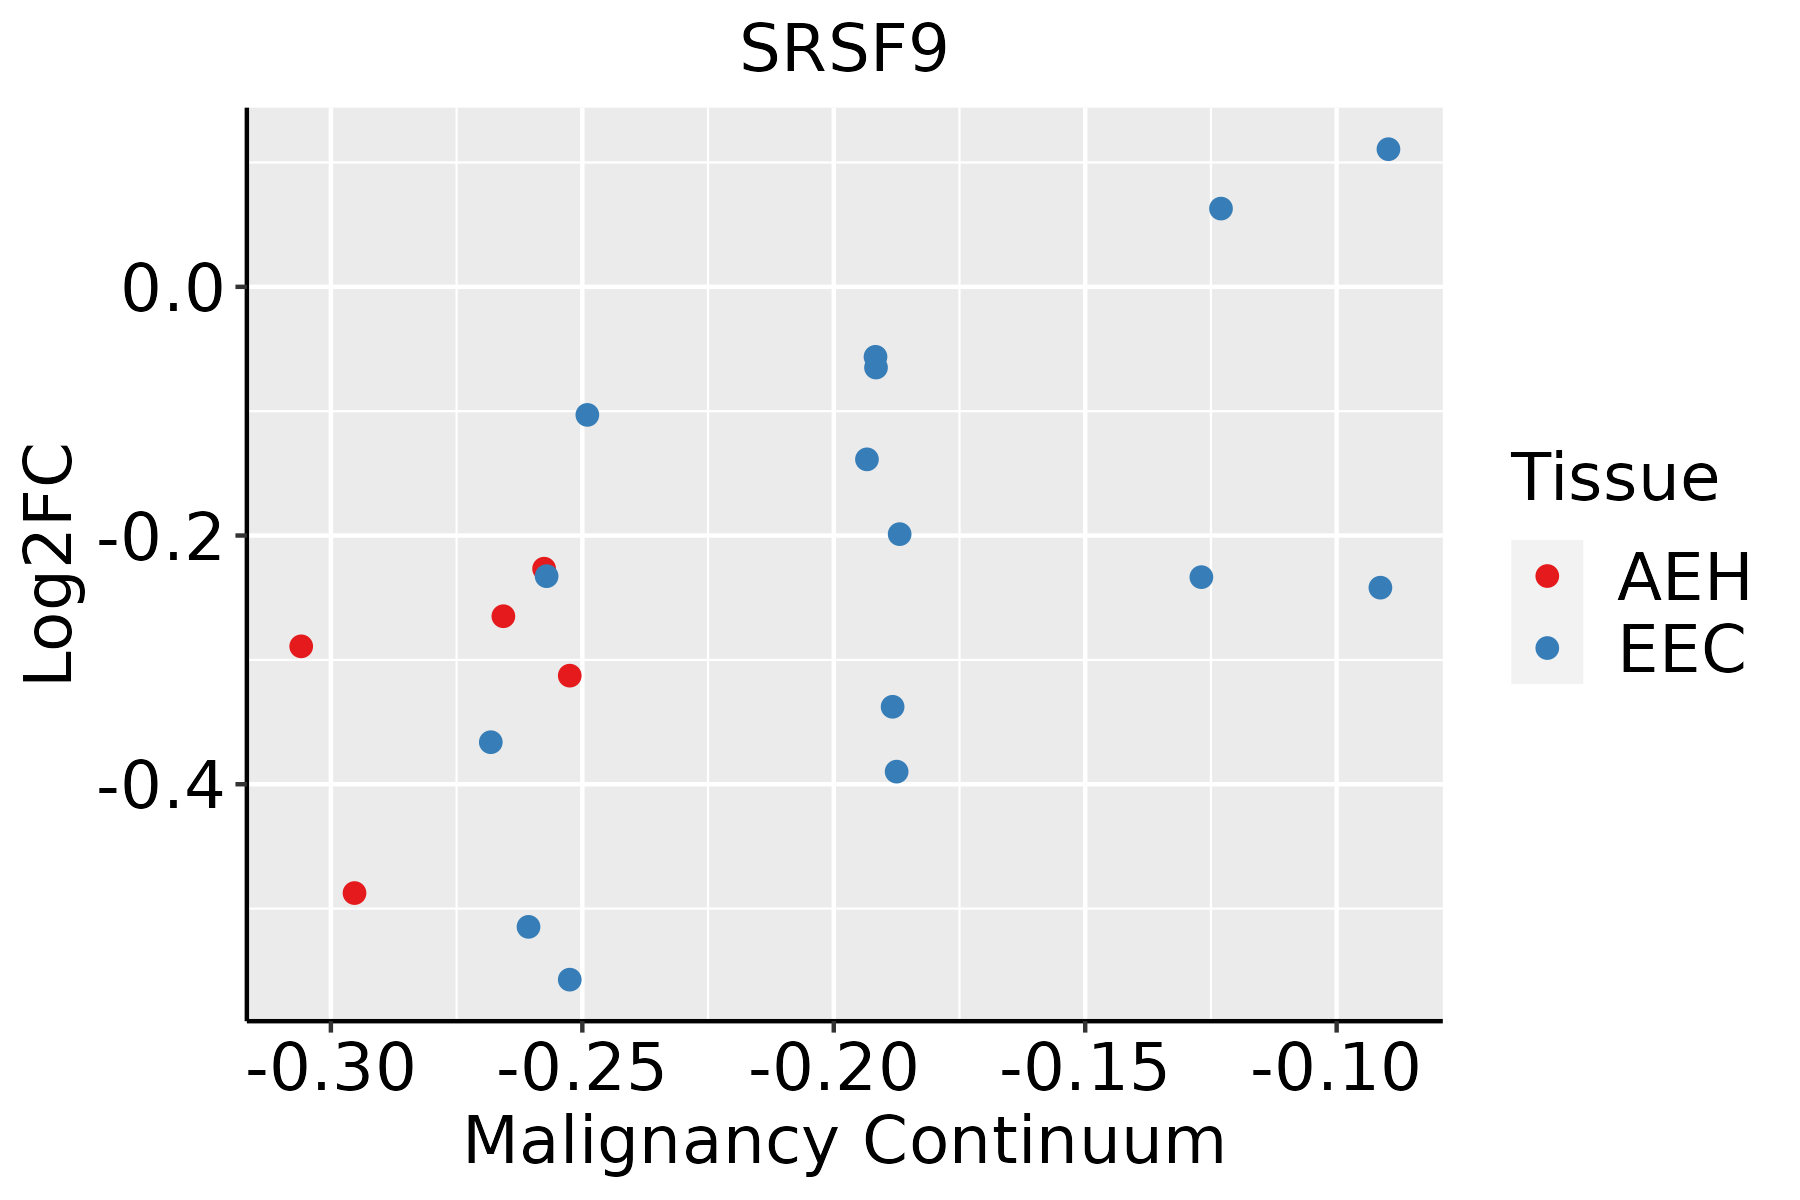 | AEH: Atypical endometrial hyperplasia |
| EEC: Endometrioid Cancer | ||
| Esophagus |  | ESCC: Esophageal squamous cell carcinoma |
| HGIN: High-grade intraepithelial neoplasias | ||
| LGIN: Low-grade intraepithelial neoplasias | ||
| Liver | 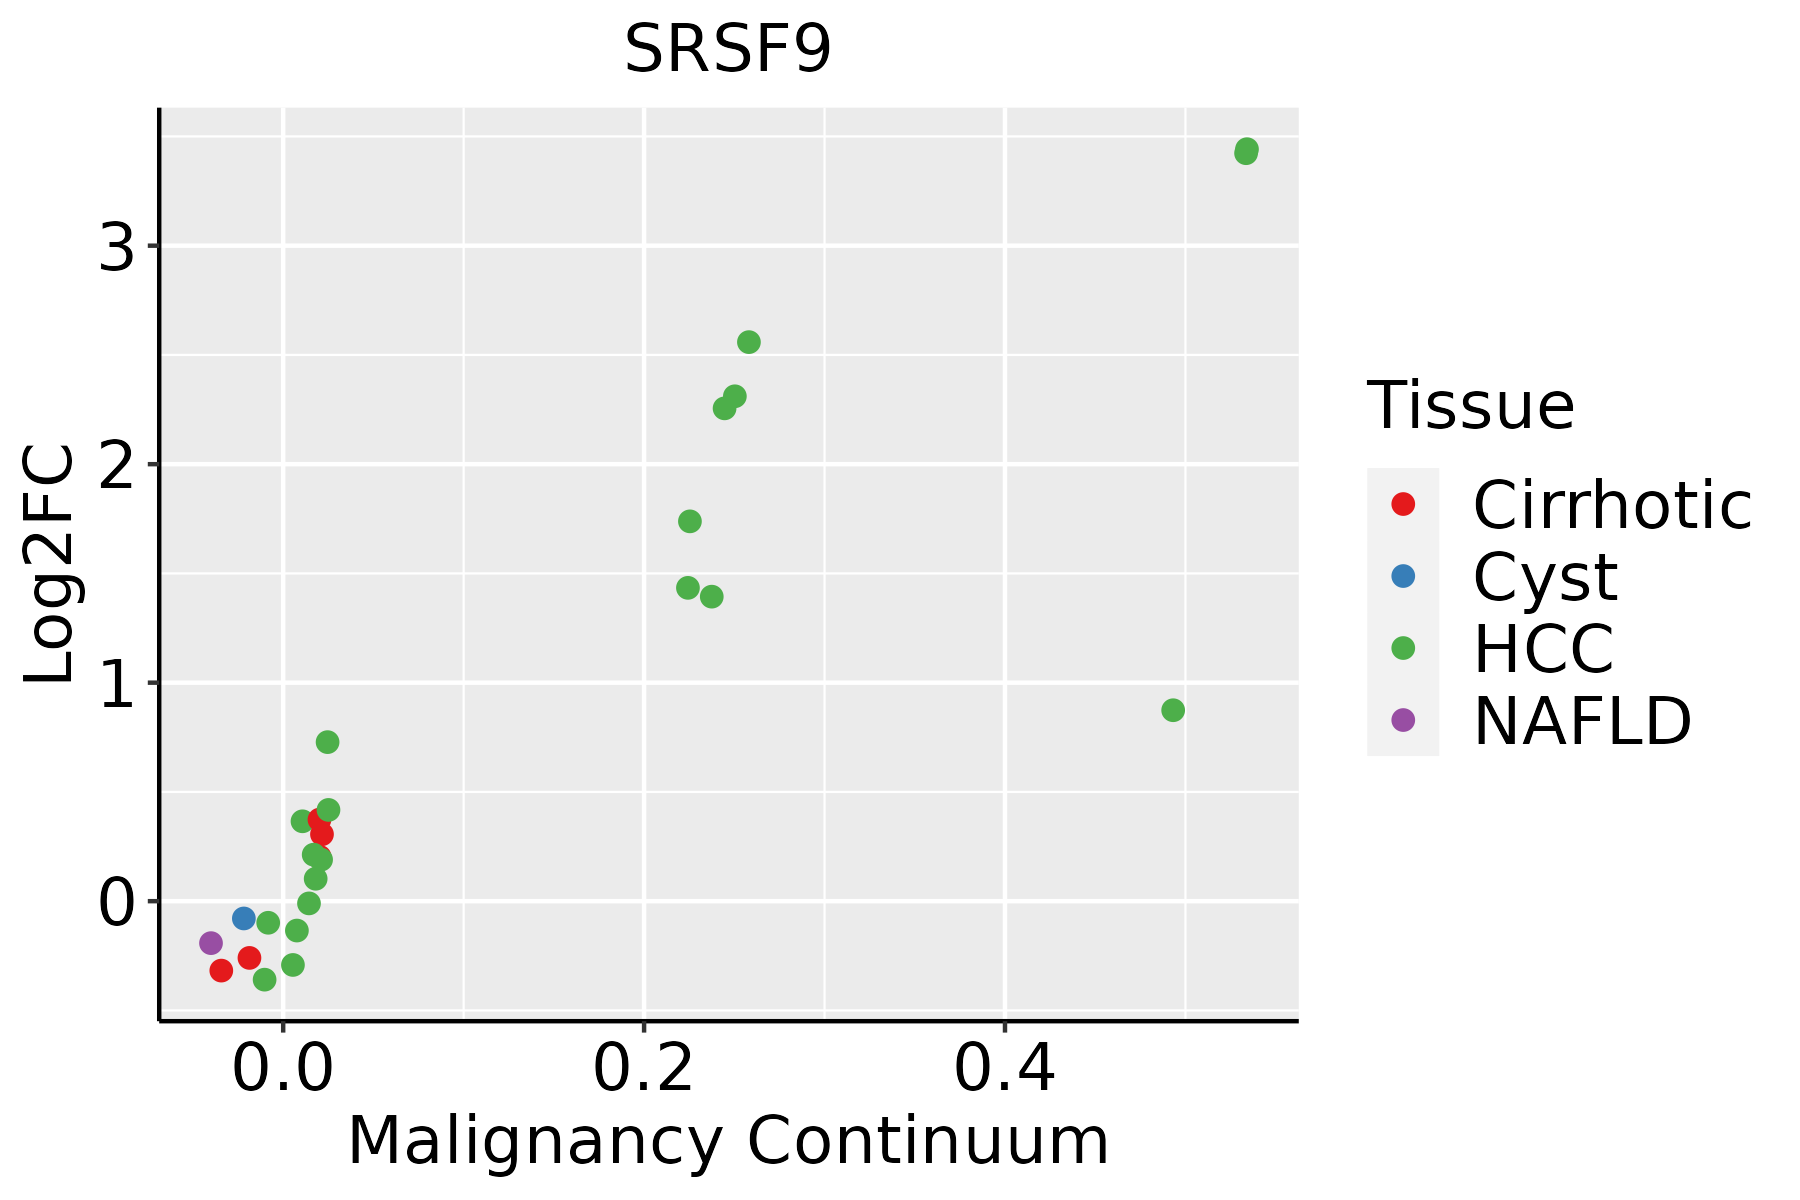 | HCC: Hepatocellular carcinoma |
| NAFLD: Non-alcoholic fatty liver disease | ||
| Oral Cavity |  | EOLP: Erosive Oral lichen planus |
| LP: leukoplakia | ||
| NEOLP: Non-erosive oral lichen planus | ||
| OSCC: Oral squamous cell carcinoma | ||
| Prostate |  | BPH: Benign Prostatic Hyperplasia |
| Skin |  | AK: Actinic keratosis |
| cSCC: Cutaneous squamous cell carcinoma | ||
| SCCIS:squamous cell carcinoma in situ | ||
| Thyroid | 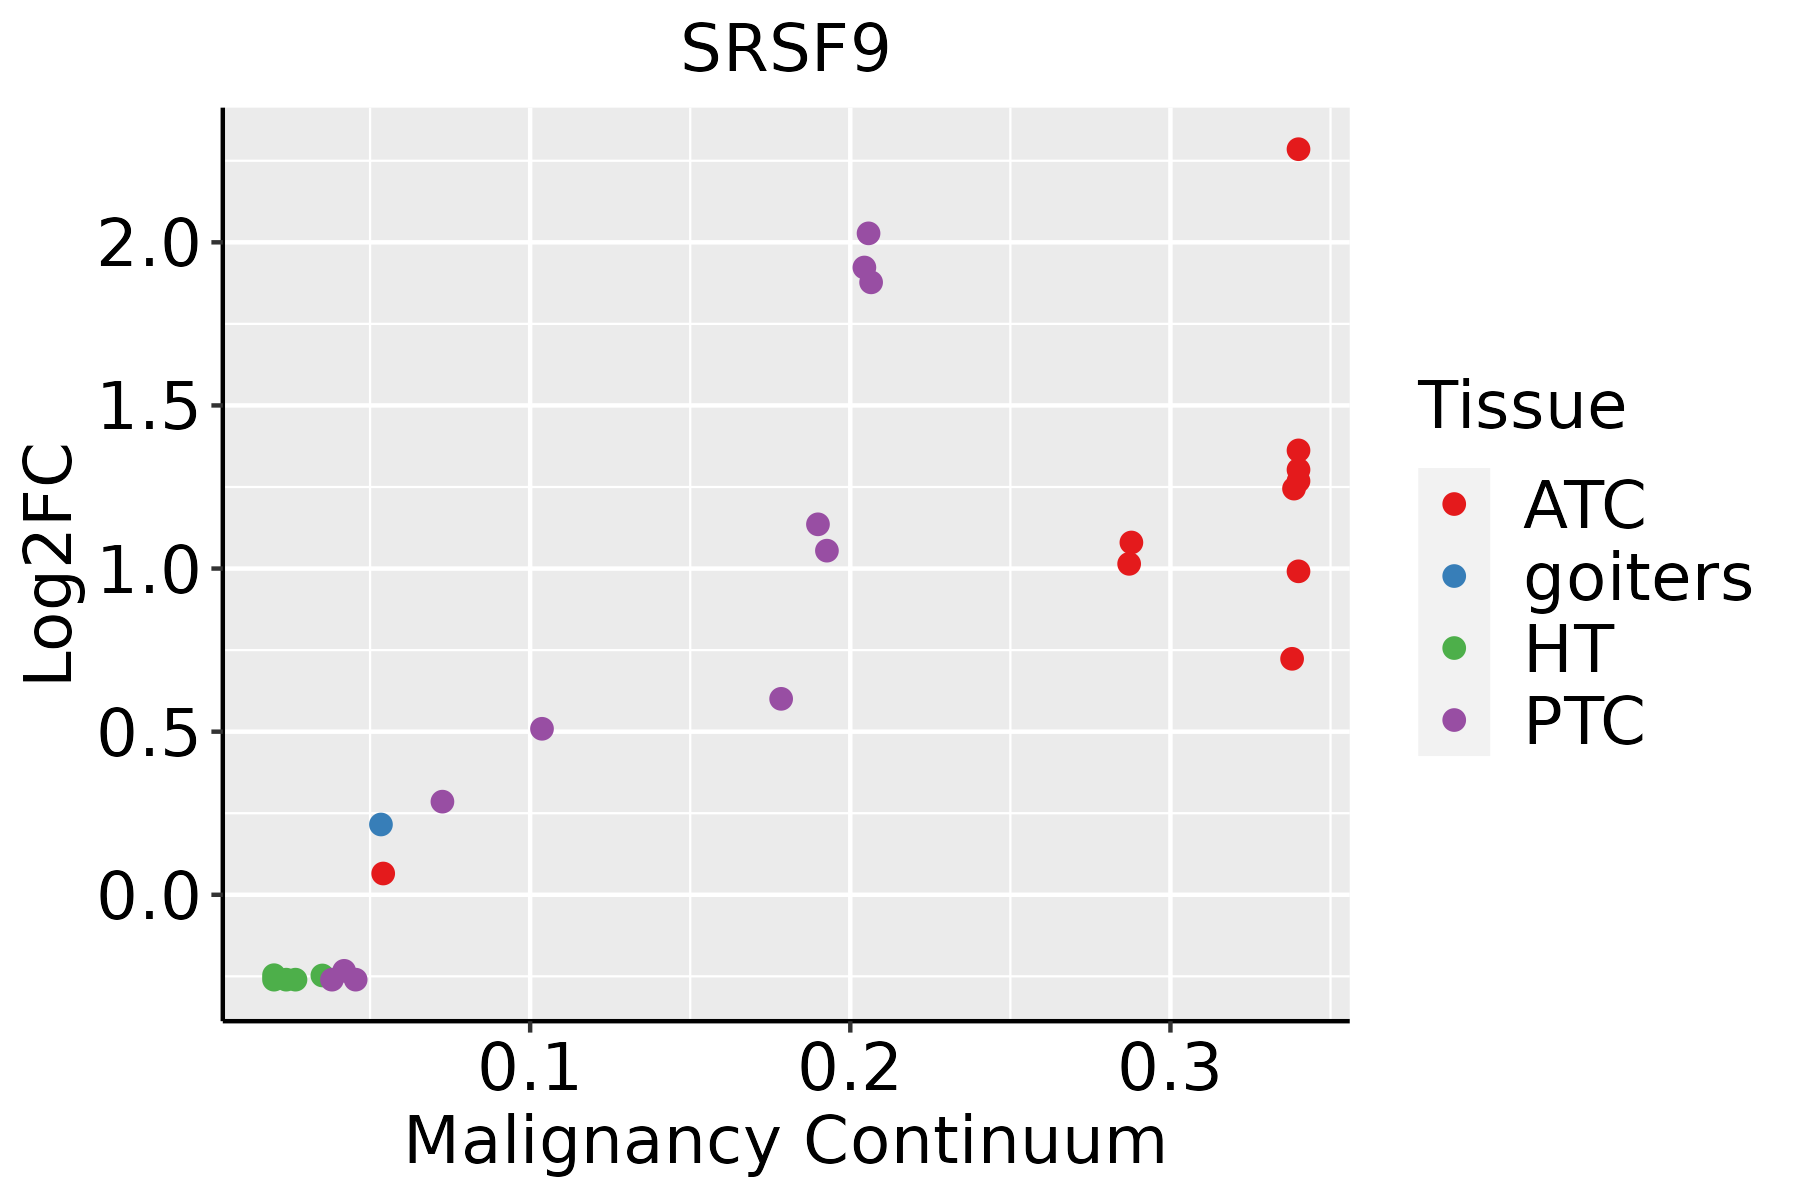 | ATC: Anaplastic thyroid cancer |
| HT: Hashimoto's thyroiditis | ||
| PTC: Papillary thyroid cancer |
| ∗log2FC in expression of this searched gene in stem-like cells from each diseased tissue sample relative to stem-like cells in normal samples in each tissue plotted against the malignancy continuum. Samples are colored based on if they are from different disease stage. |
Top |
Malignant transformation related pathway analysis |
| Find out the enriched GO biological processes and KEGG pathways involved in transition from healthy to precancer to cancer |
| Tissue | Disease Stage | Enriched GO biological Processes |
| Colorectum | AD |  |
| Colorectum | SER |  |
| Colorectum | MSS |  |
| Colorectum | MSI-H |  |
| Colorectum | FAP |  |
| ∗Top 15 enriched GO BP terms are showed in the bar plot of each disease state in each tissue. Each row represents a significant GO biological process which is colored according to the -log10(p.adjust). |
| Page: 1 2 3 4 5 6 7 8 9 |
| GO ID | Tissue | Disease Stage | Description | Gene Ratio | Bg Ratio | pvalue | p.adjust | Count |
| GO:0022618113 | Thyroid | PTC | ribonucleoprotein complex assembly | 130/5968 | 220/18723 | 6.25e-17 | 5.47e-15 | 130 |
| GO:0048024113 | Thyroid | PTC | regulation of mRNA splicing, via spliceosome | 71/5968 | 101/18723 | 2.39e-15 | 1.71e-13 | 71 |
| GO:0000380111 | Thyroid | PTC | alternative mRNA splicing, via spliceosome | 51/5968 | 77/18723 | 6.09e-10 | 1.92e-08 | 51 |
| GO:0033119113 | Thyroid | PTC | negative regulation of RNA splicing | 22/5968 | 25/18723 | 9.00e-09 | 2.18e-07 | 22 |
| GO:005068619 | Thyroid | PTC | negative regulation of mRNA processing | 24/5968 | 29/18723 | 2.26e-08 | 5.17e-07 | 24 |
| GO:0048025110 | Thyroid | PTC | negative regulation of mRNA splicing, via spliceosome | 18/5968 | 20/18723 | 1.05e-07 | 2.08e-06 | 18 |
| GO:1903312113 | Thyroid | PTC | negative regulation of mRNA metabolic process | 53/5968 | 92/18723 | 3.03e-07 | 5.13e-06 | 53 |
| GO:0009636111 | Thyroid | PTC | response to toxic substance | 115/5968 | 262/18723 | 2.70e-05 | 2.63e-04 | 115 |
| GO:00002459 | Thyroid | PTC | spliceosomal complex assembly | 39/5968 | 79/18723 | 8.86e-04 | 5.40e-03 | 39 |
| GO:002261334 | Thyroid | ATC | ribonucleoprotein complex biogenesis | 292/6293 | 463/18723 | 3.05e-39 | 9.63e-36 | 292 |
| GO:000838034 | Thyroid | ATC | RNA splicing | 270/6293 | 434/18723 | 7.50e-35 | 1.19e-31 | 270 |
| GO:000037534 | Thyroid | ATC | RNA splicing, via transesterification reactions | 200/6293 | 324/18723 | 1.75e-25 | 7.39e-23 | 200 |
| GO:000037734 | Thyroid | ATC | RNA splicing, via transesterification reactions with bulged adenosine as nucleophile | 197/6293 | 320/18723 | 6.54e-25 | 2.18e-22 | 197 |
| GO:000039834 | Thyroid | ATC | mRNA splicing, via spliceosome | 197/6293 | 320/18723 | 6.54e-25 | 2.18e-22 | 197 |
| GO:190331134 | Thyroid | ATC | regulation of mRNA metabolic process | 181/6293 | 288/18723 | 1.75e-24 | 5.54e-22 | 181 |
| GO:005068434 | Thyroid | ATC | regulation of mRNA processing | 97/6293 | 137/18723 | 5.28e-19 | 7.25e-17 | 97 |
| GO:004348435 | Thyroid | ATC | regulation of RNA splicing | 100/6293 | 148/18723 | 2.75e-17 | 2.72e-15 | 100 |
| GO:007182635 | Thyroid | ATC | ribonucleoprotein complex subunit organization | 133/6293 | 227/18723 | 8.32e-15 | 5.01e-13 | 133 |
| GO:002261835 | Thyroid | ATC | ribonucleoprotein complex assembly | 129/6293 | 220/18723 | 1.93e-14 | 1.10e-12 | 129 |
| GO:004802434 | Thyroid | ATC | regulation of mRNA splicing, via spliceosome | 70/6293 | 101/18723 | 2.29e-13 | 1.09e-11 | 70 |
| Page: 1 2 3 4 5 6 7 8 9 10 11 12 13 14 15 16 17 |
| Pathway ID | Tissue | Disease Stage | Description | Gene Ratio | Bg Ratio | pvalue | p.adjust | qvalue | Count |
| hsa030408 | Breast | Precancer | Spliceosome | 39/684 | 217/8465 | 1.44e-06 | 2.27e-05 | 1.74e-05 | 39 |
| hsa0304013 | Breast | Precancer | Spliceosome | 39/684 | 217/8465 | 1.44e-06 | 2.27e-05 | 1.74e-05 | 39 |
| hsa0304023 | Breast | IDC | Spliceosome | 40/867 | 217/8465 | 1.53e-04 | 1.42e-03 | 1.06e-03 | 40 |
| hsa0304033 | Breast | IDC | Spliceosome | 40/867 | 217/8465 | 1.53e-04 | 1.42e-03 | 1.06e-03 | 40 |
| hsa0304043 | Breast | DCIS | Spliceosome | 40/846 | 217/8465 | 8.97e-05 | 8.52e-04 | 6.28e-04 | 40 |
| hsa0304053 | Breast | DCIS | Spliceosome | 40/846 | 217/8465 | 8.97e-05 | 8.52e-04 | 6.28e-04 | 40 |
| hsa030409 | Endometrium | AEH | Spliceosome | 54/1197 | 217/8465 | 1.47e-05 | 1.65e-04 | 1.21e-04 | 54 |
| hsa0304014 | Endometrium | AEH | Spliceosome | 54/1197 | 217/8465 | 1.47e-05 | 1.65e-04 | 1.21e-04 | 54 |
| hsa0304024 | Endometrium | EEC | Spliceosome | 54/1237 | 217/8465 | 3.78e-05 | 3.88e-04 | 2.89e-04 | 54 |
| hsa0304034 | Endometrium | EEC | Spliceosome | 54/1237 | 217/8465 | 3.78e-05 | 3.88e-04 | 2.89e-04 | 54 |
| hsa0304018 | Esophagus | HGIN | Spliceosome | 79/1383 | 217/8465 | 3.22e-13 | 7.00e-12 | 5.56e-12 | 79 |
| hsa0304019 | Esophagus | HGIN | Spliceosome | 79/1383 | 217/8465 | 3.22e-13 | 7.00e-12 | 5.56e-12 | 79 |
| hsa0304027 | Esophagus | ESCC | Spliceosome | 128/4205 | 217/8465 | 3.31e-03 | 8.79e-03 | 4.50e-03 | 128 |
| hsa0304037 | Esophagus | ESCC | Spliceosome | 128/4205 | 217/8465 | 3.31e-03 | 8.79e-03 | 4.50e-03 | 128 |
| hsa030407 | Liver | Cirrhotic | Spliceosome | 102/2530 | 217/8465 | 5.69e-08 | 9.47e-07 | 5.84e-07 | 102 |
| hsa0304012 | Liver | Cirrhotic | Spliceosome | 102/2530 | 217/8465 | 5.69e-08 | 9.47e-07 | 5.84e-07 | 102 |
| hsa0304022 | Liver | HCC | Spliceosome | 122/4020 | 217/8465 | 5.55e-03 | 1.60e-02 | 8.91e-03 | 122 |
| hsa0304032 | Liver | HCC | Spliceosome | 122/4020 | 217/8465 | 5.55e-03 | 1.60e-02 | 8.91e-03 | 122 |
| hsa0304016 | Oral cavity | OSCC | Spliceosome | 123/3704 | 217/8465 | 7.21e-05 | 2.74e-04 | 1.40e-04 | 123 |
| hsa0304017 | Oral cavity | OSCC | Spliceosome | 123/3704 | 217/8465 | 7.21e-05 | 2.74e-04 | 1.40e-04 | 123 |
| Page: 1 2 |
Top |
Cell-cell communication analysis |
| Identification of potential cell-cell interactions between two cell types and their ligand-receptor pairs for different disease states |
| Ligand | Receptor | LRpair | Pathway | Tissue | Disease Stage |
| Page: 1 |
Top |
Single-cell gene regulatory network inference analysis |
| Find out the significant the regulons (TFs) and the target genes of each regulon across cell types for different disease states |
| TF | Cell Type | Tissue | Disease Stage | Target Gene | RSS | Regulon Activity |
| ∗The dot plots of a searched regulon are shown for all cell subpopulations in each disease state of each tissue based on the regulon specific score inferred using pySCENIC and by calculating the average expression. |
| Page: 1 |
Top |
Somatic mutation of malignant transformation related genes |
| Annotation of somatic variants for genes involved in malignant transformation |
| Hugo Symbol | Variant Class | Variant Classification | dbSNP RS | HGVSc | HGVSp | HGVSp Short | SWISSPROT | BIOTYPE | SIFT | PolyPhen | Tumor Sample Barcode | Tissue | Histology | Sex | Age | Stage | Therapy Types | Drugs | Outcome |
| SRSF9 | SNV | Missense_Mutation | rs139360328 | c.605N>A | p.Arg202His | p.R202H | Q13242 | protein_coding | tolerated(0.08) | benign(0.007) | TCGA-D8-A140-01 | Breast | breast invasive carcinoma | Female | <65 | I/II | Chemotherapy | doxorubicin+cyclophosphamid | SD |
| SRSF9 | SNV | Missense_Mutation | rs139360328 | c.605G>A | p.Arg202His | p.R202H | Q13242 | protein_coding | tolerated(0.08) | benign(0.007) | TCGA-E2-A14R-01 | Breast | breast invasive carcinoma | Female | <65 | I/II | Chemotherapy | doxorubicin | PD |
| SRSF9 | insertion | Frame_Shift_Ins | novel | c.542_543insGCTTACTGCAAGCTCCGCCTCCCGGGTTCACGCCA | p.Val182LeufsTer64 | p.V182Lfs*64 | Q13242 | protein_coding | TCGA-A2-A0CP-01 | Breast | breast invasive carcinoma | Female | <65 | I/II | Chemotherapy | cytoxan | SD | ||
| SRSF9 | insertion | Frame_Shift_Ins | novel | c.385_386insCTTTGAGGGGGATCAATGGCAGTAATTCAGATATATT | p.Asp129AlafsTer25 | p.D129Afs*25 | Q13242 | protein_coding | TCGA-A8-A08H-01 | Breast | breast invasive carcinoma | Female | >=65 | I/II | Unknown | Unknown | SD | ||
| SRSF9 | SNV | Missense_Mutation | c.586N>T | p.Arg196Trp | p.R196W | Q13242 | protein_coding | deleterious(0) | benign(0.003) | TCGA-FU-A3TQ-01 | Cervix | cervical & endocervical cancer | Female | <65 | III/IV | Unknown | Unknown | SD | |
| SRSF9 | SNV | Missense_Mutation | c.320N>C | p.Arg107Thr | p.R107T | Q13242 | protein_coding | deleterious(0) | possibly_damaging(0.821) | TCGA-IR-A3LH-01 | Cervix | cervical & endocervical cancer | Female | <65 | I/II | Chemotherapy | cisplatin | CR | |
| SRSF9 | SNV | Missense_Mutation | c.406N>A | p.Asp136Asn | p.D136N | Q13242 | protein_coding | deleterious(0) | possibly_damaging(0.9) | TCGA-AA-3966-01 | Colorectum | colon adenocarcinoma | Female | >=65 | I/II | Unknown | Unknown | SD | |
| SRSF9 | SNV | Missense_Mutation | rs368340216 | c.432N>T | p.Lys144Asn | p.K144N | Q13242 | protein_coding | deleterious(0.02) | possibly_damaging(0.83) | TCGA-AY-6197-01 | Colorectum | colon adenocarcinoma | Male | <65 | I/II | Unknown | Unknown | SD |
| SRSF9 | insertion | Frame_Shift_Ins | novel | c.161_162insT | p.Ala55ArgfsTer22 | p.A55Rfs*22 | Q13242 | protein_coding | TCGA-WS-AB45-01 | Colorectum | colon adenocarcinoma | Female | <65 | I/II | Unknown | Unknown | SD | ||
| SRSF9 | SNV | Missense_Mutation | novel | c.499N>T | p.Asp167Tyr | p.D167Y | Q13242 | protein_coding | deleterious(0) | possibly_damaging(0.516) | TCGA-A5-A2K5-01 | Endometrium | uterine corpus endometrioid carcinoma | Female | >=65 | I/II | Unknown | Unknown | SD |
| Page: 1 2 |
Top |
Related drugs of malignant transformation related genes |
| Identification of chemicals and drugs interact with genes involved in malignant transfromation |
| (DGIdb 4.0) |
| Entrez ID | Symbol | Category | Interaction Types | Drug Claim Name | Drug Name | PMIDs |
| Page: 1 |

Copyright 2023-Present -The University of Texas Health Science Center at Houston |