| Tissue | Expression Dynamics | Abbreviation |
| Breast | 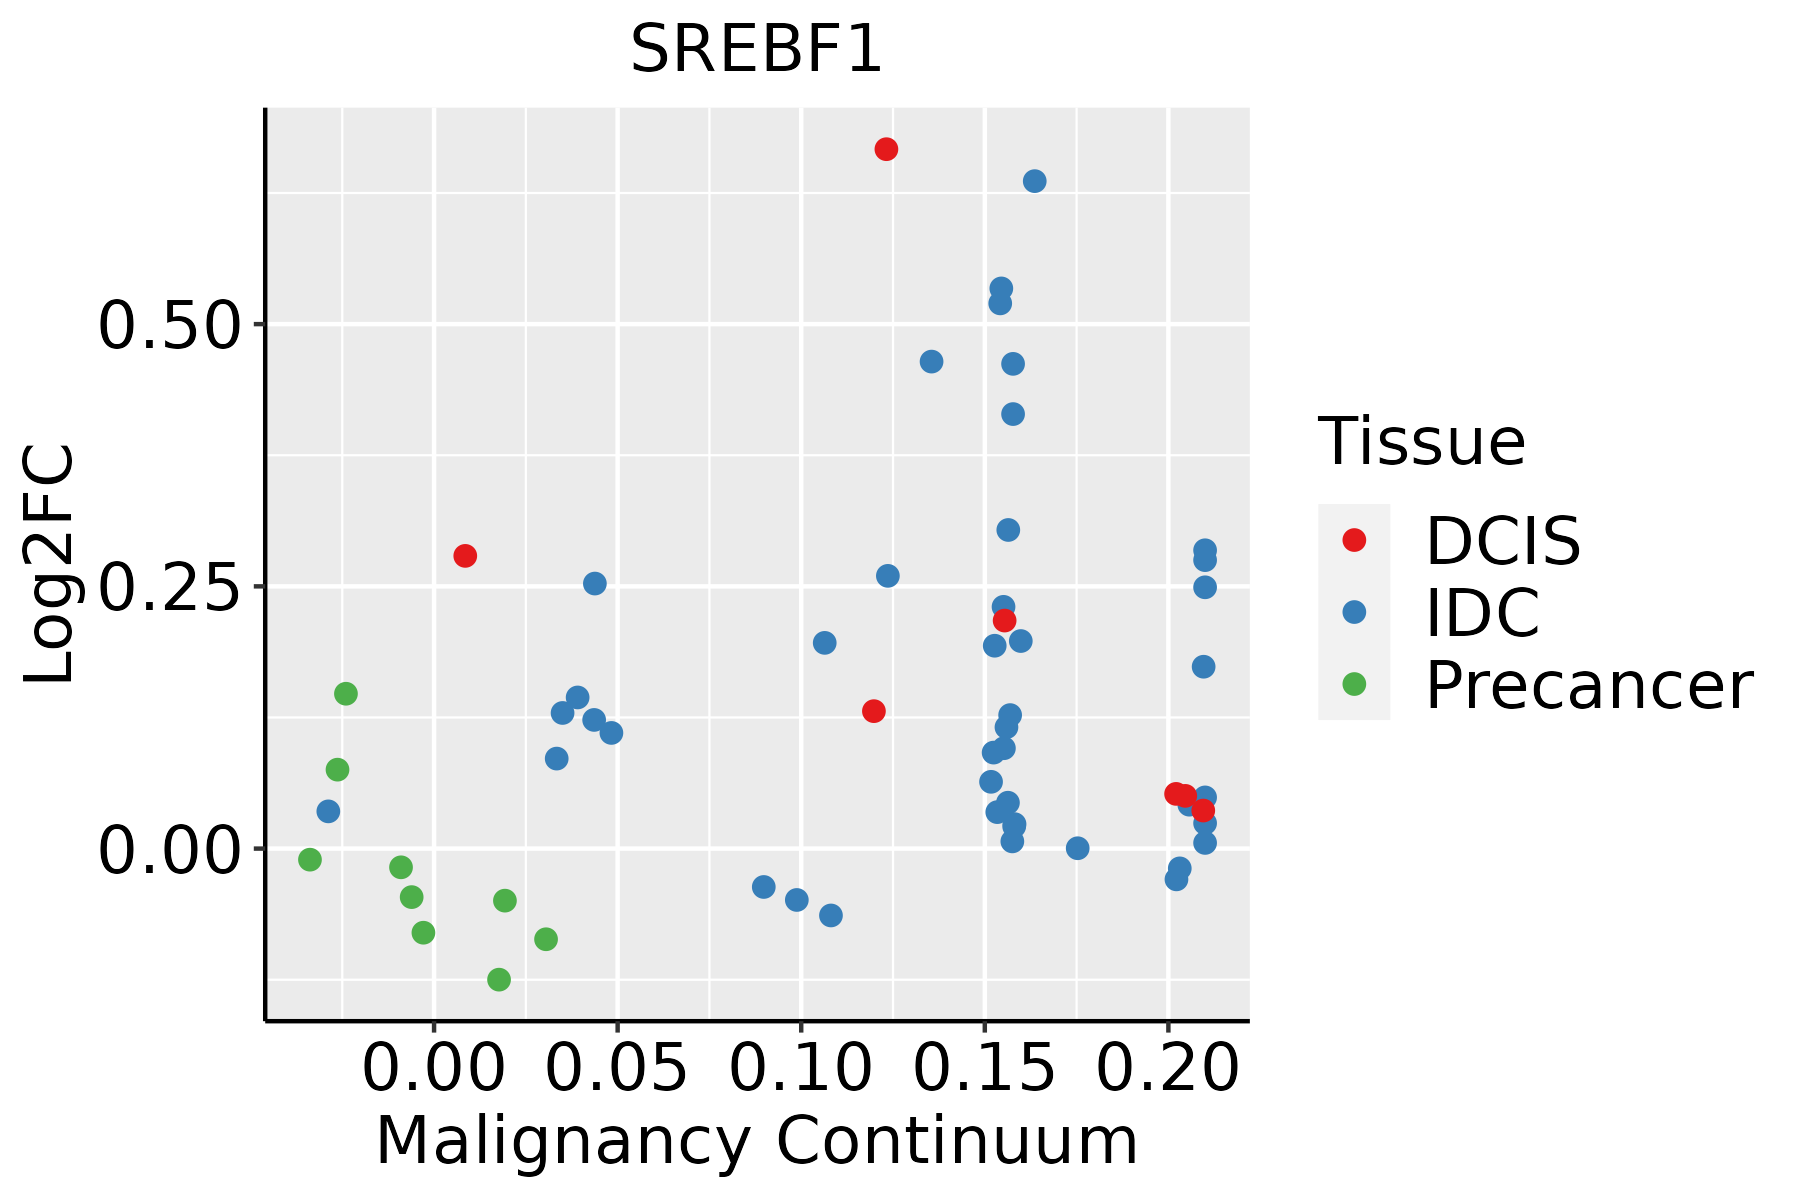 | IDC: Invasive ductal carcinoma |
| DCIS: Ductal carcinoma in situ |
| Precancer(BRCA1-mut): Precancerous lesion from BRCA1 mutation carriers |
| Cervix |  | CC: Cervix cancer |
| HSIL_HPV: HPV-infected high-grade squamous intraepithelial lesions |
| N_HPV: HPV-infected normal cervix |
| Esophagus | 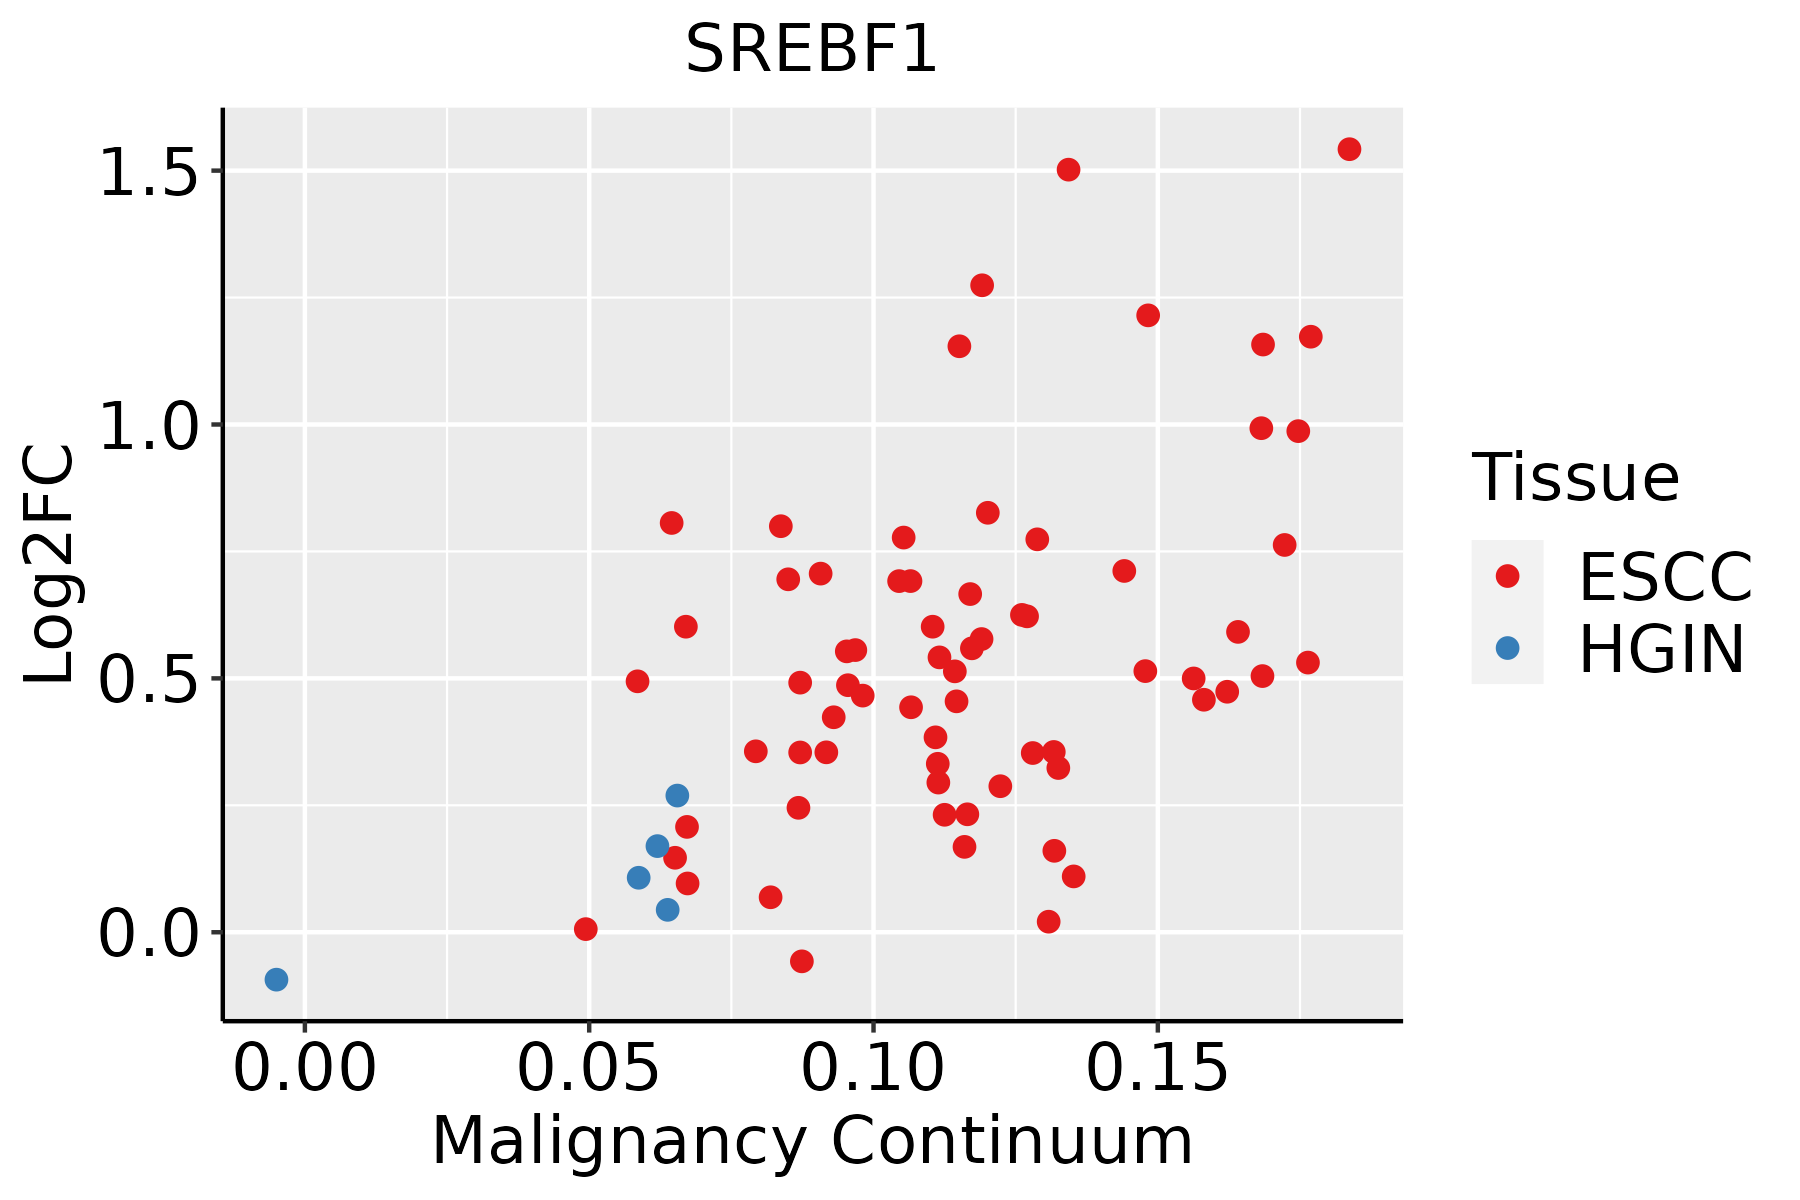 | ESCC: Esophageal squamous cell carcinoma |
| HGIN: High-grade intraepithelial neoplasias |
| LGIN: Low-grade intraepithelial neoplasias |
| Liver | 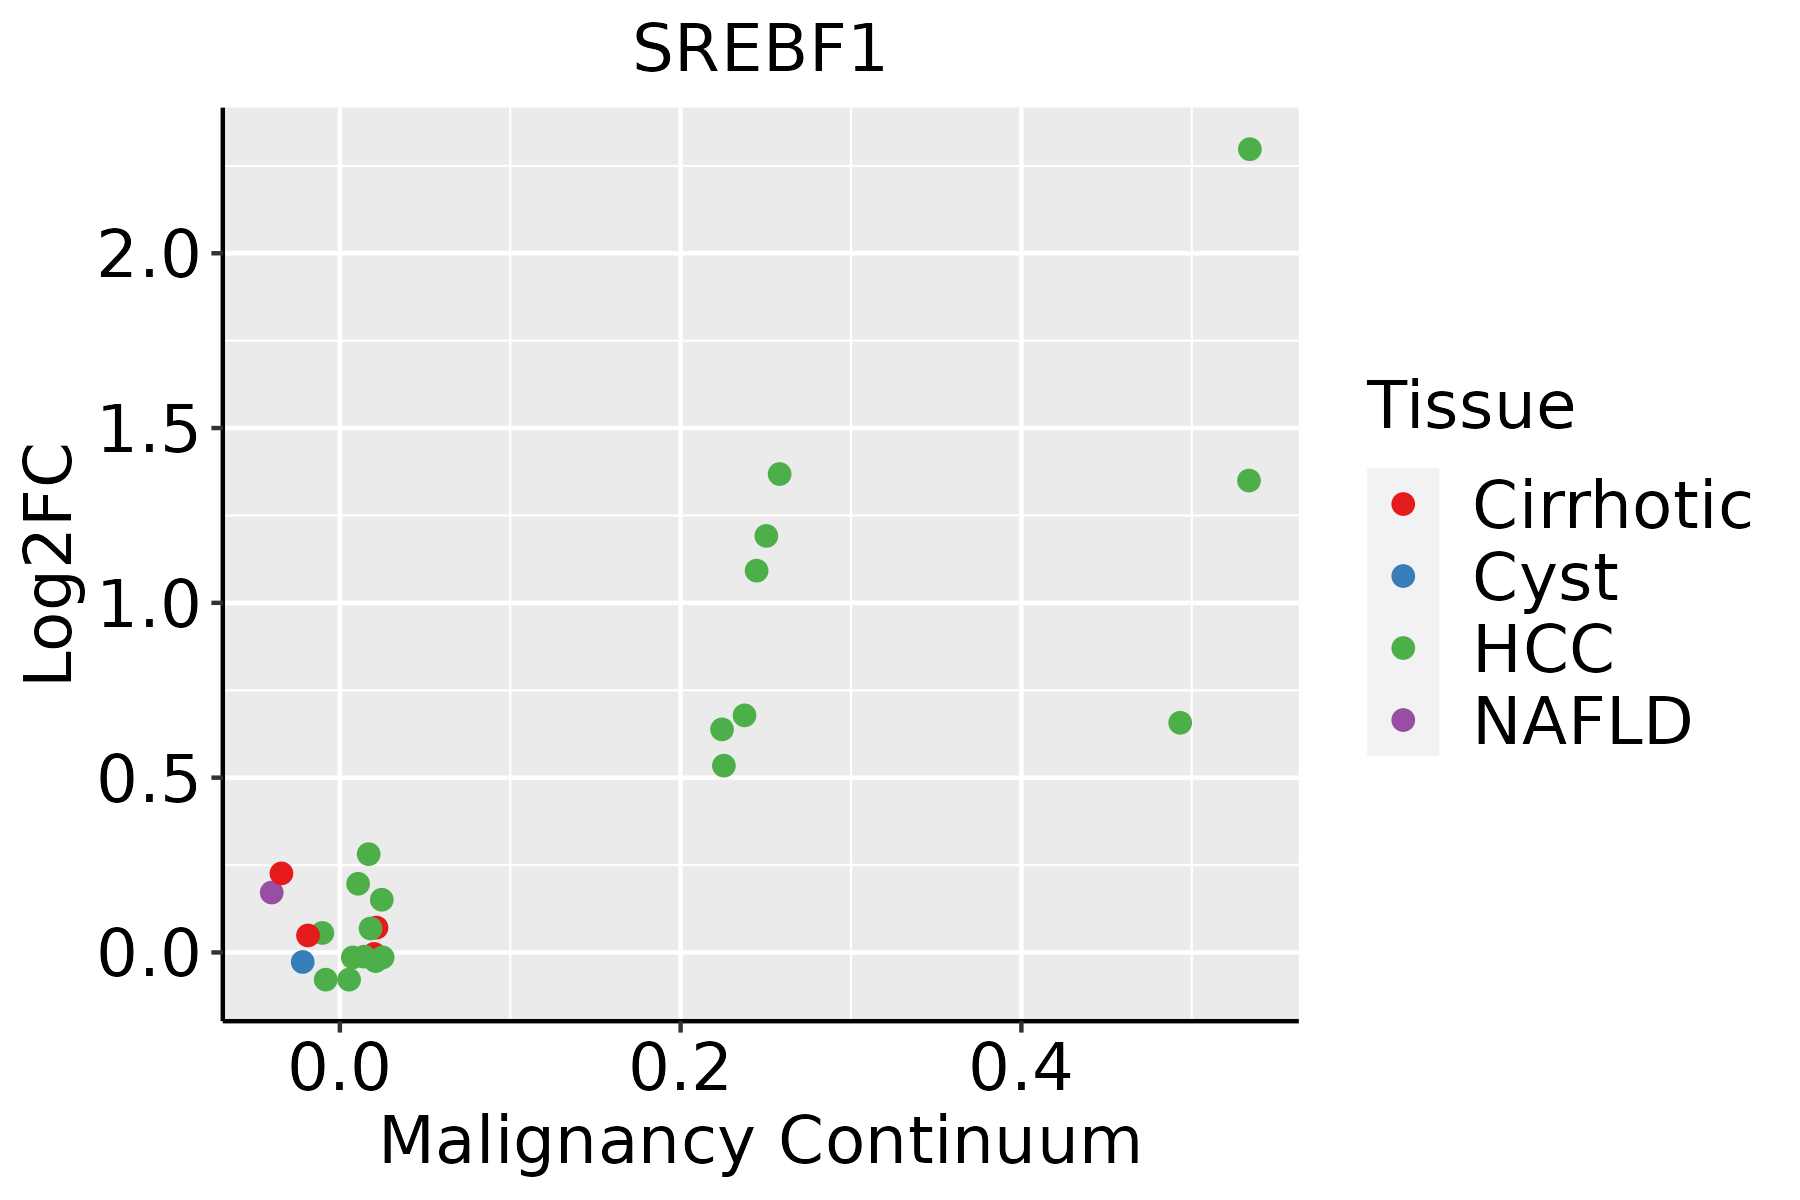 | HCC: Hepatocellular carcinoma |
| NAFLD: Non-alcoholic fatty liver disease |
| Oral Cavity | 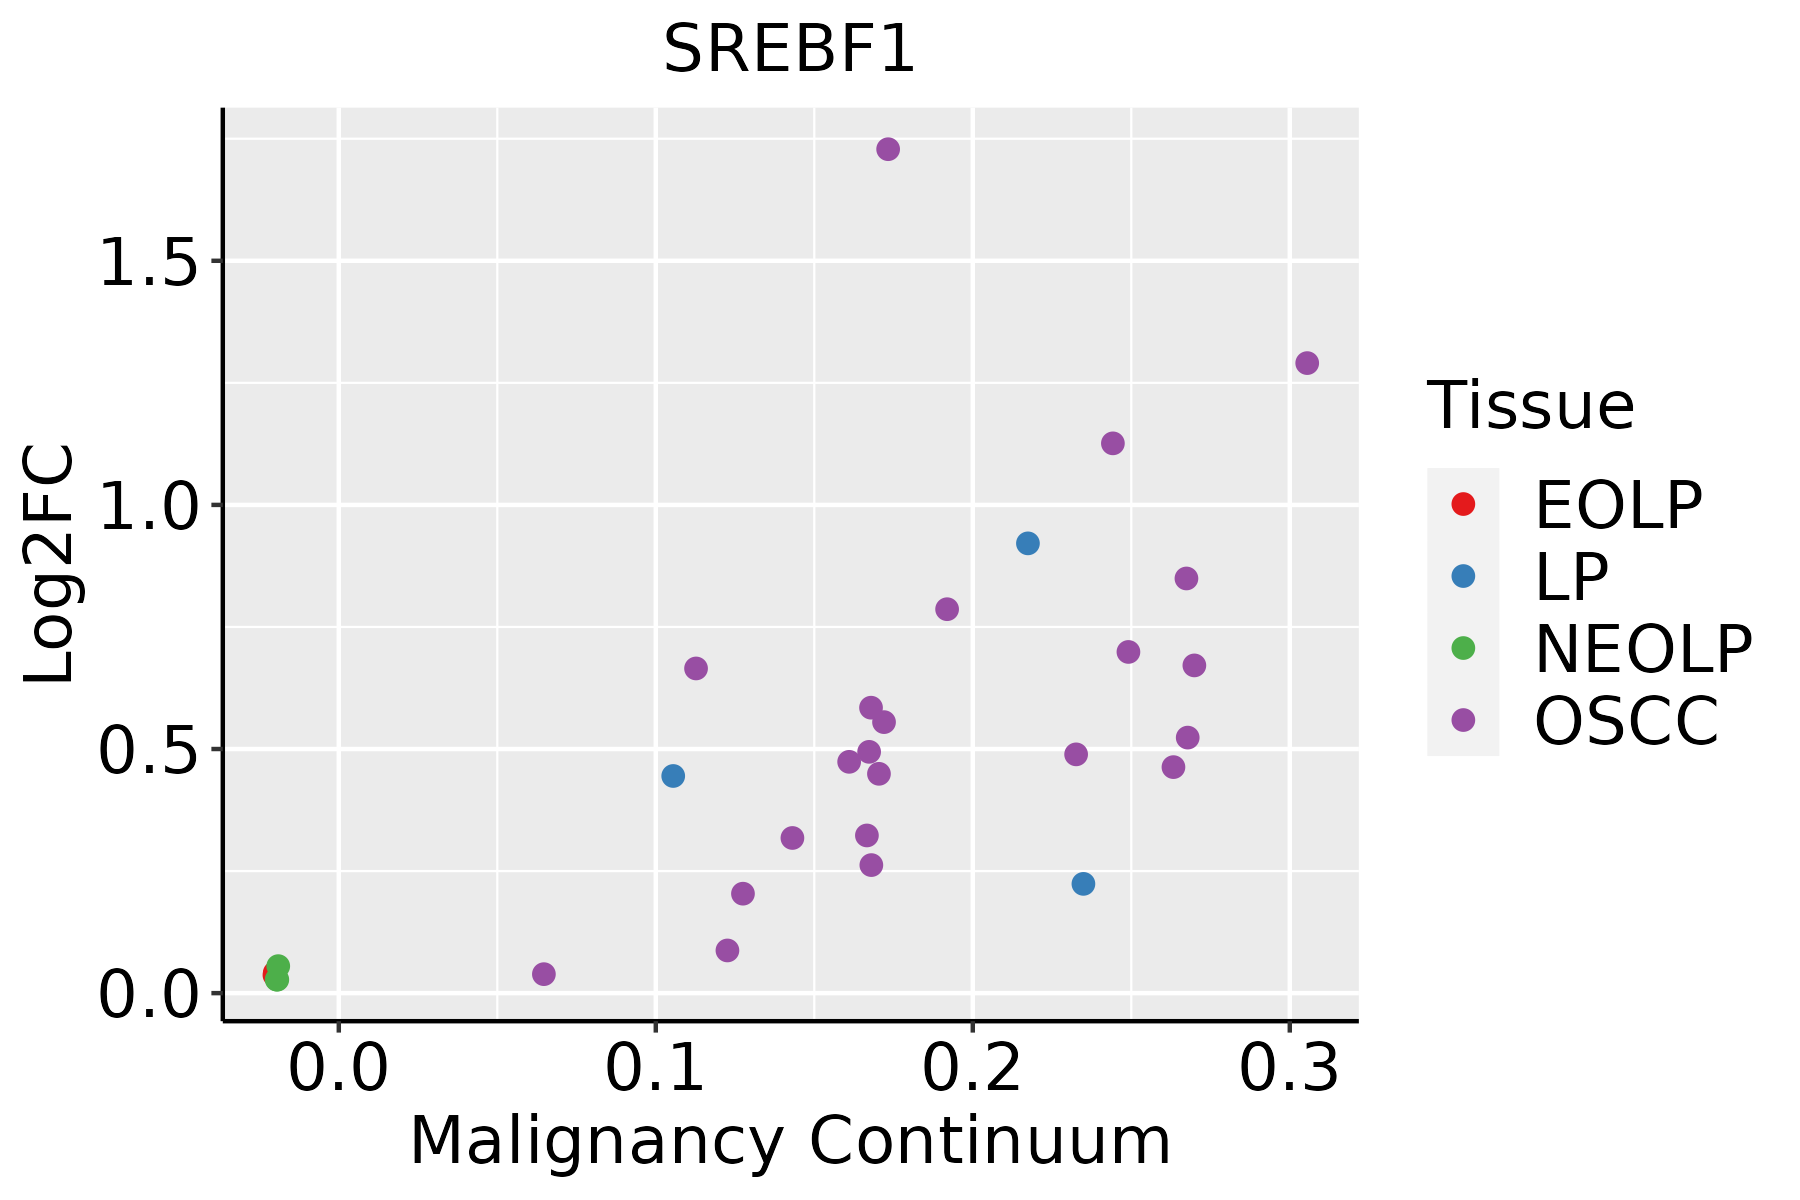 | EOLP: Erosive Oral lichen planus |
| LP: leukoplakia |
| NEOLP: Non-erosive oral lichen planus |
| OSCC: Oral squamous cell carcinoma |
| Prostate | 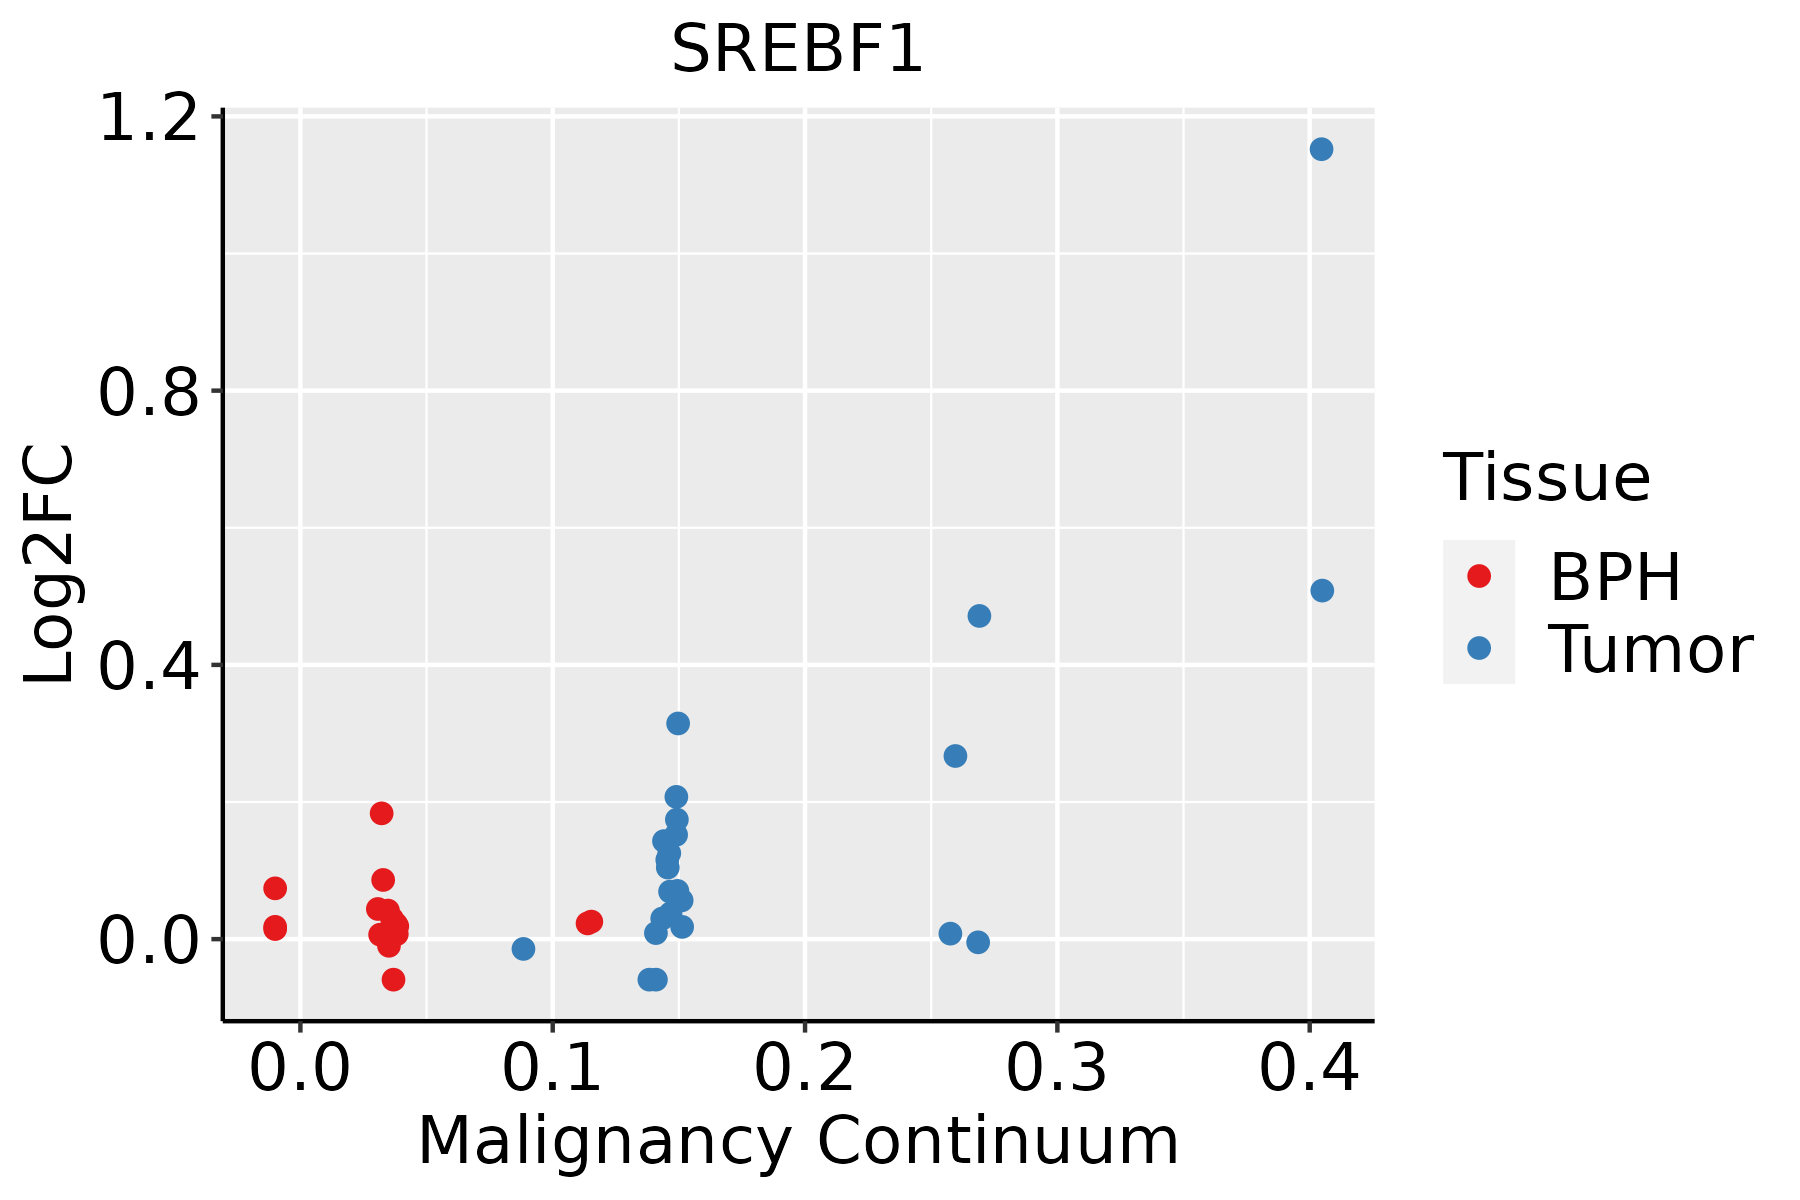 | BPH: Benign Prostatic Hyperplasia |
| Skin | 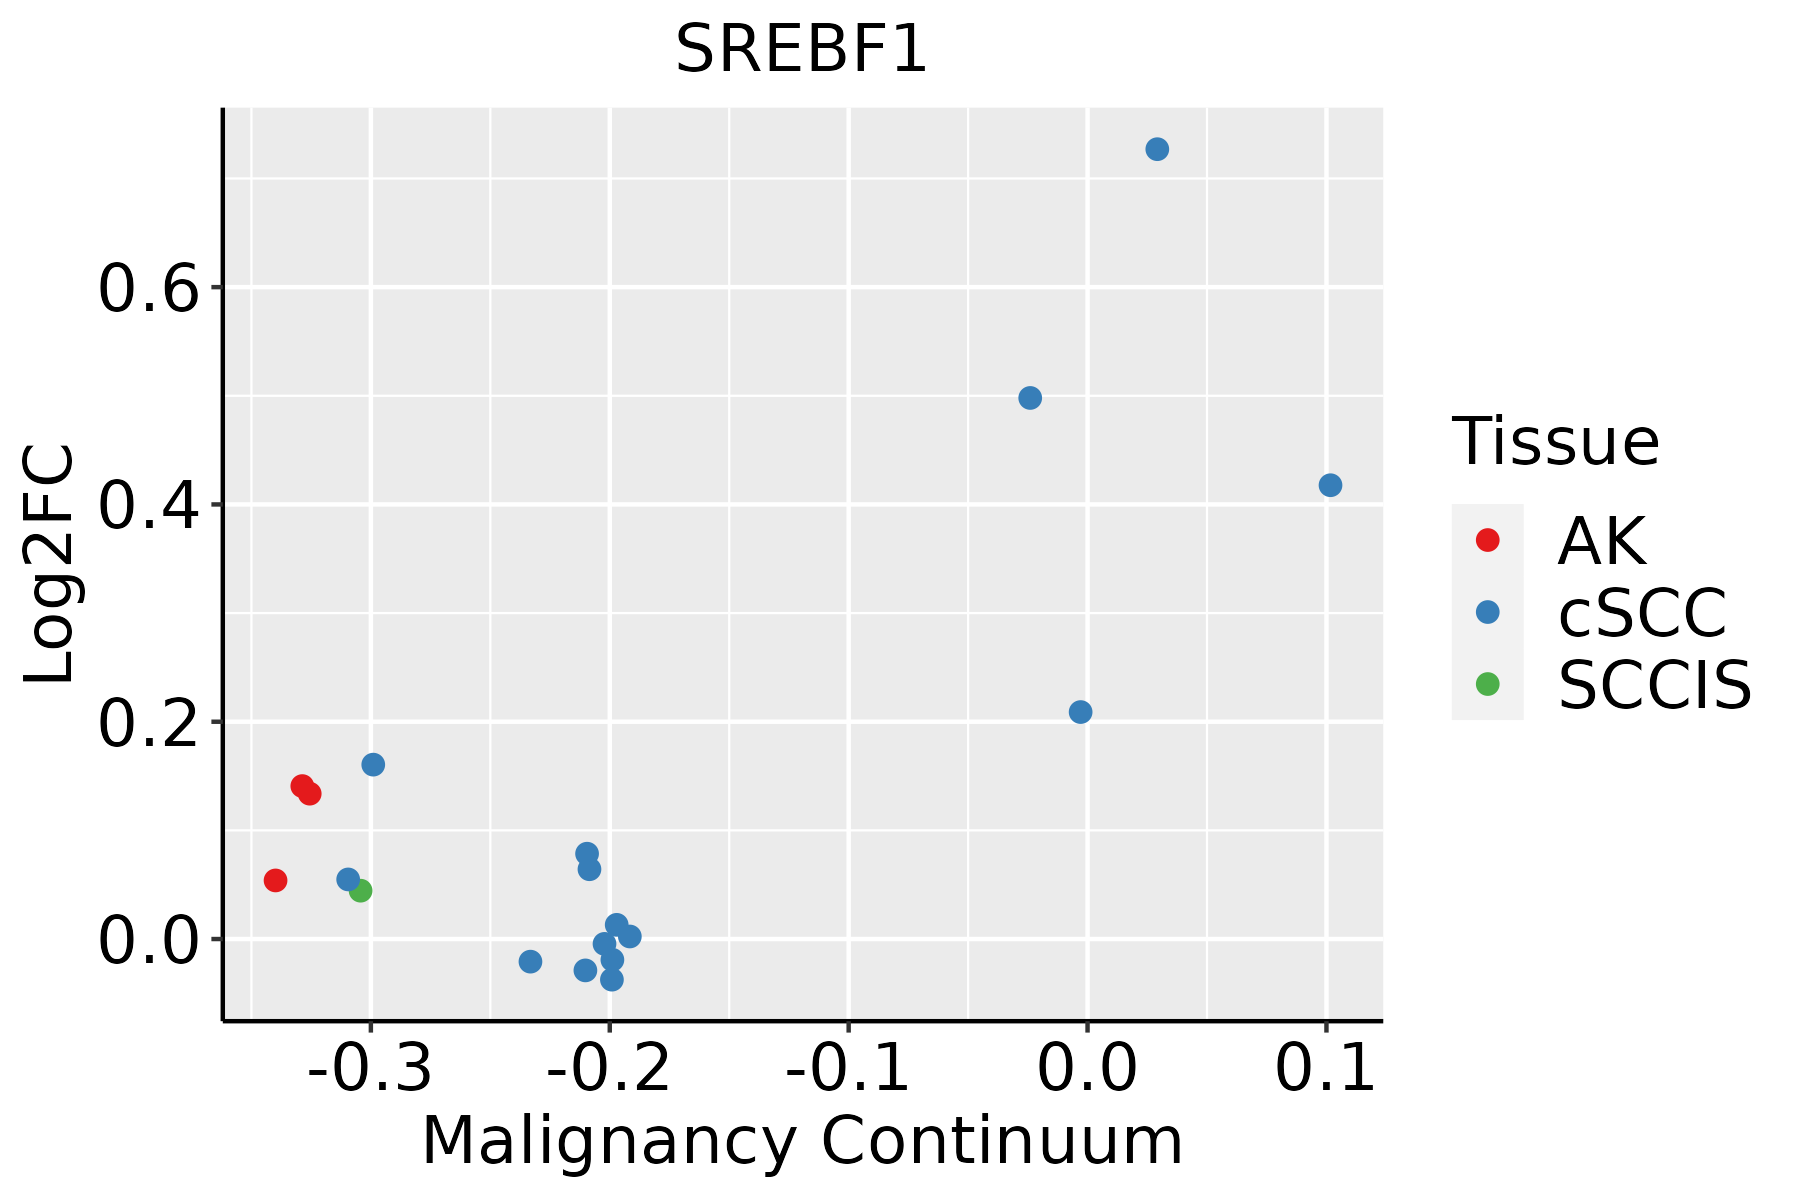 | AK: Actinic keratosis |
| cSCC: Cutaneous squamous cell carcinoma |
| SCCIS:squamous cell carcinoma in situ |
| Thyroid | 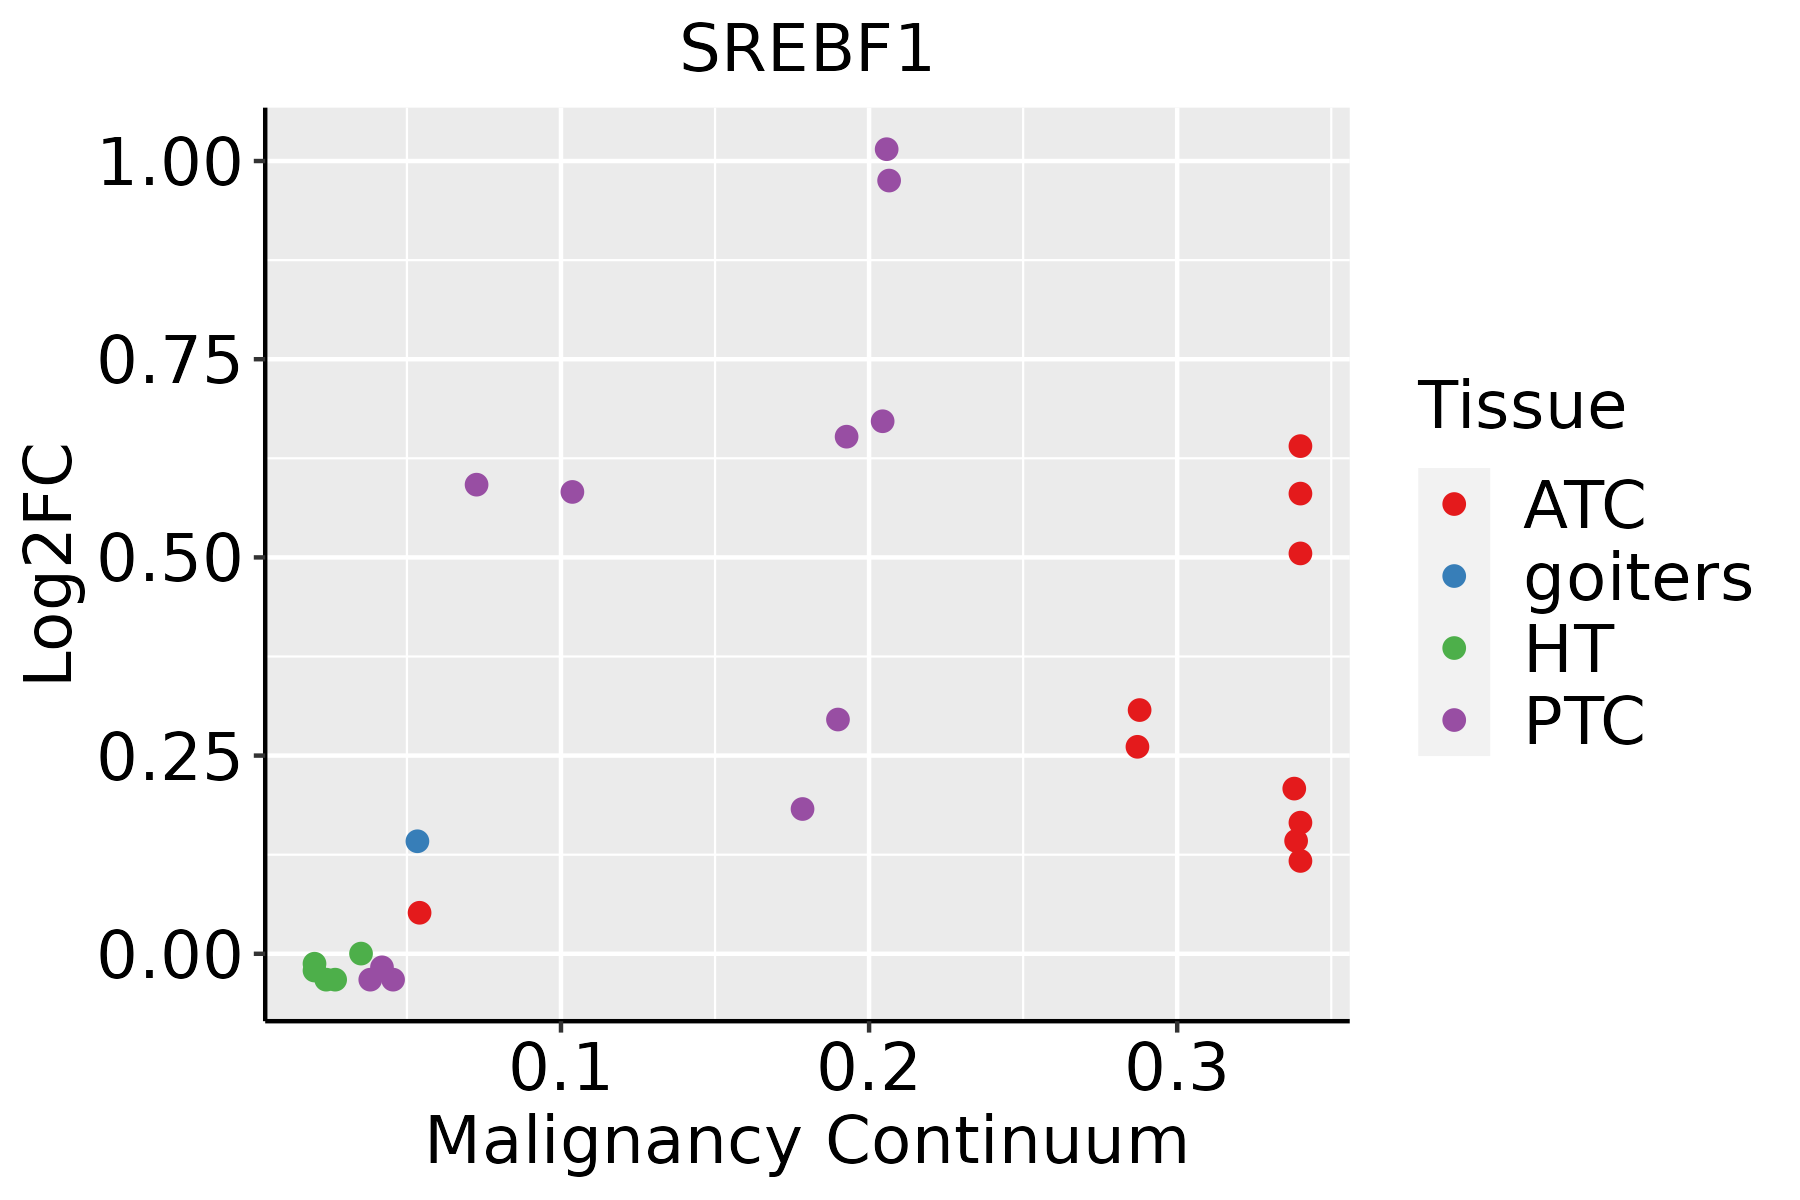 | ATC: Anaplastic thyroid cancer |
| HT: Hashimoto's thyroiditis |
| PTC: Papillary thyroid cancer |
| GO ID | Tissue | Disease Stage | Description | Gene Ratio | Bg Ratio | pvalue | p.adjust | Count |
| GO:003052222 | Liver | HCC | intracellular receptor signaling pathway | 171/7958 | 265/18723 | 3.00e-13 | 1.61e-11 | 171 |
| GO:003286921 | Liver | HCC | cellular response to insulin stimulus | 137/7958 | 203/18723 | 4.69e-13 | 2.44e-11 | 137 |
| GO:004343422 | Liver | HCC | response to peptide hormone | 247/7958 | 414/18723 | 9.55e-13 | 4.77e-11 | 247 |
| GO:003166722 | Liver | HCC | response to nutrient levels | 276/7958 | 474/18723 | 2.30e-12 | 1.08e-10 | 276 |
| GO:004854522 | Liver | HCC | response to steroid hormone | 206/7958 | 339/18723 | 6.81e-12 | 2.92e-10 | 206 |
| GO:000042211 | Liver | HCC | autophagy of mitochondrion | 64/7958 | 81/18723 | 1.96e-11 | 7.72e-10 | 64 |
| GO:006172611 | Liver | HCC | mitochondrion disassembly | 64/7958 | 81/18723 | 1.96e-11 | 7.72e-10 | 64 |
| GO:007137521 | Liver | HCC | cellular response to peptide hormone stimulus | 179/7958 | 290/18723 | 2.54e-11 | 9.88e-10 | 179 |
| GO:000606621 | Liver | HCC | alcohol metabolic process | 208/7958 | 353/18723 | 2.80e-10 | 9.50e-09 | 208 |
| GO:190165321 | Liver | HCC | cellular response to peptide | 211/7958 | 359/18723 | 2.86e-10 | 9.63e-09 | 211 |
| GO:19026522 | Liver | HCC | secondary alcohol metabolic process | 100/7958 | 147/18723 | 3.26e-10 | 1.09e-08 | 100 |
| GO:007149622 | Liver | HCC | cellular response to external stimulus | 191/7958 | 320/18723 | 3.40e-10 | 1.13e-08 | 191 |
| GO:00082032 | Liver | HCC | cholesterol metabolic process | 94/7958 | 137/18723 | 5.39e-10 | 1.72e-08 | 94 |
| GO:00082022 | Liver | HCC | steroid metabolic process | 188/7958 | 319/18723 | 1.96e-09 | 5.63e-08 | 188 |
| GO:00161252 | Liver | HCC | sterol metabolic process | 101/7958 | 152/18723 | 1.99e-09 | 5.63e-08 | 101 |
| GO:001082112 | Liver | HCC | regulation of mitochondrion organization | 96/7958 | 144/18723 | 3.82e-09 | 1.02e-07 | 96 |
| GO:003166812 | Liver | HCC | cellular response to extracellular stimulus | 149/7958 | 246/18723 | 7.35e-09 | 1.86e-07 | 149 |
| GO:190353311 | Liver | HCC | regulation of protein targeting | 60/7958 | 81/18723 | 7.70e-09 | 1.94e-07 | 60 |
| GO:190374711 | Liver | HCC | regulation of establishment of protein localization to mitochondrion | 41/7958 | 50/18723 | 1.14e-08 | 2.83e-07 | 41 |
| GO:003105621 | Liver | HCC | regulation of histone modification | 99/7958 | 152/18723 | 1.40e-08 | 3.40e-07 | 99 |
| Pathway ID | Tissue | Disease Stage | Description | Gene Ratio | Bg Ratio | pvalue | p.adjust | qvalue | Count |
| hsa0493243 | Breast | DCIS | Non-alcoholic fatty liver disease | 49/846 | 155/8465 | 5.87e-14 | 1.35e-12 | 9.97e-13 | 49 |
| hsa0493253 | Breast | DCIS | Non-alcoholic fatty liver disease | 49/846 | 155/8465 | 5.87e-14 | 1.35e-12 | 9.97e-13 | 49 |
| hsa0493230 | Esophagus | HGIN | Non-alcoholic fatty liver disease | 66/1383 | 155/8465 | 5.21e-15 | 1.21e-13 | 9.64e-14 | 66 |
| hsa04932113 | Esophagus | HGIN | Non-alcoholic fatty liver disease | 66/1383 | 155/8465 | 5.21e-15 | 1.21e-13 | 9.64e-14 | 66 |
| hsa04932210 | Esophagus | ESCC | Non-alcoholic fatty liver disease | 122/4205 | 155/8465 | 5.69e-14 | 1.59e-12 | 8.14e-13 | 122 |
| hsa0415210 | Esophagus | ESCC | AMPK signaling pathway | 80/4205 | 121/8465 | 1.73e-04 | 6.67e-04 | 3.42e-04 | 80 |
| hsa049109 | Esophagus | ESCC | Insulin signaling pathway | 89/4205 | 137/8465 | 1.97e-04 | 7.32e-04 | 3.75e-04 | 89 |
| hsa049318 | Esophagus | ESCC | Insulin resistance | 69/4205 | 108/8465 | 1.92e-03 | 5.54e-03 | 2.84e-03 | 69 |
| hsa0493238 | Esophagus | ESCC | Non-alcoholic fatty liver disease | 122/4205 | 155/8465 | 5.69e-14 | 1.59e-12 | 8.14e-13 | 122 |
| hsa0415213 | Esophagus | ESCC | AMPK signaling pathway | 80/4205 | 121/8465 | 1.73e-04 | 6.67e-04 | 3.42e-04 | 80 |
| hsa0491014 | Esophagus | ESCC | Insulin signaling pathway | 89/4205 | 137/8465 | 1.97e-04 | 7.32e-04 | 3.75e-04 | 89 |
| hsa0493113 | Esophagus | ESCC | Insulin resistance | 69/4205 | 108/8465 | 1.92e-03 | 5.54e-03 | 2.84e-03 | 69 |
| hsa0493242 | Liver | HCC | Non-alcoholic fatty liver disease | 124/4020 | 155/8465 | 4.54e-17 | 2.54e-15 | 1.41e-15 | 124 |
| hsa0491041 | Liver | HCC | Insulin signaling pathway | 95/4020 | 137/8465 | 1.53e-07 | 1.97e-06 | 1.10e-06 | 95 |
| hsa0493121 | Liver | HCC | Insulin resistance | 77/4020 | 108/8465 | 3.89e-07 | 4.46e-06 | 2.48e-06 | 77 |
| hsa049362 | Liver | HCC | Alcoholic liver disease | 89/4020 | 142/8465 | 1.73e-04 | 8.53e-04 | 4.75e-04 | 89 |
| hsa0415241 | Liver | HCC | AMPK signaling pathway | 77/4020 | 121/8465 | 2.32e-04 | 1.11e-03 | 6.18e-04 | 77 |
| hsa0493252 | Liver | HCC | Non-alcoholic fatty liver disease | 124/4020 | 155/8465 | 4.54e-17 | 2.54e-15 | 1.41e-15 | 124 |
| hsa0491051 | Liver | HCC | Insulin signaling pathway | 95/4020 | 137/8465 | 1.53e-07 | 1.97e-06 | 1.10e-06 | 95 |
| hsa0493131 | Liver | HCC | Insulin resistance | 77/4020 | 108/8465 | 3.89e-07 | 4.46e-06 | 2.48e-06 | 77 |
| Hugo Symbol | Variant Class | Variant Classification | dbSNP RS | HGVSc | HGVSp | HGVSp Short | SWISSPROT | BIOTYPE | SIFT | PolyPhen | Tumor Sample Barcode | Tissue | Histology | Sex | Age | Stage | Therapy Types | Drugs | Outcome |
| SREBF1 | SNV | Missense_Mutation | | c.2306G>A | p.Arg769His | p.R769H | P36956 | protein_coding | deleterious(0.04) | probably_damaging(0.96) | TCGA-A8-A07G-01 | Breast | breast invasive carcinoma | Female | >=65 | I/II | Chemotherapy | 5-fluorouracil | CR |
| SREBF1 | SNV | Missense_Mutation | | c.1247N>C | p.Ser416Thr | p.S416T | P36956 | protein_coding | tolerated(0.35) | benign(0.015) | TCGA-D8-A1JD-01 | Breast | breast invasive carcinoma | Female | <65 | I/II | Chemotherapy | adriamycin | SD |
| SREBF1 | insertion | In_Frame_Ins | novel | c.1439_1440insTGGCAG | p.Ser480_Gly481dup | p.S480_G481dup | P36956 | protein_coding | | | TCGA-E2-A1IF-01 | Breast | breast invasive carcinoma | Female | >=65 | I/II | Hormone Therapy | arimidex | SD |
| SREBF1 | SNV | Missense_Mutation | | c.3266N>A | p.Arg1089His | p.R1089H | P36956 | protein_coding | tolerated(0.55) | probably_damaging(0.999) | TCGA-DG-A2KK-01 | Cervix | cervical & endocervical cancer | Female | <65 | III/IV | Chemotherapy | cisplatin | SD |
| SREBF1 | SNV | Missense_Mutation | | c.571N>T | p.Pro191Ser | p.P191S | P36956 | protein_coding | tolerated(0.17) | probably_damaging(0.991) | TCGA-DR-A0ZM-01 | Cervix | cervical & endocervical cancer | Female | <65 | III/IV | Unspecific | Cisplatin | SD |
| SREBF1 | SNV | Missense_Mutation | | c.316N>G | p.Pro106Ala | p.P106A | P36956 | protein_coding | tolerated(0.29) | benign(0.143) | TCGA-DR-A0ZM-01 | Cervix | cervical & endocervical cancer | Female | <65 | III/IV | Unspecific | Cisplatin | SD |
| SREBF1 | SNV | Missense_Mutation | novel | c.1348N>A | p.Glu450Lys | p.E450K | P36956 | protein_coding | tolerated(0.11) | probably_damaging(0.995) | TCGA-DS-A1OB-01 | Cervix | cervical & endocervical cancer | Female | <65 | I/II | Chemotherapy | carboplatin | PD |
| SREBF1 | SNV | Missense_Mutation | | c.1846N>T | p.Arg616Cys | p.R616C | P36956 | protein_coding | deleterious(0) | probably_damaging(0.999) | TCGA-EK-A2RB-01 | Cervix | cervical & endocervical cancer | Female | <65 | I/II | Unknown | Unknown | SD |
| SREBF1 | SNV | Missense_Mutation | rs868055320 | c.3168N>T | p.Gln1056His | p.Q1056H | P36956 | protein_coding | tolerated(0.35) | benign(0.07) | TCGA-VS-A94X-01 | Cervix | cervical & endocervical cancer | Female | <65 | I/II | Chemotherapy | cisplatin | PD |
| SREBF1 | SNV | Missense_Mutation | novel | c.1040N>T | p.Ser347Phe | p.S347F | P36956 | protein_coding | tolerated(0.67) | possibly_damaging(0.7) | TCGA-VS-A94X-01 | Cervix | cervical & endocervical cancer | Female | <65 | I/II | Chemotherapy | cisplatin | PD |
| Entrez ID | Symbol | Category | Interaction Types | Drug Claim Name | Drug Name | PMIDs |
| 6720 | SREBF1 | NUCLEAR HORMONE RECEPTOR, TRANSCRIPTION FACTOR | | fluvastatin | FLUVASTATIN | |
| 6720 | SREBF1 | NUCLEAR HORMONE RECEPTOR, TRANSCRIPTION FACTOR | | hmg coa reductase inhibitors | | 24329191 |
| 6720 | SREBF1 | NUCLEAR HORMONE RECEPTOR, TRANSCRIPTION FACTOR | | INSULIN | INSULIN | 10627507,12576518,14594997 |
| 6720 | SREBF1 | NUCLEAR HORMONE RECEPTOR, TRANSCRIPTION FACTOR | | NEUROTROPHIC FACTOR | | 12788519 |


