
|
|||||
|
 | |
| |
| |
| |
| |
| |
|
Gene: SETD2 |
Gene summary for SETD2 |
| Gene information | Species | Human | Gene symbol | SETD2 | Gene ID | 29072 |
| Gene name | SET domain containing 2, histone lysine methyltransferase | |
| Gene Alias | HBP231 | |
| Cytomap | 3p21.31 | |
| Gene Type | protein-coding | GO ID | GO:0000003 | UniProtAcc | Q9BYW2 |
Top |
Malignant transformation analysis |
| Identification of the aberrant gene expression in precancerous and cancerous lesions by comparing the gene expression of stem-like cells in diseased tissues with normal stem cells |
| Entrez ID | Symbol | Replicates | Species | Organ | Tissue | Adj P-value | Log2FC | Malignancy |
| 29072 | SETD2 | CCI_2 | Human | Cervix | CC | 1.75e-09 | 1.02e+00 | 0.5249 |
| 29072 | SETD2 | CCI_3 | Human | Cervix | CC | 9.30e-10 | 1.16e+00 | 0.516 |
| 29072 | SETD2 | HTA11_3410_2000001011 | Human | Colorectum | AD | 3.73e-22 | -6.13e-01 | 0.0155 |
| 29072 | SETD2 | HTA11_2487_2000001011 | Human | Colorectum | SER | 2.63e-02 | -4.20e-01 | -0.1808 |
| 29072 | SETD2 | HTA11_3361_2000001011 | Human | Colorectum | AD | 6.42e-03 | -4.45e-01 | -0.1207 |
| 29072 | SETD2 | HTA11_9341_2000001011 | Human | Colorectum | SER | 2.30e-03 | -8.93e-01 | -0.00410000000000005 |
| 29072 | SETD2 | HTA11_7862_2000001011 | Human | Colorectum | AD | 6.11e-03 | -5.08e-01 | -0.0179 |
| 29072 | SETD2 | HTA11_866_3004761011 | Human | Colorectum | AD | 1.32e-03 | -4.00e-01 | 0.096 |
| 29072 | SETD2 | HTA11_10711_2000001011 | Human | Colorectum | AD | 5.00e-04 | -4.49e-01 | 0.0338 |
| 29072 | SETD2 | HTA11_7696_3000711011 | Human | Colorectum | AD | 1.28e-05 | -3.82e-01 | 0.0674 |
| 29072 | SETD2 | HTA11_6818_2000001021 | Human | Colorectum | AD | 3.93e-05 | -5.09e-01 | 0.0588 |
| 29072 | SETD2 | HTA11_99999970781_79442 | Human | Colorectum | MSS | 4.12e-06 | -3.97e-01 | 0.294 |
| 29072 | SETD2 | HTA11_99999973899_84307 | Human | Colorectum | MSS | 6.45e-08 | -6.08e-01 | 0.2585 |
| 29072 | SETD2 | HTA11_99999974143_84620 | Human | Colorectum | MSS | 4.21e-13 | -5.82e-01 | 0.3005 |
| 29072 | SETD2 | F007 | Human | Colorectum | FAP | 1.14e-02 | -1.36e-01 | 0.1176 |
| 29072 | SETD2 | A001-C-207 | Human | Colorectum | FAP | 3.17e-06 | -1.97e-01 | 0.1278 |
| 29072 | SETD2 | A015-C-203 | Human | Colorectum | FAP | 1.96e-33 | -3.71e-01 | -0.1294 |
| 29072 | SETD2 | A015-C-204 | Human | Colorectum | FAP | 7.34e-08 | -1.91e-01 | -0.0228 |
| 29072 | SETD2 | A014-C-040 | Human | Colorectum | FAP | 3.20e-09 | -4.89e-01 | -0.1184 |
| 29072 | SETD2 | A002-C-201 | Human | Colorectum | FAP | 7.80e-22 | -3.39e-01 | 0.0324 |
| Page: 1 2 3 4 5 6 7 8 9 10 |
| Tissue | Expression Dynamics | Abbreviation |
| Cervix | 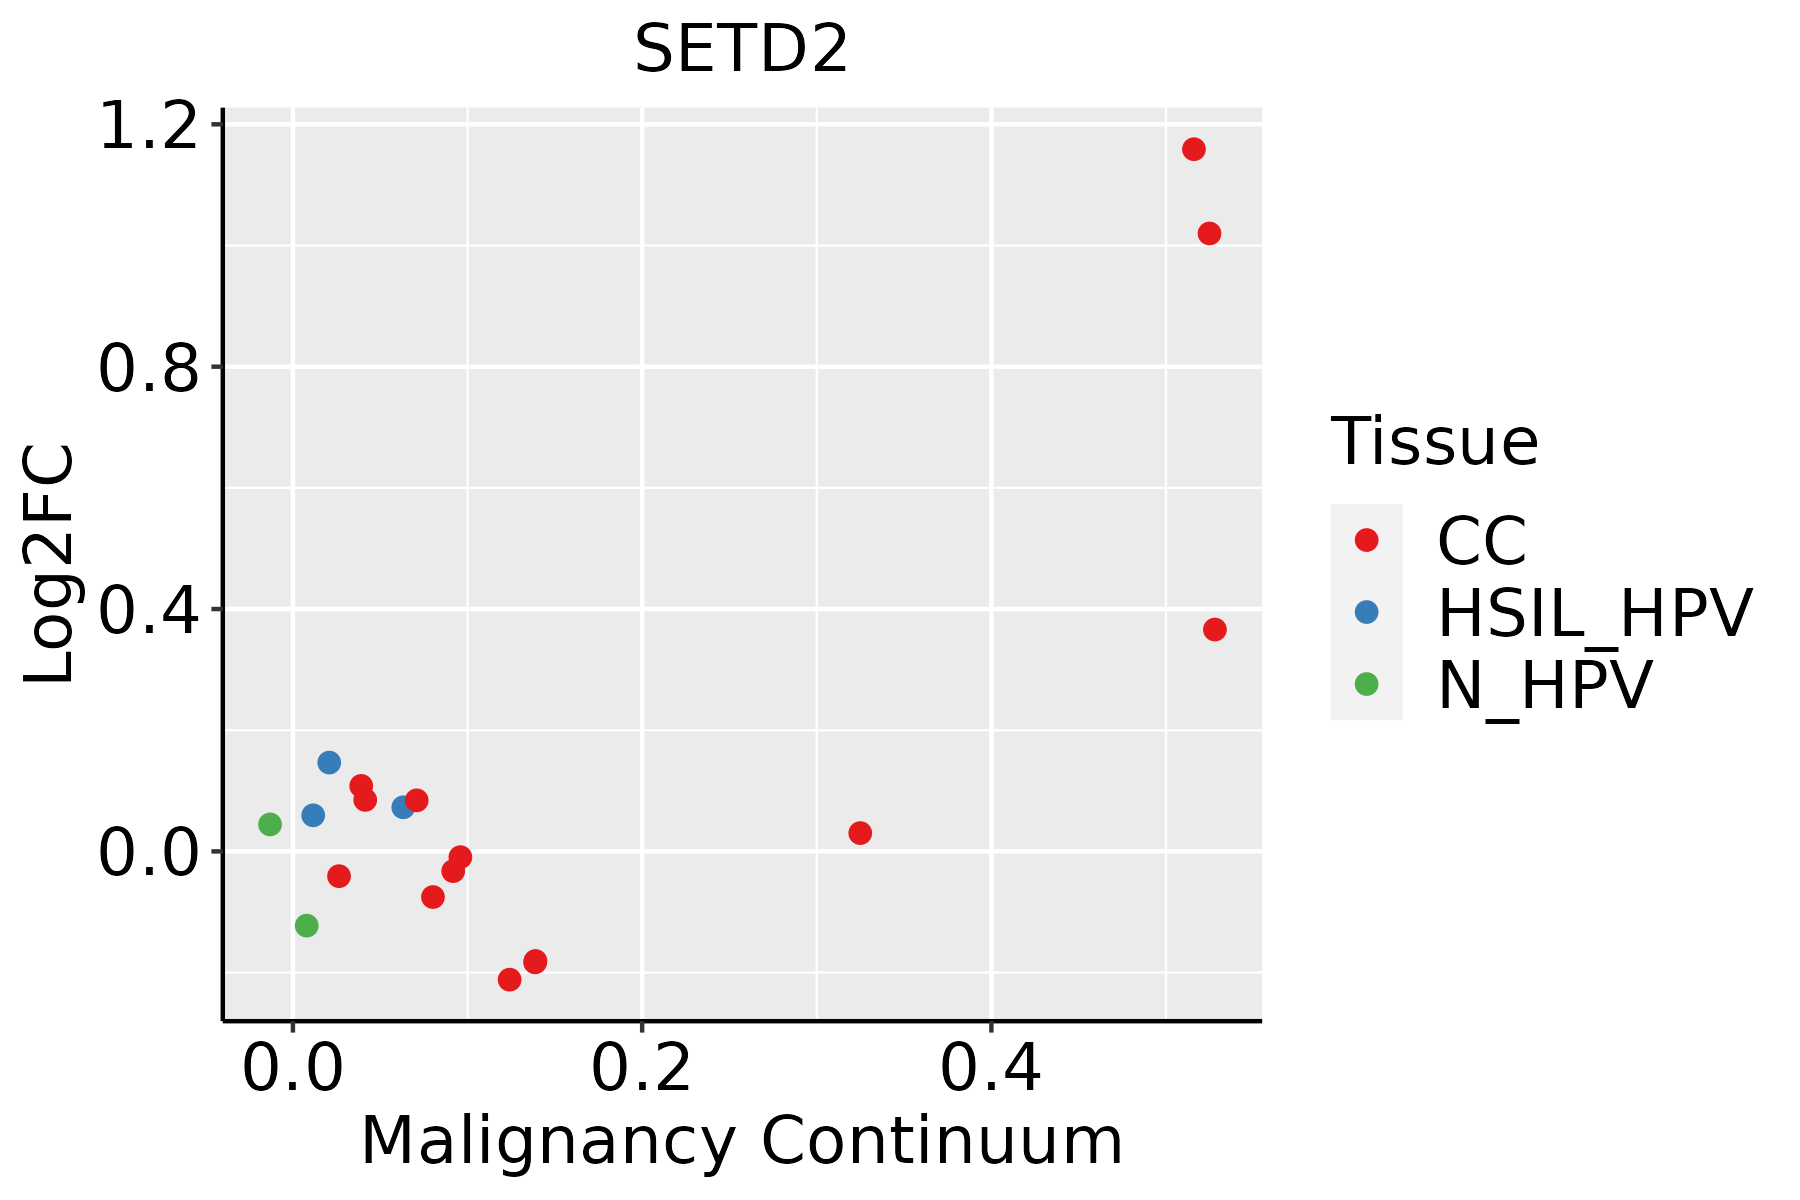 | CC: Cervix cancer |
| HSIL_HPV: HPV-infected high-grade squamous intraepithelial lesions | ||
| N_HPV: HPV-infected normal cervix | ||
| Colorectum (GSE201348) |  | FAP: Familial adenomatous polyposis |
| CRC: Colorectal cancer | ||
| Colorectum (HTA11) |  | AD: Adenomas |
| SER: Sessile serrated lesions | ||
| MSI-H: Microsatellite-high colorectal cancer | ||
| MSS: Microsatellite stable colorectal cancer | ||
| Esophagus |  | ESCC: Esophageal squamous cell carcinoma |
| HGIN: High-grade intraepithelial neoplasias | ||
| LGIN: Low-grade intraepithelial neoplasias | ||
| Liver | 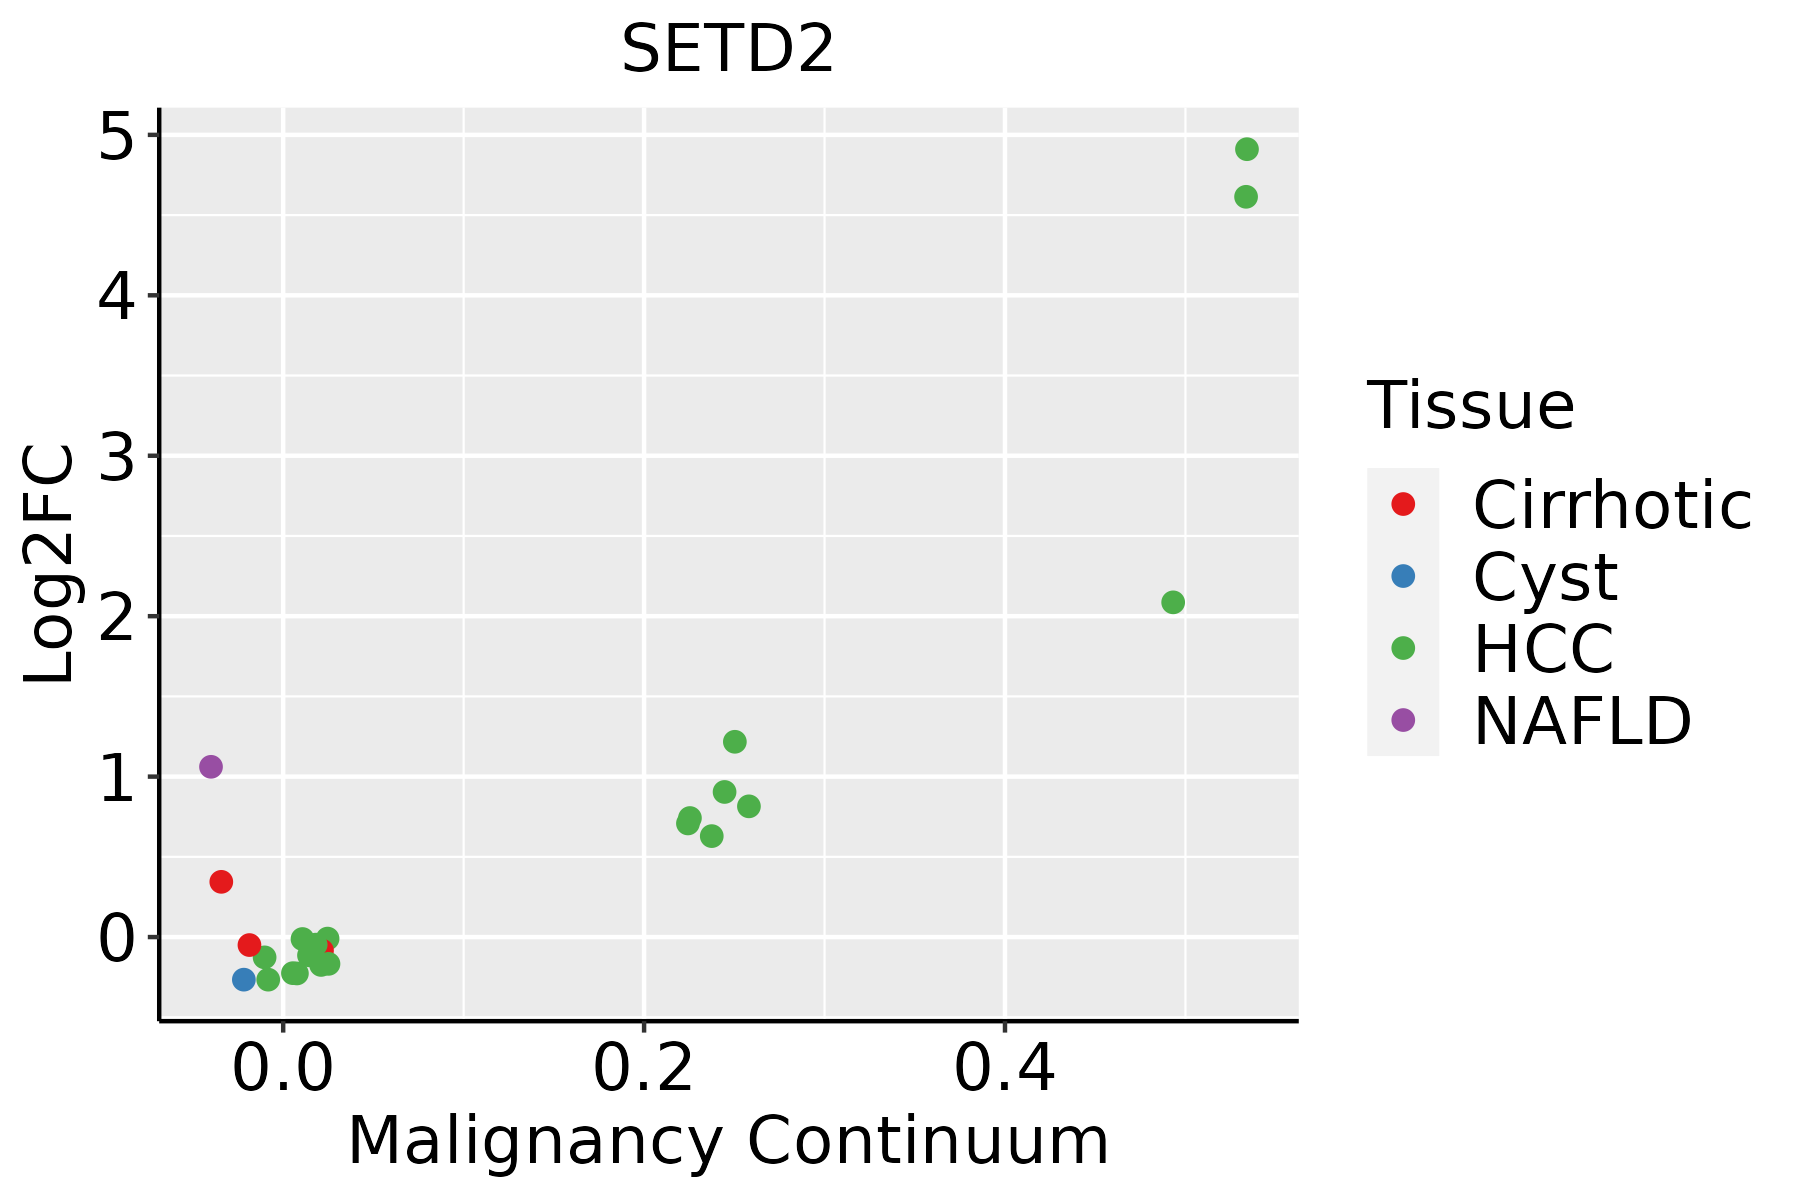 | HCC: Hepatocellular carcinoma |
| NAFLD: Non-alcoholic fatty liver disease | ||
| Lung | 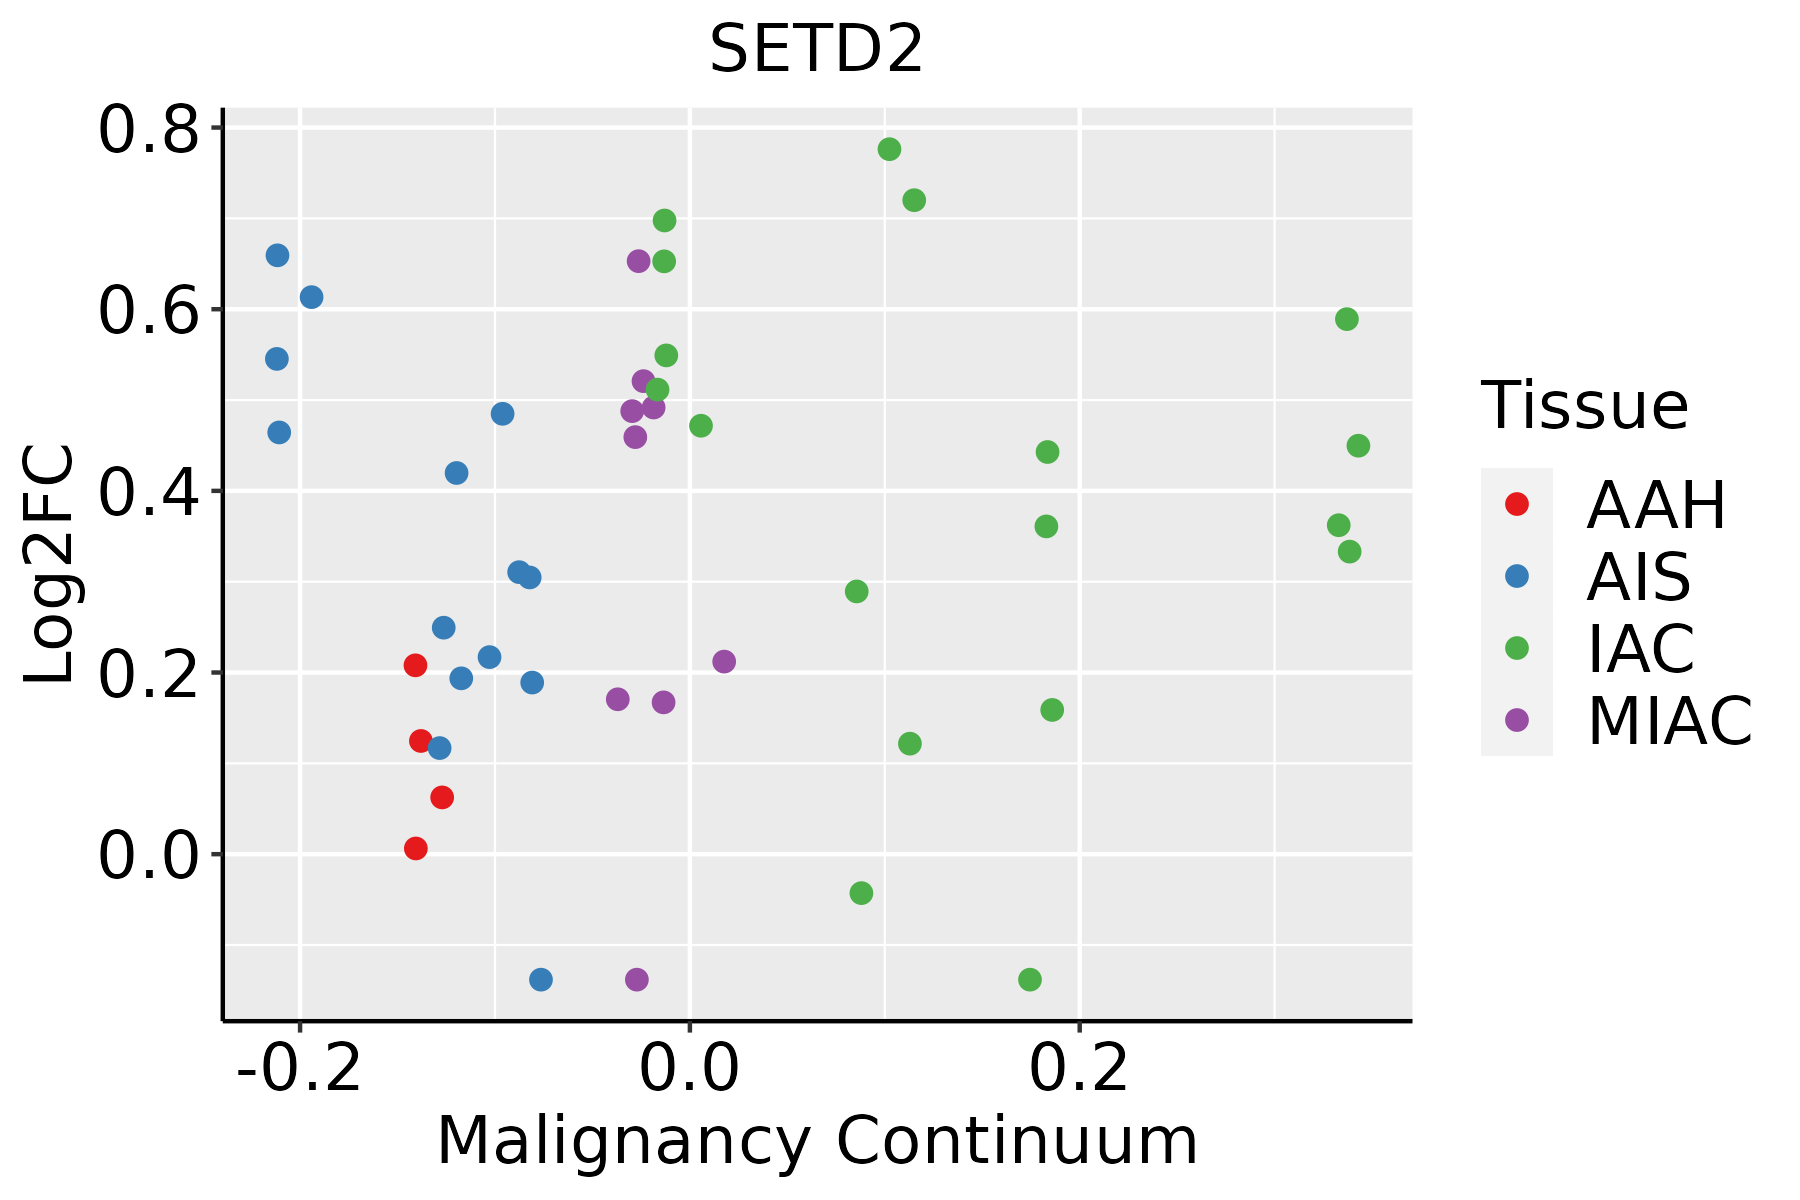 | AAH: Atypical adenomatous hyperplasia |
| AIS: Adenocarcinoma in situ | ||
| IAC: Invasive lung adenocarcinoma | ||
| MIA: Minimally invasive adenocarcinoma | ||
| Prostate |  | BPH: Benign Prostatic Hyperplasia |
| Skin |  | AK: Actinic keratosis |
| cSCC: Cutaneous squamous cell carcinoma | ||
| SCCIS:squamous cell carcinoma in situ | ||
| Thyroid | 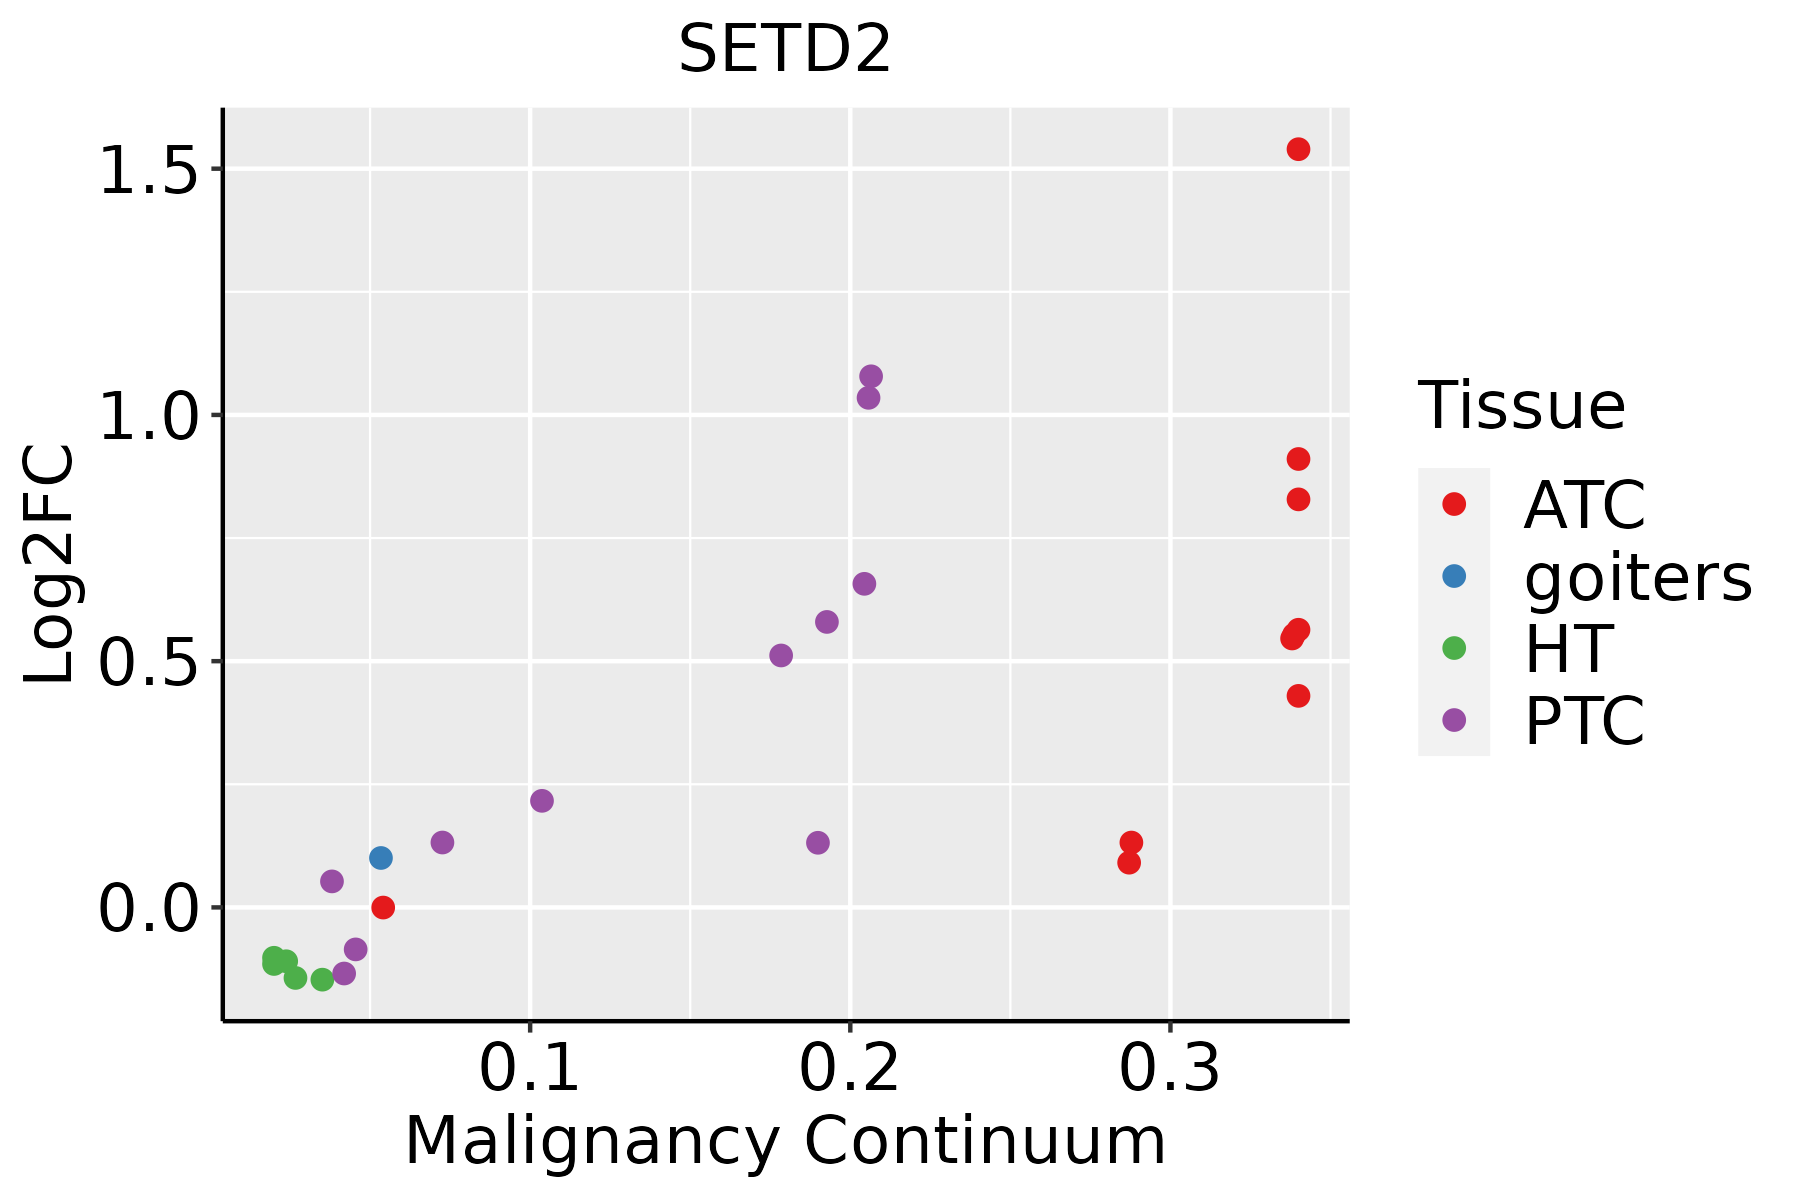 | ATC: Anaplastic thyroid cancer |
| HT: Hashimoto's thyroiditis | ||
| PTC: Papillary thyroid cancer |
| ∗log2FC in expression of this searched gene in stem-like cells from each diseased tissue sample relative to stem-like cells in normal samples in each tissue plotted against the malignancy continuum. Samples are colored based on if they are from different disease stage. |
Top |
Malignant transformation related pathway analysis |
| Find out the enriched GO biological processes and KEGG pathways involved in transition from healthy to precancer to cancer |
| Tissue | Disease Stage | Enriched GO biological Processes |
| Colorectum | AD |  |
| Colorectum | SER |  |
| Colorectum | MSS |  |
| Colorectum | MSI-H |  |
| Colorectum | FAP |  |
| ∗Top 15 enriched GO BP terms are showed in the bar plot of each disease state in each tissue. Each row represents a significant GO biological process which is colored according to the -log10(p.adjust). |
| Page: 1 2 3 4 5 6 7 8 9 |
| GO ID | Tissue | Disease Stage | Description | Gene Ratio | Bg Ratio | pvalue | p.adjust | Count |
| GO:001593117 | Esophagus | ESCC | nucleobase-containing compound transport | 162/8552 | 222/18723 | 9.87e-17 | 7.93e-15 | 162 |
| GO:190285015 | Esophagus | ESCC | microtubule cytoskeleton organization involved in mitosis | 116/8552 | 147/18723 | 1.25e-16 | 9.91e-15 | 116 |
| GO:000170119 | Esophagus | ESCC | in utero embryonic development | 243/8552 | 367/18723 | 1.00e-15 | 6.86e-14 | 243 |
| GO:0046822110 | Esophagus | ESCC | regulation of nucleocytoplasmic transport | 88/8552 | 106/18723 | 1.88e-15 | 1.19e-13 | 88 |
| GO:000961518 | Esophagus | ESCC | response to virus | 238/8552 | 367/18723 | 6.65e-14 | 3.32e-12 | 238 |
| GO:000635414 | Esophagus | ESCC | DNA-templated transcription, elongation | 76/8552 | 91/18723 | 8.35e-14 | 4.11e-12 | 76 |
| GO:005105215 | Esophagus | ESCC | regulation of DNA metabolic process | 232/8552 | 359/18723 | 2.40e-13 | 1.13e-11 | 232 |
| GO:007116612 | Esophagus | ESCC | ribonucleoprotein complex localization | 66/8552 | 77/18723 | 2.94e-13 | 1.38e-11 | 66 |
| GO:007142612 | Esophagus | ESCC | ribonucleoprotein complex export from nucleus | 65/8552 | 76/18723 | 5.56e-13 | 2.50e-11 | 65 |
| GO:000640512 | Esophagus | ESCC | RNA export from nucleus | 68/8552 | 84/18723 | 2.99e-11 | 1.01e-09 | 68 |
| GO:00064064 | Esophagus | ESCC | mRNA export from nucleus | 51/8552 | 59/18723 | 7.98e-11 | 2.47e-09 | 51 |
| GO:00714274 | Esophagus | ESCC | mRNA-containing ribonucleoprotein complex export from nucleus | 51/8552 | 59/18723 | 7.98e-11 | 2.47e-09 | 51 |
| GO:00434143 | Esophagus | ESCC | macromolecule methylation | 199/8552 | 316/18723 | 3.44e-10 | 9.57e-09 | 199 |
| GO:00516075 | Esophagus | ESCC | defense response to virus | 171/8552 | 265/18723 | 3.91e-10 | 1.05e-08 | 171 |
| GO:01405465 | Esophagus | ESCC | defense response to symbiont | 171/8552 | 265/18723 | 3.91e-10 | 1.05e-08 | 171 |
| GO:2001020110 | Esophagus | ESCC | regulation of response to DNA damage stimulus | 145/8552 | 219/18723 | 5.97e-10 | 1.50e-08 | 145 |
| GO:000636814 | Esophagus | ESCC | transcription elongation from RNA polymerase II promoter | 56/8552 | 69/18723 | 1.40e-09 | 3.30e-08 | 56 |
| GO:00322592 | Esophagus | ESCC | methylation | 222/8552 | 364/18723 | 2.26e-09 | 5.09e-08 | 222 |
| GO:003450211 | Esophagus | ESCC | protein localization to chromosome | 70/8552 | 92/18723 | 2.54e-09 | 5.64e-08 | 70 |
| GO:003434013 | Esophagus | ESCC | response to type I interferon | 48/8552 | 58/18723 | 6.18e-09 | 1.26e-07 | 48 |
| Page: 1 2 3 4 5 6 7 8 9 10 11 12 13 14 15 16 17 18 19 20 21 22 23 24 25 26 27 28 29 30 31 32 33 34 35 36 37 38 39 40 41 42 43 44 45 46 47 48 49 50 |
| Pathway ID | Tissue | Disease Stage | Description | Gene Ratio | Bg Ratio | pvalue | p.adjust | qvalue | Count |
| hsa00310 | Colorectum | AD | Lysine degradation | 27/2092 | 63/8465 | 1.17e-03 | 7.75e-03 | 4.94e-03 | 27 |
| hsa003101 | Colorectum | AD | Lysine degradation | 27/2092 | 63/8465 | 1.17e-03 | 7.75e-03 | 4.94e-03 | 27 |
| hsa003102 | Colorectum | MSS | Lysine degradation | 24/1875 | 63/8465 | 2.94e-03 | 1.39e-02 | 8.50e-03 | 24 |
| hsa003103 | Colorectum | MSS | Lysine degradation | 24/1875 | 63/8465 | 2.94e-03 | 1.39e-02 | 8.50e-03 | 24 |
| hsa003104 | Colorectum | FAP | Lysine degradation | 23/1404 | 63/8465 | 1.04e-04 | 9.46e-04 | 5.76e-04 | 23 |
| hsa003105 | Colorectum | FAP | Lysine degradation | 23/1404 | 63/8465 | 1.04e-04 | 9.46e-04 | 5.76e-04 | 23 |
| hsa003106 | Colorectum | CRC | Lysine degradation | 18/1091 | 63/8465 | 7.21e-04 | 6.34e-03 | 4.30e-03 | 18 |
| hsa003107 | Colorectum | CRC | Lysine degradation | 18/1091 | 63/8465 | 7.21e-04 | 6.34e-03 | 4.30e-03 | 18 |
| hsa0031010 | Esophagus | ESCC | Lysine degradation | 41/4205 | 63/8465 | 9.63e-03 | 2.27e-02 | 1.16e-02 | 41 |
| hsa0031013 | Esophagus | ESCC | Lysine degradation | 41/4205 | 63/8465 | 9.63e-03 | 2.27e-02 | 1.16e-02 | 41 |
| hsa003108 | Liver | NAFLD | Lysine degradation | 21/1043 | 63/8465 | 1.09e-05 | 3.58e-04 | 2.89e-04 | 21 |
| hsa0031011 | Liver | NAFLD | Lysine degradation | 21/1043 | 63/8465 | 1.09e-05 | 3.58e-04 | 2.89e-04 | 21 |
| hsa0031021 | Liver | Cirrhotic | Lysine degradation | 29/2530 | 63/8465 | 4.81e-03 | 1.74e-02 | 1.07e-02 | 29 |
| hsa0031031 | Liver | Cirrhotic | Lysine degradation | 29/2530 | 63/8465 | 4.81e-03 | 1.74e-02 | 1.07e-02 | 29 |
| hsa0031041 | Liver | HCC | Lysine degradation | 47/4020 | 63/8465 | 1.02e-05 | 7.58e-05 | 4.22e-05 | 47 |
| hsa0031051 | Liver | HCC | Lysine degradation | 47/4020 | 63/8465 | 1.02e-05 | 7.58e-05 | 4.22e-05 | 47 |
| hsa003109 | Lung | IAC | Lysine degradation | 17/1053 | 63/8465 | 1.35e-03 | 8.63e-03 | 5.73e-03 | 17 |
| hsa0031012 | Lung | IAC | Lysine degradation | 17/1053 | 63/8465 | 1.35e-03 | 8.63e-03 | 5.73e-03 | 17 |
| Page: 1 |
Top |
Cell-cell communication analysis |
| Identification of potential cell-cell interactions between two cell types and their ligand-receptor pairs for different disease states |
| Ligand | Receptor | LRpair | Pathway | Tissue | Disease Stage |
| Page: 1 |
Top |
Single-cell gene regulatory network inference analysis |
| Find out the significant the regulons (TFs) and the target genes of each regulon across cell types for different disease states |
| TF | Cell Type | Tissue | Disease Stage | Target Gene | RSS | Regulon Activity |
| ∗The dot plots of a searched regulon are shown for all cell subpopulations in each disease state of each tissue based on the regulon specific score inferred using pySCENIC and by calculating the average expression. |
| Page: 1 |
Top |
Somatic mutation of malignant transformation related genes |
| Annotation of somatic variants for genes involved in malignant transformation |
| Hugo Symbol | Variant Class | Variant Classification | dbSNP RS | HGVSc | HGVSp | HGVSp Short | SWISSPROT | BIOTYPE | SIFT | PolyPhen | Tumor Sample Barcode | Tissue | Histology | Sex | Age | Stage | Therapy Types | Drugs | Outcome |
| SETD2 | SNV | Missense_Mutation | c.7469G>A | p.Arg2490Gln | p.R2490Q | Q9BYW2 | protein_coding | deleterious(0.02) | possibly_damaging(0.785) | TCGA-A8-A09E-01 | Breast | breast invasive carcinoma | Female | >=65 | III/IV | Hormone Therapy | anastrozole | SD | |
| SETD2 | SNV | Missense_Mutation | novel | c.6355N>A | p.Glu2119Lys | p.E2119K | Q9BYW2 | protein_coding | deleterious(0) | probably_damaging(0.994) | TCGA-AC-A5XS-01 | Breast | breast invasive carcinoma | Female | >=65 | I/II | Hormone Therapy | femara | SD |
| SETD2 | SNV | Missense_Mutation | c.6071N>A | p.Arg2024Gln | p.R2024Q | Q9BYW2 | protein_coding | deleterious(0) | probably_damaging(0.992) | TCGA-AN-A046-01 | Breast | breast invasive carcinoma | Female | >=65 | I/II | Unknown | Unknown | SD | |
| SETD2 | SNV | Missense_Mutation | novel | c.3713N>A | p.Ser1238Tyr | p.S1238Y | Q9BYW2 | protein_coding | tolerated_low_confidence(0.08) | benign(0.125) | TCGA-AN-A046-01 | Breast | breast invasive carcinoma | Female | >=65 | I/II | Unknown | Unknown | SD |
| SETD2 | SNV | Missense_Mutation | c.1736N>G | p.Asn579Ser | p.N579S | Q9BYW2 | protein_coding | tolerated_low_confidence(0.48) | benign(0) | TCGA-AO-A03T-01 | Breast | breast invasive carcinoma | Female | <65 | I/II | Chemotherapy | cyclophosphamide | SD | |
| SETD2 | SNV | Missense_Mutation | novel | c.5004C>G | p.Phe1668Leu | p.F1668L | Q9BYW2 | protein_coding | deleterious(0.02) | probably_damaging(0.985) | TCGA-BH-A0GZ-01 | Breast | breast invasive carcinoma | Female | <65 | I/II | Hormone Therapy | arimidex | SD |
| SETD2 | SNV | Missense_Mutation | c.1012G>C | p.Asp338His | p.D338H | Q9BYW2 | protein_coding | deleterious_low_confidence(0) | probably_damaging(0.956) | TCGA-BH-A0W7-01 | Breast | breast invasive carcinoma | Female | <65 | I/II | Chemotherapy | taxotere | CR | |
| SETD2 | SNV | Missense_Mutation | c.6604C>T | p.Pro2202Ser | p.P2202S | Q9BYW2 | protein_coding | tolerated(0.49) | benign(0.001) | TCGA-C8-A131-01 | Breast | breast invasive carcinoma | Female | >=65 | III/IV | Chemotherapy | 5-fluorouracil | CR | |
| SETD2 | SNV | Missense_Mutation | c.4874N>T | p.Arg1625Leu | p.R1625L | Q9BYW2 | protein_coding | deleterious(0) | probably_damaging(0.999) | TCGA-C8-A274-01 | Breast | breast invasive carcinoma | Female | <65 | I/II | Hormone Therapy | tamoxiphen | SD | |
| SETD2 | SNV | Missense_Mutation | c.1760N>G | p.Ser587Cys | p.S587C | Q9BYW2 | protein_coding | tolerated_low_confidence(0.12) | benign(0.014) | TCGA-D8-A1JA-01 | Breast | breast invasive carcinoma | Female | <65 | III/IV | Chemotherapy | adriamycin | PD |
| Page: 1 2 3 4 5 6 7 8 9 10 11 12 13 14 15 16 17 18 19 20 21 22 23 24 25 26 27 28 29 30 |
Top |
Related drugs of malignant transformation related genes |
| Identification of chemicals and drugs interact with genes involved in malignant transfromation |
| (DGIdb 4.0) |
| Entrez ID | Symbol | Category | Interaction Types | Drug Claim Name | Drug Name | PMIDs |
| 29072 | SETD2 | CLINICALLY ACTIONABLE, ENZYME, METHYL TRANSFERASE | Cyclic octapeptide derivative 1 | |||
| 29072 | SETD2 | CLINICALLY ACTIONABLE, ENZYME, METHYL TRANSFERASE | 2,2-dimethylbenzopyran derivative 1 | |||
| 29072 | SETD2 | CLINICALLY ACTIONABLE, ENZYME, METHYL TRANSFERASE | HIF-1alpha | |||
| 29072 | SETD2 | CLINICALLY ACTIONABLE, ENZYME, METHYL TRANSFERASE | PMID26882240-Compound-32 | |||
| 29072 | SETD2 | CLINICALLY ACTIONABLE, ENZYME, METHYL TRANSFERASE | PX-478 | PX-478 | ||
| 29072 | SETD2 | CLINICALLY ACTIONABLE, ENZYME, METHYL TRANSFERASE | Pyrrolidine carboxamide derivative 1 | |||
| 29072 | SETD2 | CLINICALLY ACTIONABLE, ENZYME, METHYL TRANSFERASE | PMID26882240-Compound-2 | |||
| 29072 | SETD2 | CLINICALLY ACTIONABLE, ENZYME, METHYL TRANSFERASE | 2,2-dimethylbenzopyran derivative 2 | |||
| 29072 | SETD2 | CLINICALLY ACTIONABLE, ENZYME, METHYL TRANSFERASE | Imidazo [1,2-a]pyridine compound 1 | |||
| 29072 | SETD2 | CLINICALLY ACTIONABLE, ENZYME, METHYL TRANSFERASE | PMID26882240-Compound-14 |
| Page: 1 2 3 4 |

Copyright 2023-Present -The University of Texas Health Science Center at Houston |