
|
|||||
|
 | |
| |
| |
| |
| |
| |
|
Gene: RRAS |
Gene summary for RRAS |
| Gene information | Species | Human | Gene symbol | RRAS | Gene ID | 6237 |
| Gene name | RAS related | |
| Gene Alias | R-Ras | |
| Cytomap | 19q13.33 | |
| Gene Type | protein-coding | GO ID | GO:0000165 | UniProtAcc | A0A024QZF2 |
Top |
Malignant transformation analysis |
| Identification of the aberrant gene expression in precancerous and cancerous lesions by comparing the gene expression of stem-like cells in diseased tissues with normal stem cells |
| Entrez ID | Symbol | Replicates | Species | Organ | Tissue | Adj P-value | Log2FC | Malignancy |
| 6237 | RRAS | GSM4909295 | Human | Breast | IDC | 2.85e-04 | 4.06e-01 | 0.0898 |
| 6237 | RRAS | GSM4909304 | Human | Breast | IDC | 5.56e-18 | 5.02e-01 | 0.1636 |
| 6237 | RRAS | GSM4909311 | Human | Breast | IDC | 2.34e-05 | -9.98e-02 | 0.1534 |
| 6237 | RRAS | GSM4909315 | Human | Breast | IDC | 1.00e-21 | 6.95e-01 | 0.21 |
| 6237 | RRAS | GSM4909316 | Human | Breast | IDC | 2.44e-11 | 7.17e-01 | 0.21 |
| 6237 | RRAS | GSM4909319 | Human | Breast | IDC | 3.66e-07 | -5.27e-02 | 0.1563 |
| 6237 | RRAS | DCIS2 | Human | Breast | DCIS | 2.67e-45 | 1.98e-01 | 0.0085 |
| 6237 | RRAS | CA_HPV_1 | Human | Cervix | CC | 1.78e-02 | -1.49e-01 | 0.0264 |
| 6237 | RRAS | CCII_1 | Human | Cervix | CC | 3.71e-03 | -2.61e-01 | 0.3249 |
| 6237 | RRAS | Tumor | Human | Cervix | CC | 3.38e-18 | 5.06e-01 | 0.1241 |
| 6237 | RRAS | sample3 | Human | Cervix | CC | 2.98e-22 | 5.59e-01 | 0.1387 |
| 6237 | RRAS | T3 | Human | Cervix | CC | 1.77e-23 | 5.06e-01 | 0.1389 |
| 6237 | RRAS | HTA11_2487_2000001011 | Human | Colorectum | SER | 3.31e-22 | 6.88e-01 | -0.1808 |
| 6237 | RRAS | HTA11_1938_2000001011 | Human | Colorectum | AD | 2.70e-23 | 7.27e-01 | -0.0811 |
| 6237 | RRAS | HTA11_78_2000001011 | Human | Colorectum | AD | 4.92e-04 | 1.84e-01 | -0.1088 |
| 6237 | RRAS | HTA11_347_2000001011 | Human | Colorectum | AD | 1.17e-07 | 2.37e-01 | -0.1954 |
| 6237 | RRAS | HTA11_411_2000001011 | Human | Colorectum | SER | 3.46e-11 | 1.28e+00 | -0.2602 |
| 6237 | RRAS | HTA11_2112_2000001011 | Human | Colorectum | SER | 3.00e-07 | 6.06e-01 | -0.2196 |
| 6237 | RRAS | HTA11_3361_2000001011 | Human | Colorectum | AD | 4.39e-05 | 3.21e-01 | -0.1207 |
| 6237 | RRAS | HTA11_696_2000001011 | Human | Colorectum | AD | 8.08e-14 | 3.57e-01 | -0.1464 |
| Page: 1 2 3 4 5 6 7 |
| Tissue | Expression Dynamics | Abbreviation |
| Breast | 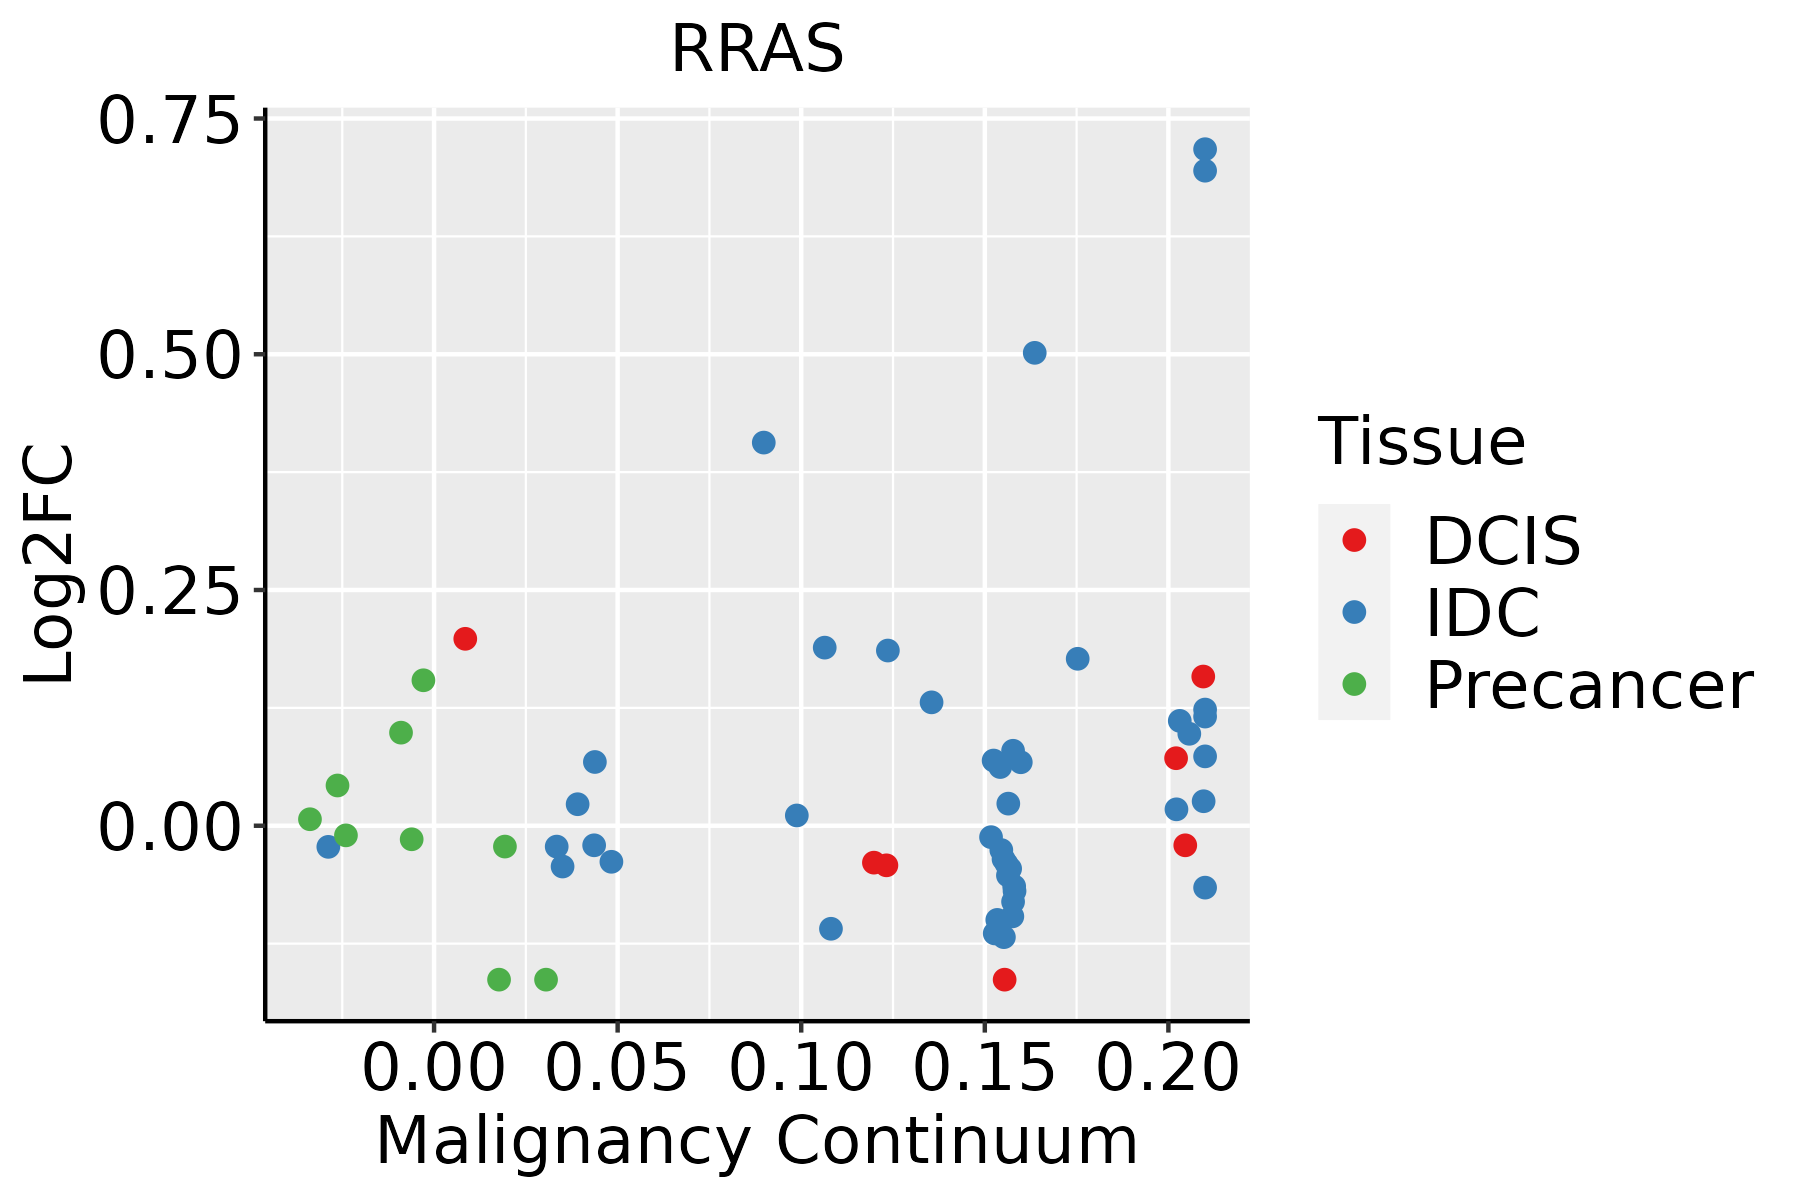 | IDC: Invasive ductal carcinoma |
| DCIS: Ductal carcinoma in situ | ||
| Precancer(BRCA1-mut): Precancerous lesion from BRCA1 mutation carriers | ||
| Cervix | 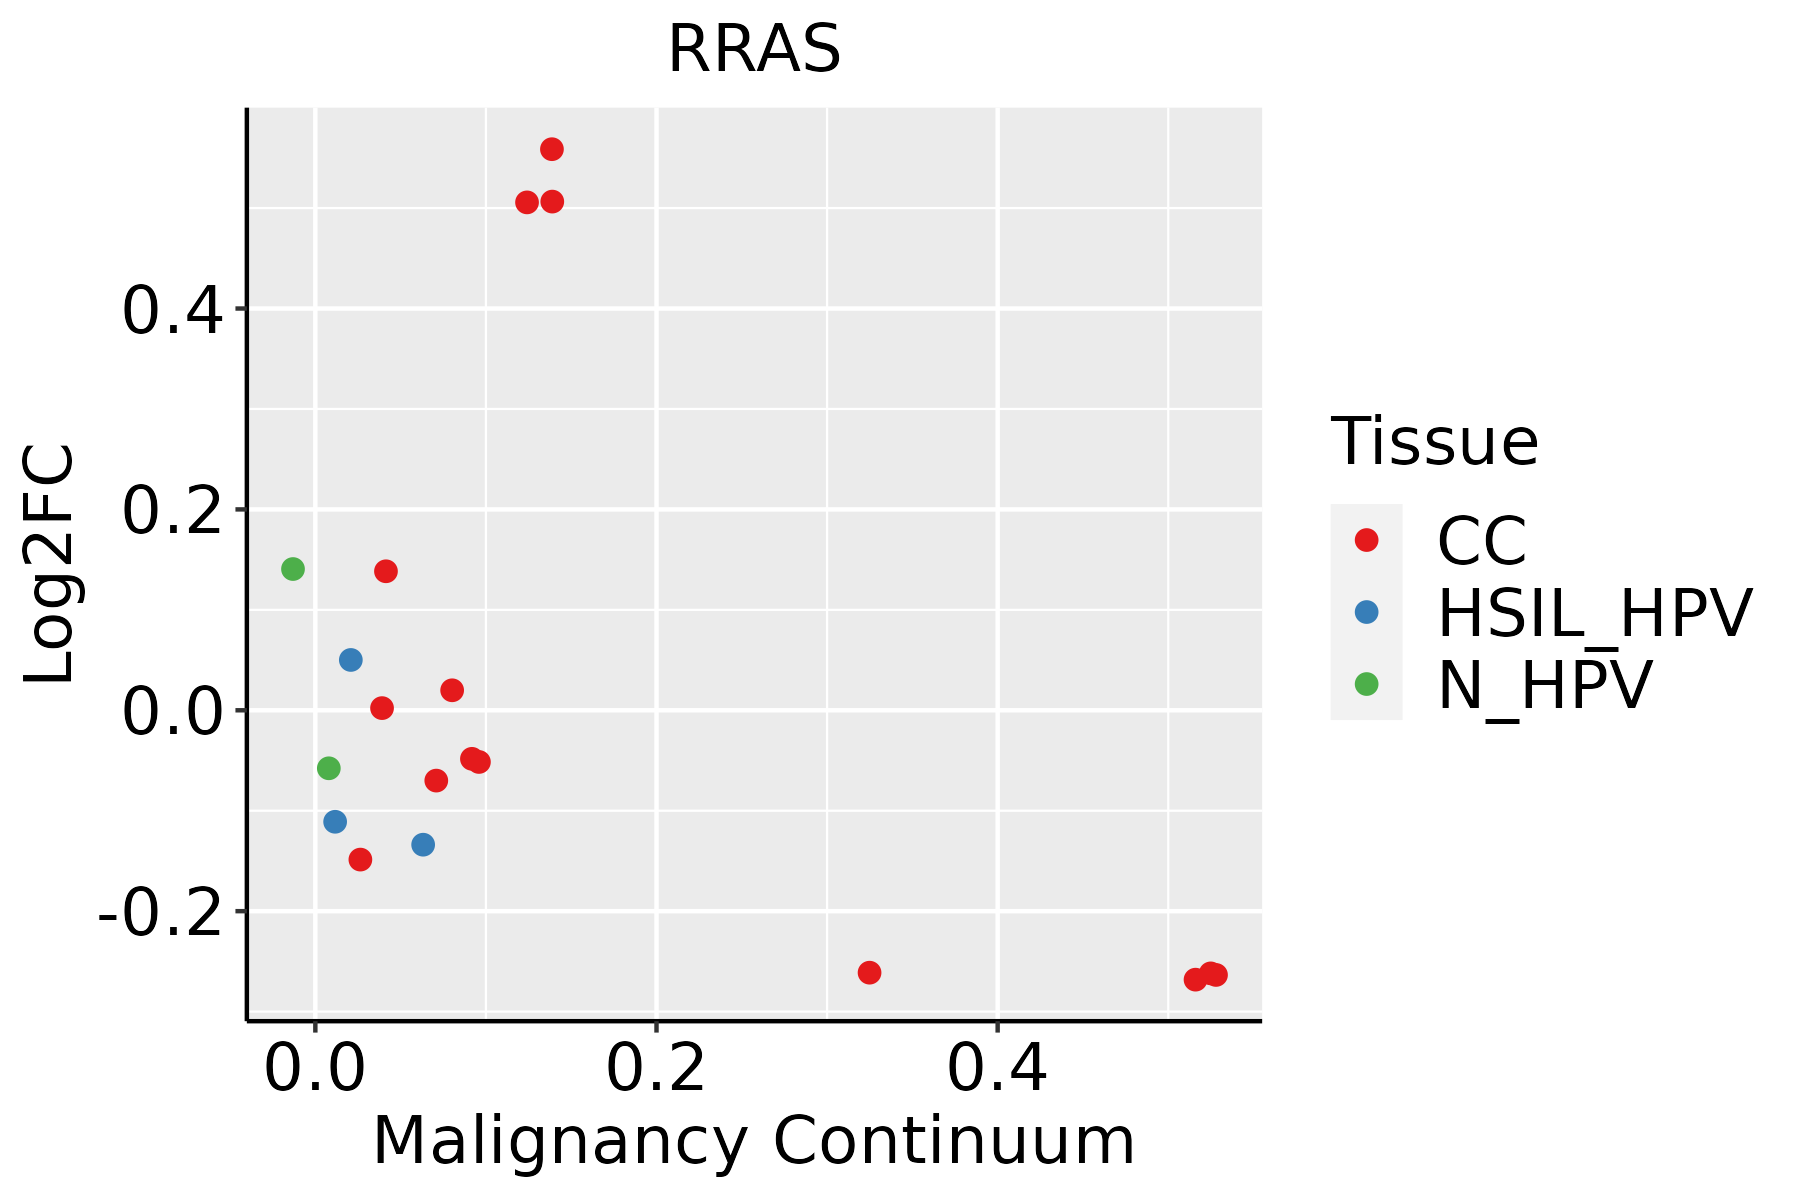 | CC: Cervix cancer |
| HSIL_HPV: HPV-infected high-grade squamous intraepithelial lesions | ||
| N_HPV: HPV-infected normal cervix | ||
| Colorectum (GSE201348) |  | FAP: Familial adenomatous polyposis |
| CRC: Colorectal cancer | ||
| Colorectum (HTA11) |  | AD: Adenomas |
| SER: Sessile serrated lesions | ||
| MSI-H: Microsatellite-high colorectal cancer | ||
| MSS: Microsatellite stable colorectal cancer | ||
| Esophagus | 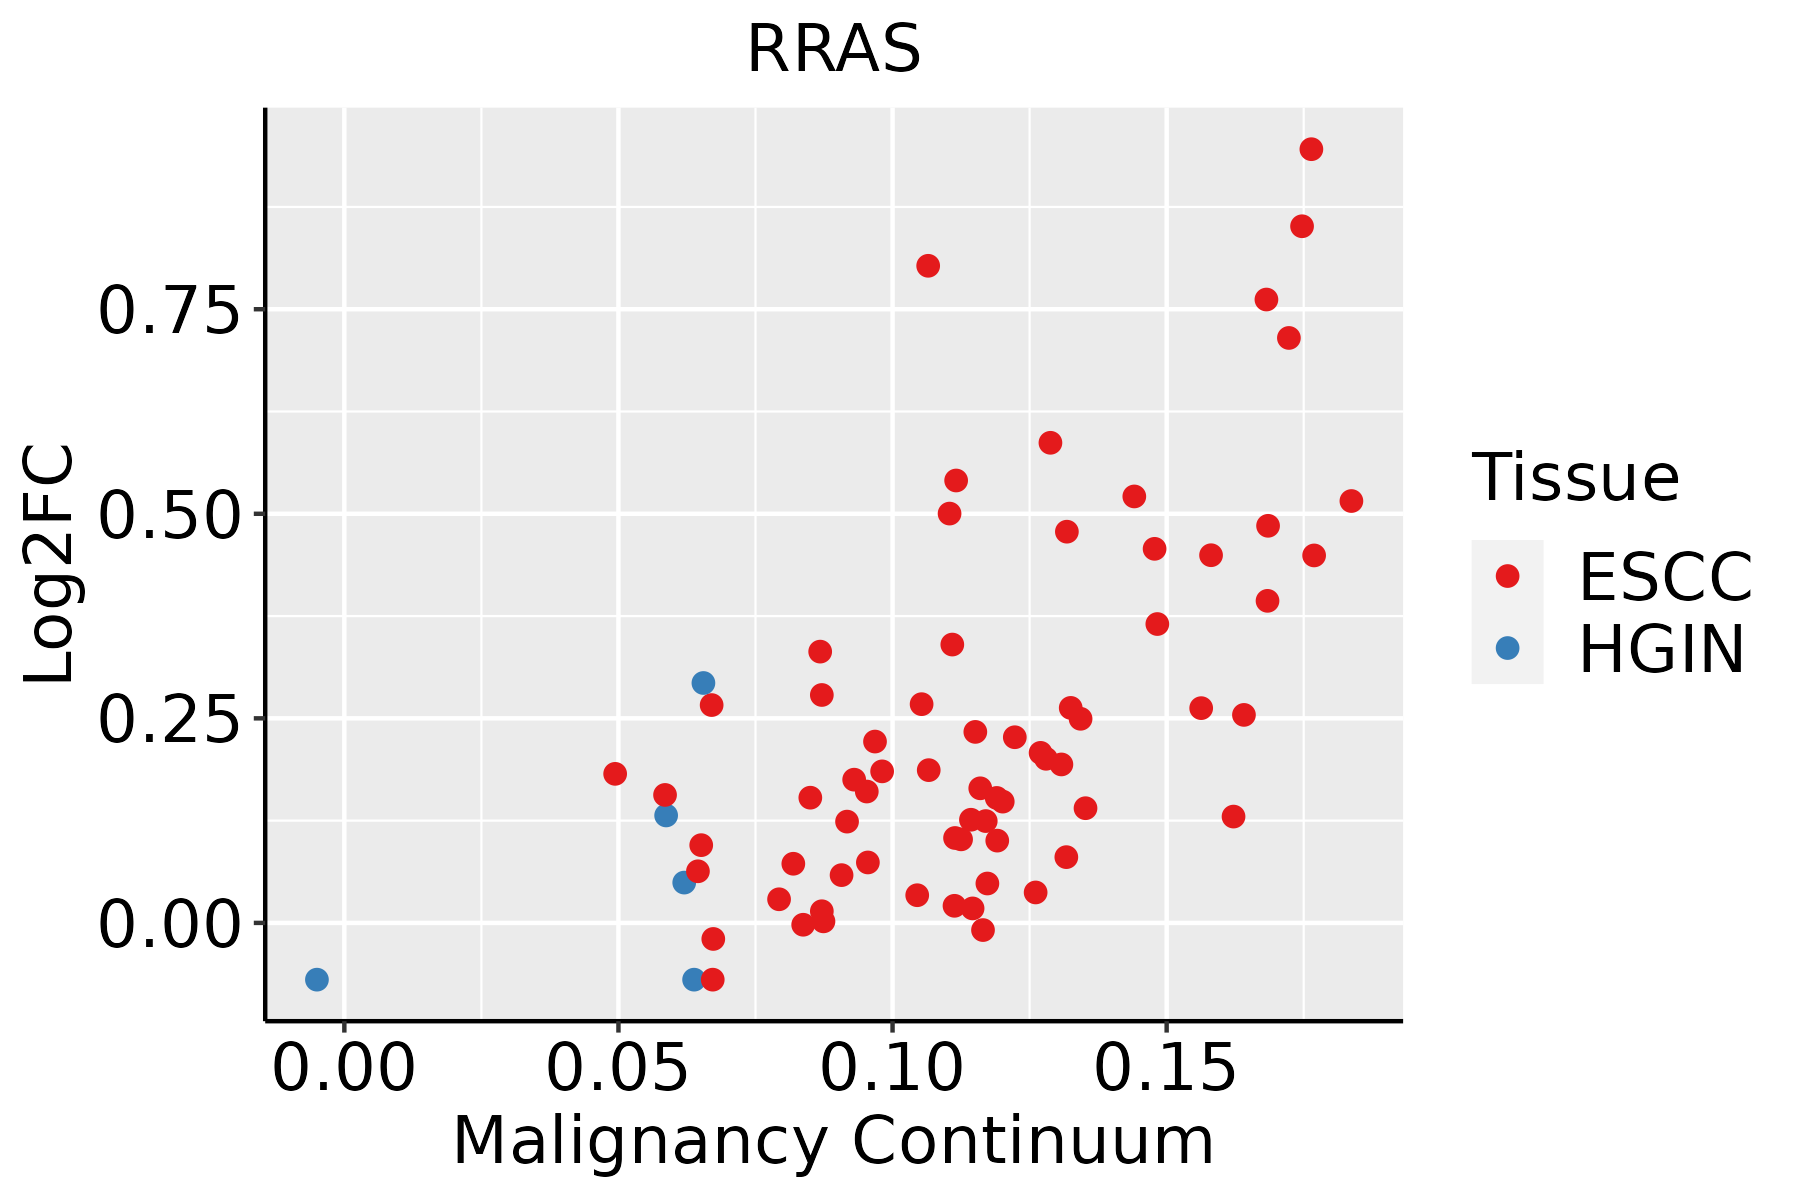 | ESCC: Esophageal squamous cell carcinoma |
| HGIN: High-grade intraepithelial neoplasias | ||
| LGIN: Low-grade intraepithelial neoplasias | ||
| Liver | 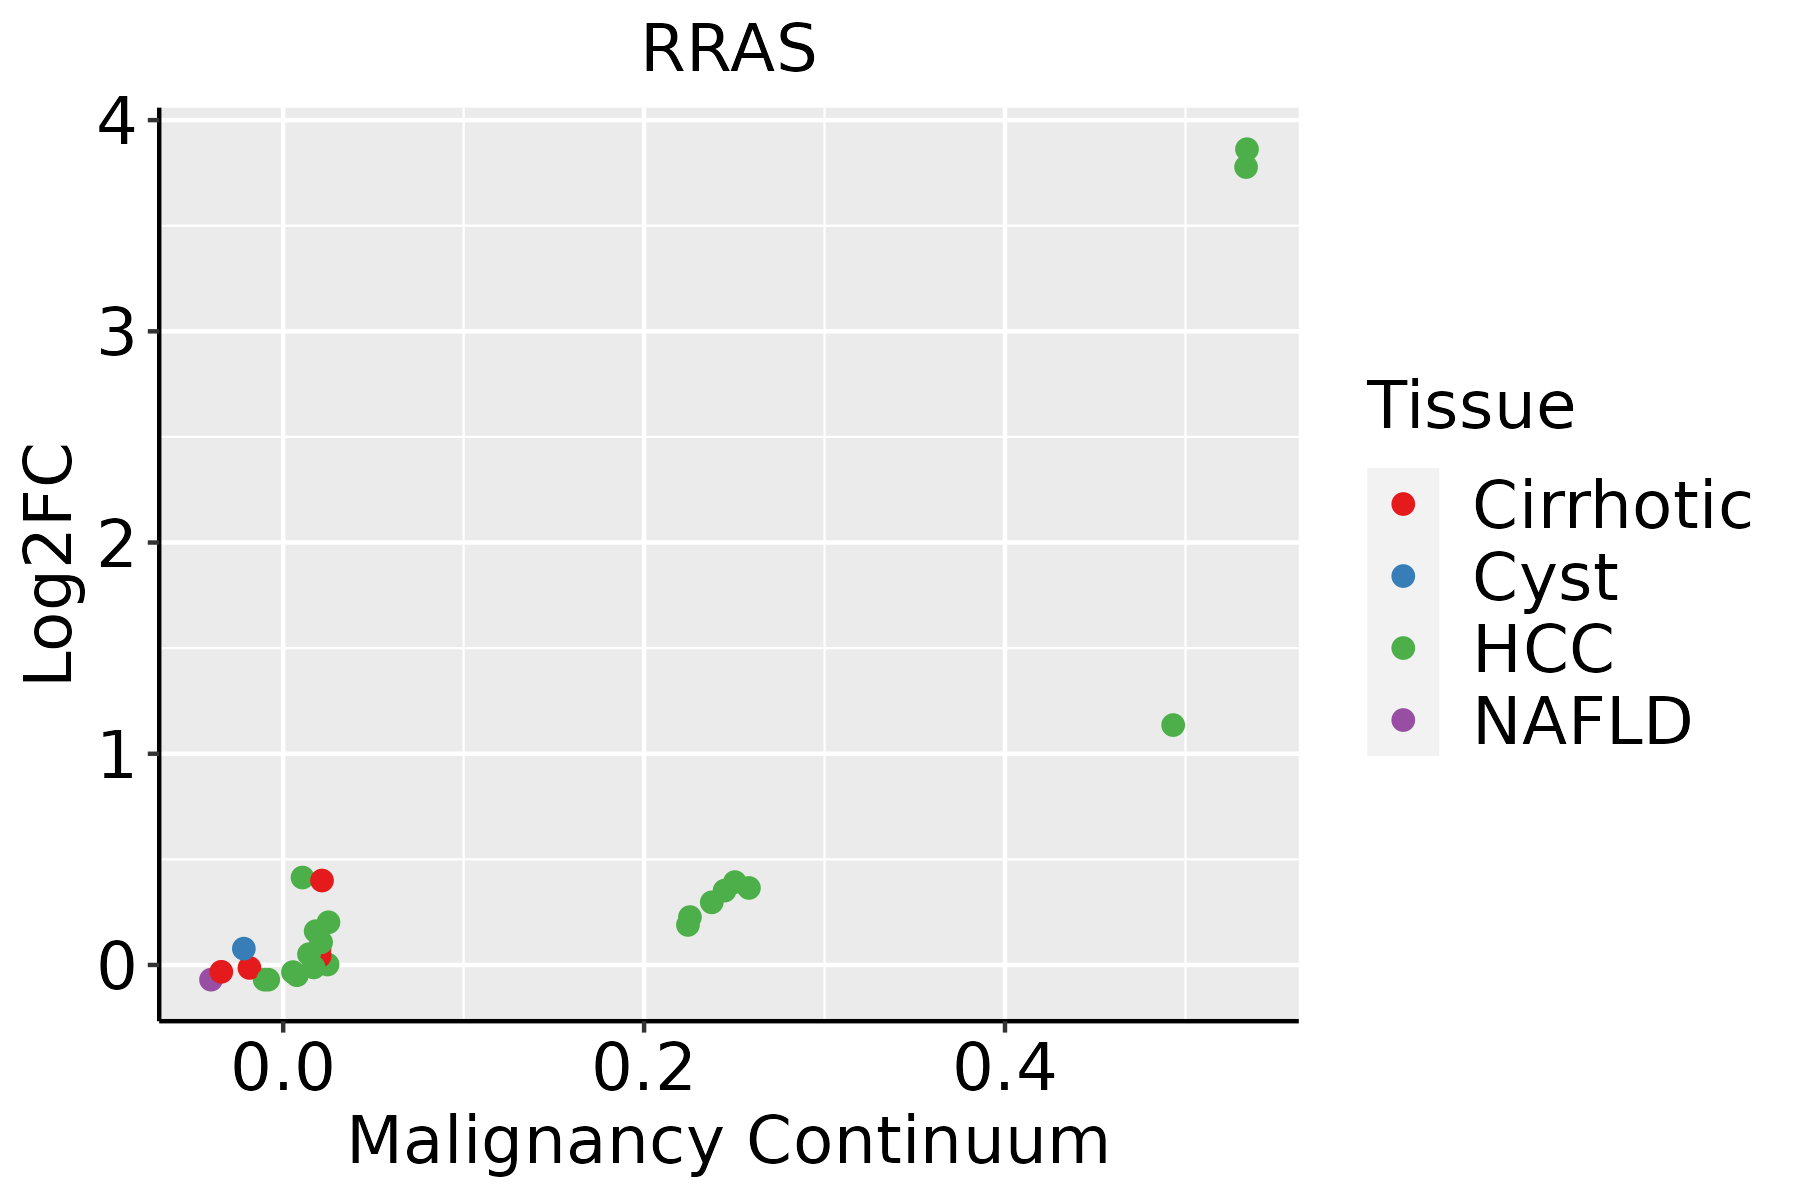 | HCC: Hepatocellular carcinoma |
| NAFLD: Non-alcoholic fatty liver disease | ||
| Oral Cavity | 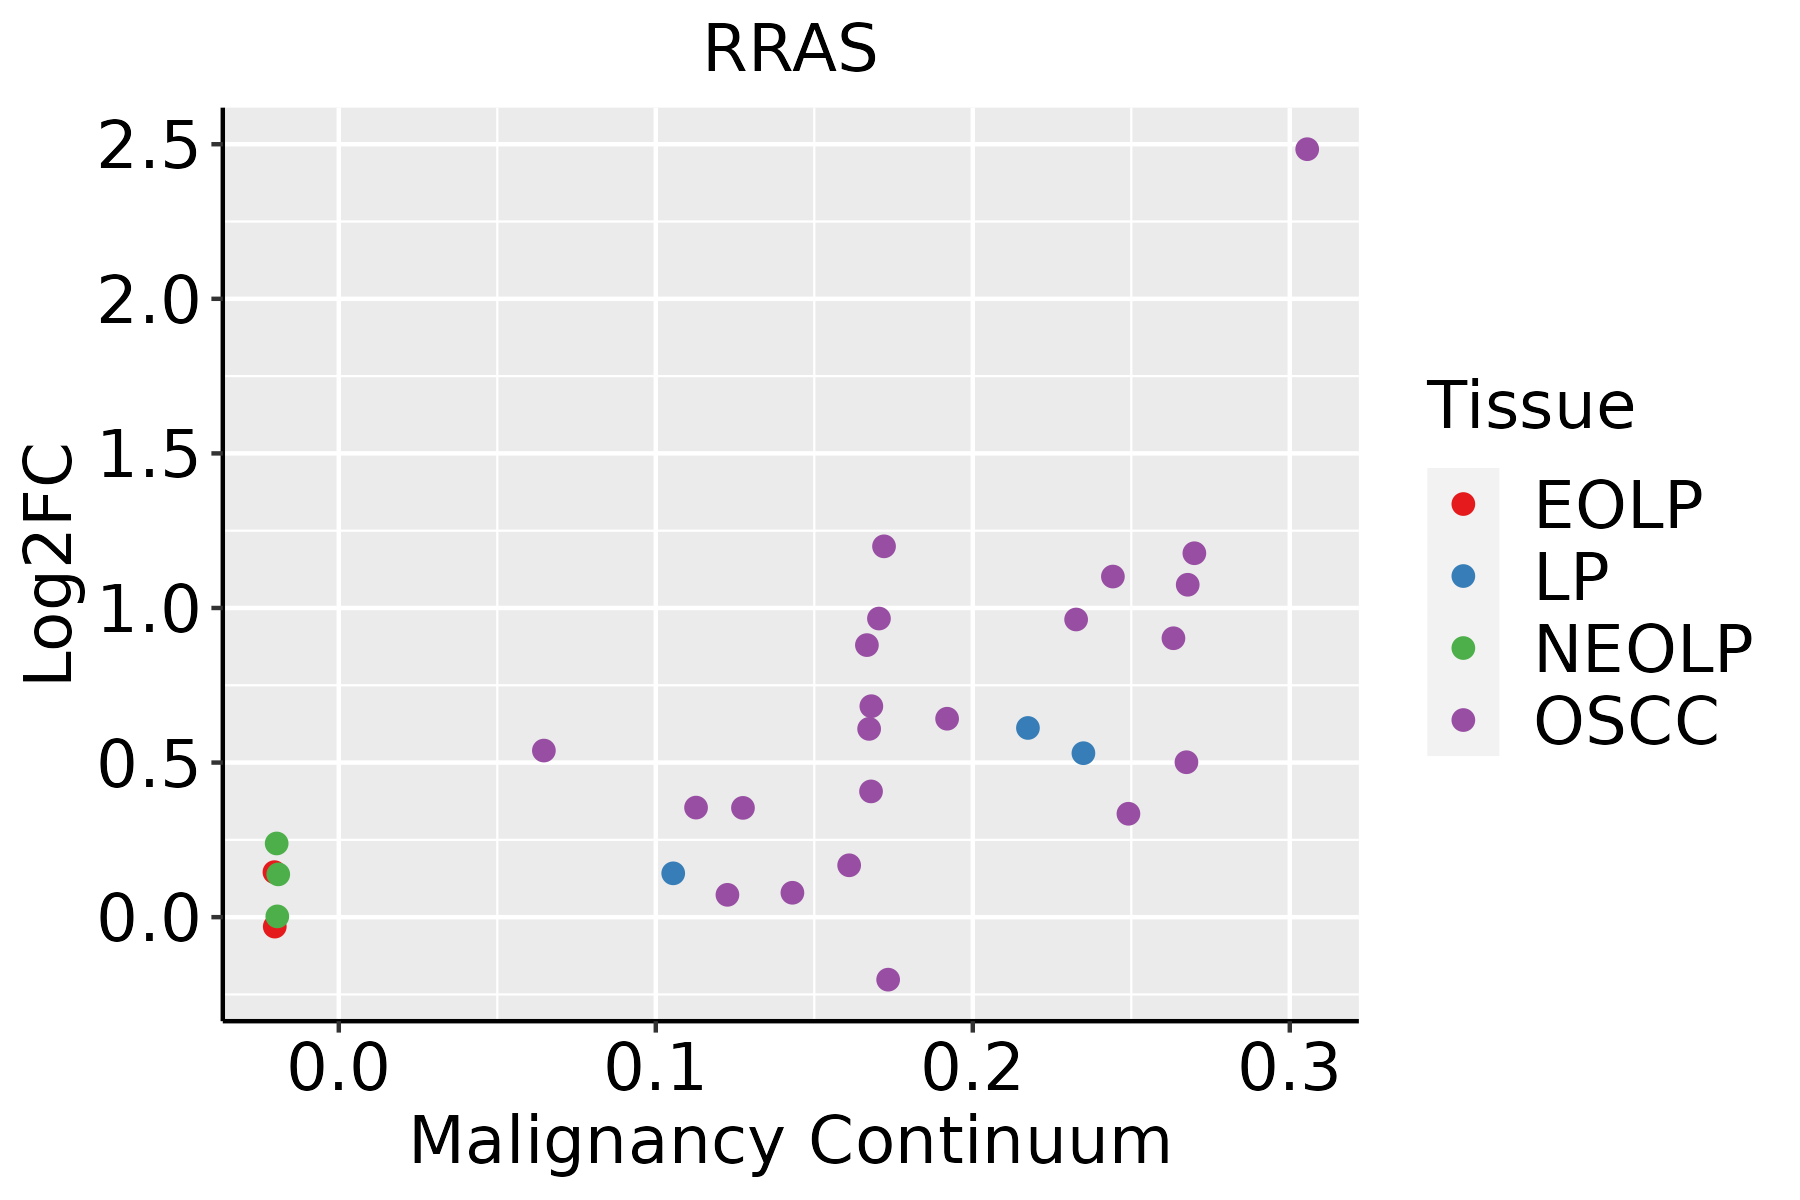 | EOLP: Erosive Oral lichen planus |
| LP: leukoplakia | ||
| NEOLP: Non-erosive oral lichen planus | ||
| OSCC: Oral squamous cell carcinoma | ||
| Skin | 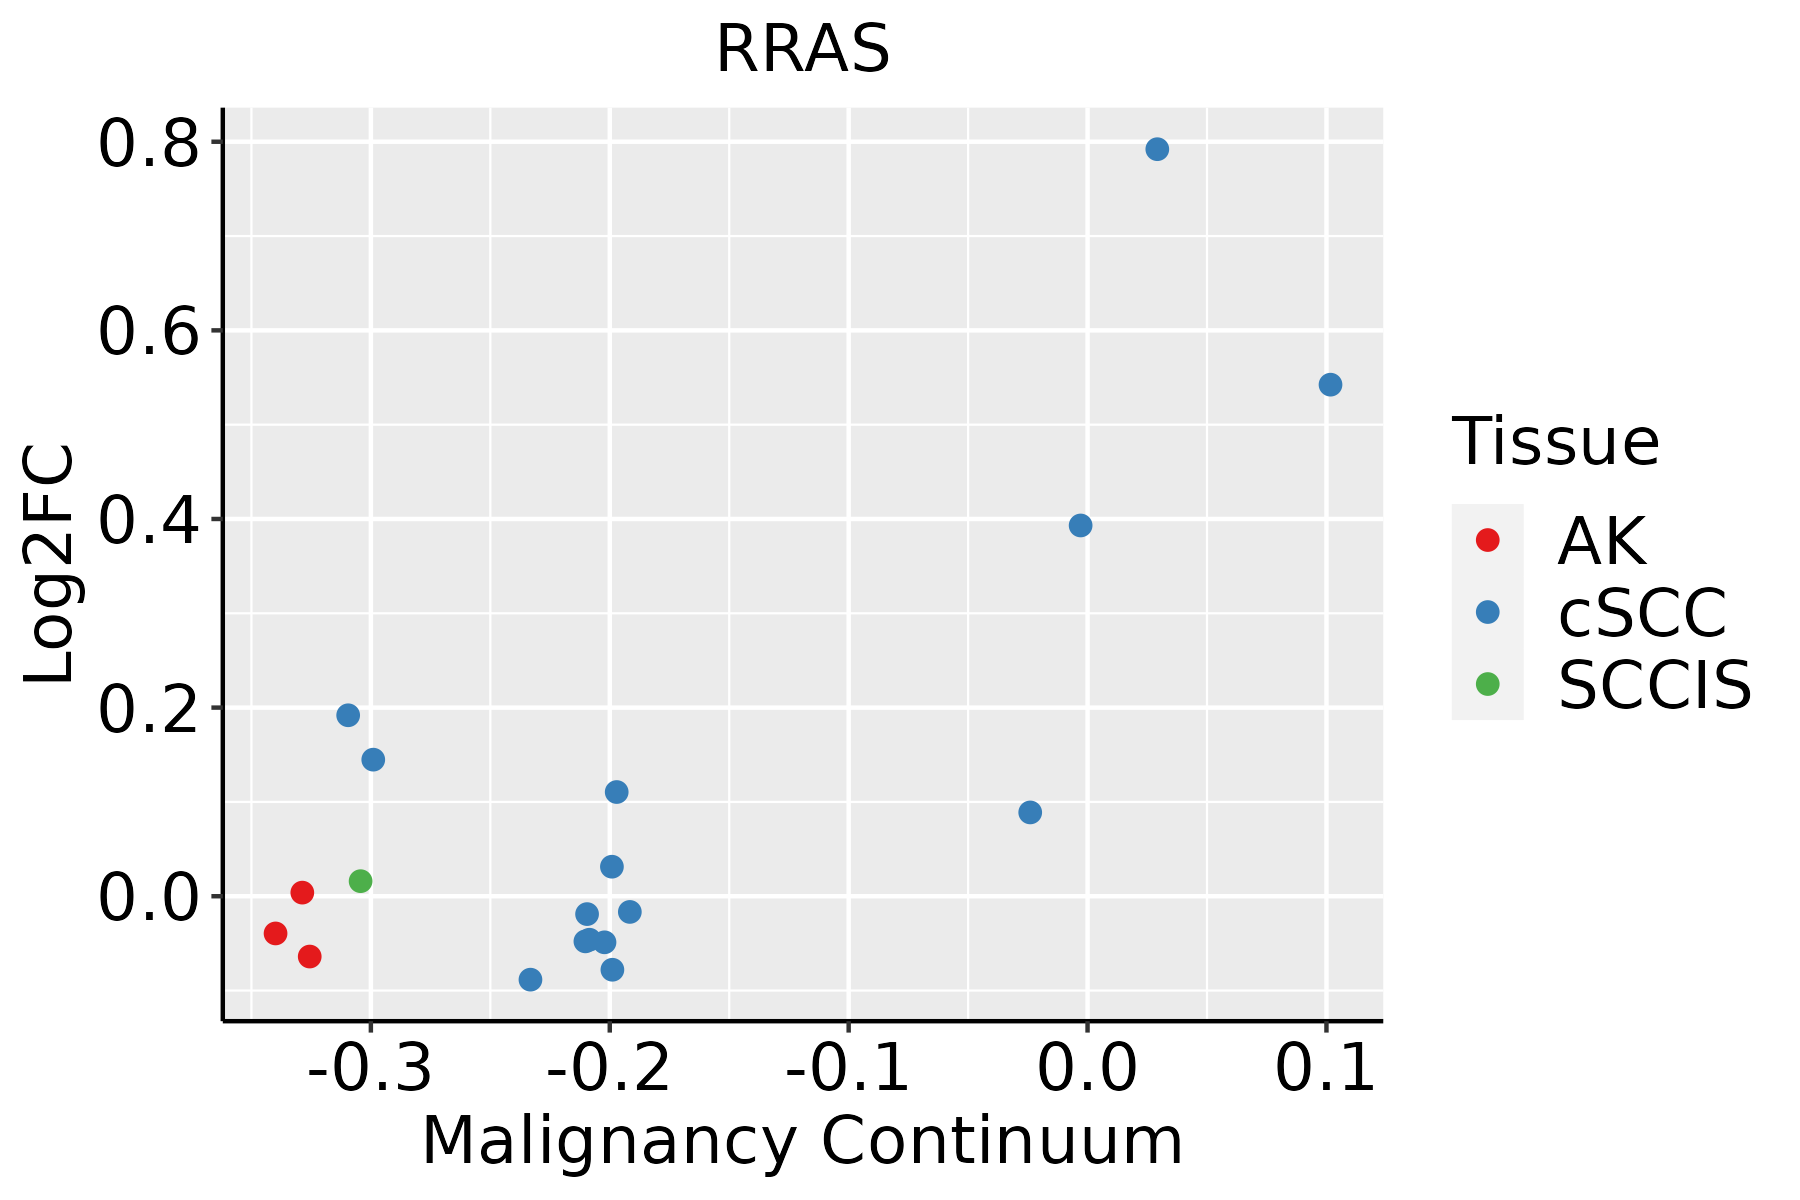 | AK: Actinic keratosis |
| cSCC: Cutaneous squamous cell carcinoma | ||
| SCCIS:squamous cell carcinoma in situ | ||
| Thyroid | 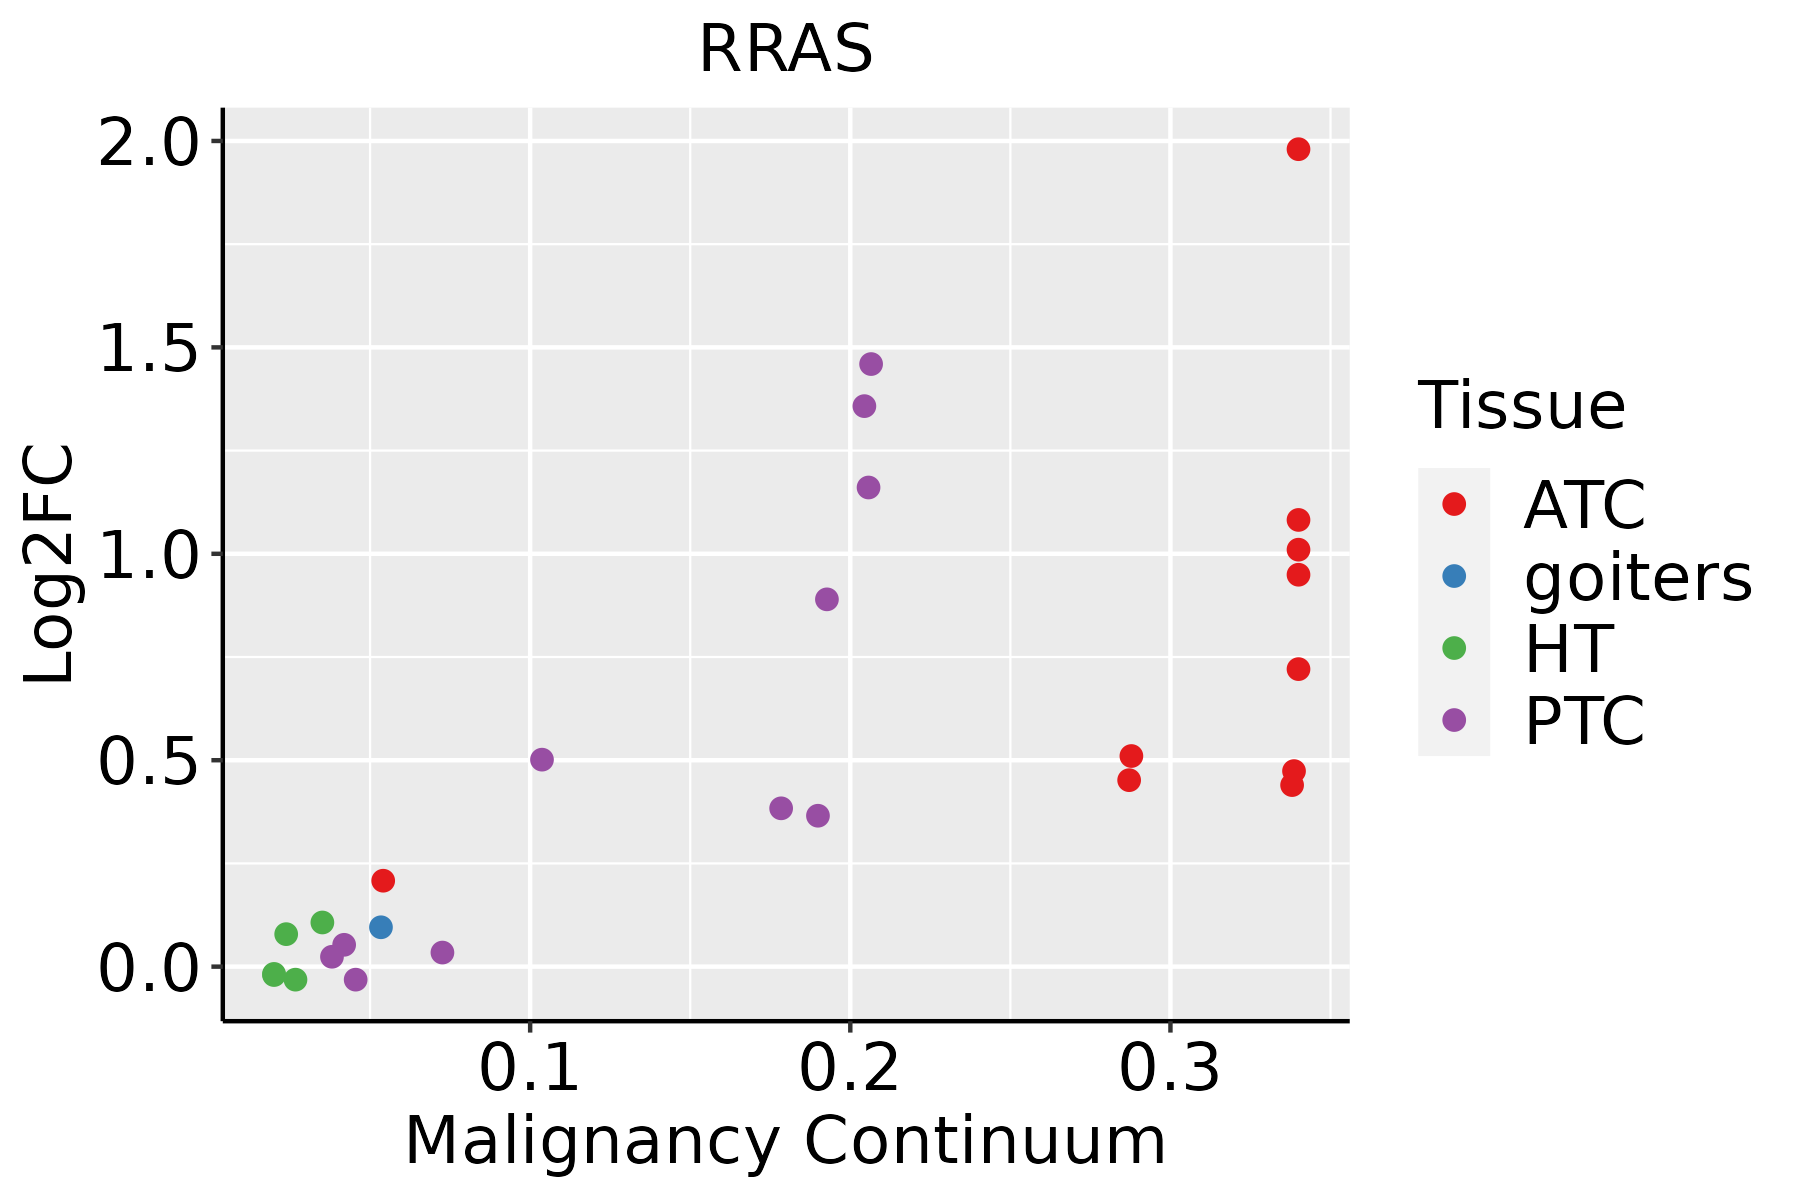 | ATC: Anaplastic thyroid cancer |
| HT: Hashimoto's thyroiditis | ||
| PTC: Papillary thyroid cancer |
| ∗log2FC in expression of this searched gene in stem-like cells from each diseased tissue sample relative to stem-like cells in normal samples in each tissue plotted against the malignancy continuum. Samples are colored based on if they are from different disease stage. |
Top |
Malignant transformation related pathway analysis |
| Find out the enriched GO biological processes and KEGG pathways involved in transition from healthy to precancer to cancer |
| Tissue | Disease Stage | Enriched GO biological Processes |
| Colorectum | AD |  |
| Colorectum | SER |  |
| Colorectum | MSS |  |
| Colorectum | MSI-H |  |
| Colorectum | FAP |  |
| ∗Top 15 enriched GO BP terms are showed in the bar plot of each disease state in each tissue. Each row represents a significant GO biological process which is colored according to the -log10(p.adjust). |
| Page: 1 2 3 4 5 6 7 8 9 |
| GO ID | Tissue | Disease Stage | Description | Gene Ratio | Bg Ratio | pvalue | p.adjust | Count |
| GO:006032511 | Thyroid | ATC | face morphogenesis | 21/6293 | 28/18723 | 8.94e-06 | 8.95e-05 | 21 |
| GO:004354231 | Thyroid | ATC | endothelial cell migration | 127/6293 | 279/18723 | 2.14e-05 | 1.91e-04 | 127 |
| GO:001017111 | Thyroid | ATC | body morphogenesis | 28/6293 | 43/18723 | 2.35e-05 | 2.06e-04 | 28 |
| GO:006032411 | Thyroid | ATC | face development | 28/6293 | 44/18723 | 4.39e-05 | 3.54e-04 | 28 |
| GO:001059531 | Thyroid | ATC | positive regulation of endothelial cell migration | 67/6293 | 133/18723 | 4.61e-05 | 3.70e-04 | 67 |
| GO:006032311 | Thyroid | ATC | head morphogenesis | 22/6293 | 32/18723 | 5.14e-05 | 3.99e-04 | 22 |
| GO:001059431 | Thyroid | ATC | regulation of endothelial cell migration | 102/6293 | 232/18723 | 6.17e-04 | 3.51e-03 | 102 |
| GO:004576621 | Thyroid | ATC | positive regulation of angiogenesis | 82/6293 | 181/18723 | 6.79e-04 | 3.83e-03 | 82 |
| GO:190401821 | Thyroid | ATC | positive regulation of vasculature development | 82/6293 | 181/18723 | 6.79e-04 | 3.83e-03 | 82 |
| GO:004001316 | Thyroid | ATC | negative regulation of locomotion | 160/6293 | 391/18723 | 1.36e-03 | 7.07e-03 | 160 |
| GO:003033616 | Thyroid | ATC | negative regulation of cell migration | 142/6293 | 344/18723 | 1.64e-03 | 8.22e-03 | 142 |
| GO:00457657 | Thyroid | ATC | regulation of angiogenesis | 141/6293 | 342/18723 | 1.80e-03 | 8.85e-03 | 141 |
| GO:19013427 | Thyroid | ATC | regulation of vasculature development | 143/6293 | 348/18723 | 1.95e-03 | 9.44e-03 | 143 |
| GO:005127117 | Thyroid | ATC | negative regulation of cellular component movement | 150/6293 | 367/18723 | 1.99e-03 | 9.54e-03 | 150 |
| GO:200014617 | Thyroid | ATC | negative regulation of cell motility | 147/6293 | 359/18723 | 2.01e-03 | 9.60e-03 | 147 |
| GO:004349116 | Thyroid | ATC | protein kinase B signaling | 87/6293 | 211/18723 | 1.20e-02 | 4.27e-02 | 87 |
| GO:000157021 | Thyroid | ATC | vasculogenesis | 37/6293 | 80/18723 | 1.26e-02 | 4.42e-02 | 37 |
| Page: 1 2 3 4 5 6 7 8 9 10 11 12 13 14 15 16 |
| Pathway ID | Tissue | Disease Stage | Description | Gene Ratio | Bg Ratio | pvalue | p.adjust | qvalue | Count |
| hsa0513224 | Breast | IDC | Salmonella infection | 55/867 | 249/8465 | 2.07e-08 | 4.49e-07 | 3.36e-07 | 55 |
| hsa0421824 | Breast | IDC | Cellular senescence | 35/867 | 156/8465 | 5.49e-06 | 7.43e-05 | 5.56e-05 | 35 |
| hsa0520523 | Breast | IDC | Proteoglycans in cancer | 42/867 | 205/8465 | 7.69e-06 | 9.99e-05 | 7.48e-05 | 42 |
| hsa0413723 | Breast | IDC | Mitophagy - animal | 17/867 | 72/8465 | 7.61e-04 | 6.04e-03 | 4.52e-03 | 17 |
| hsa0481014 | Breast | IDC | Regulation of actin cytoskeleton | 36/867 | 229/8465 | 5.79e-03 | 3.13e-02 | 2.34e-02 | 36 |
| hsa0513234 | Breast | IDC | Salmonella infection | 55/867 | 249/8465 | 2.07e-08 | 4.49e-07 | 3.36e-07 | 55 |
| hsa0421834 | Breast | IDC | Cellular senescence | 35/867 | 156/8465 | 5.49e-06 | 7.43e-05 | 5.56e-05 | 35 |
| hsa0520533 | Breast | IDC | Proteoglycans in cancer | 42/867 | 205/8465 | 7.69e-06 | 9.99e-05 | 7.48e-05 | 42 |
| hsa0413733 | Breast | IDC | Mitophagy - animal | 17/867 | 72/8465 | 7.61e-04 | 6.04e-03 | 4.52e-03 | 17 |
| hsa0481015 | Breast | IDC | Regulation of actin cytoskeleton | 36/867 | 229/8465 | 5.79e-03 | 3.13e-02 | 2.34e-02 | 36 |
| hsa0520542 | Breast | DCIS | Proteoglycans in cancer | 39/846 | 205/8465 | 5.36e-05 | 5.58e-04 | 4.11e-04 | 39 |
| hsa0520552 | Breast | DCIS | Proteoglycans in cancer | 39/846 | 205/8465 | 5.36e-05 | 5.58e-04 | 4.11e-04 | 39 |
| hsa0513220 | Cervix | CC | Salmonella infection | 74/1267 | 249/8465 | 1.33e-09 | 2.54e-08 | 1.50e-08 | 74 |
| hsa0520516 | Cervix | CC | Proteoglycans in cancer | 60/1267 | 205/8465 | 9.13e-08 | 1.18e-06 | 7.00e-07 | 60 |
| hsa0421810 | Cervix | CC | Cellular senescence | 49/1267 | 156/8465 | 1.30e-07 | 1.63e-06 | 9.61e-07 | 49 |
| hsa0481016 | Cervix | CC | Regulation of actin cytoskeleton | 64/1267 | 229/8465 | 2.24e-07 | 2.59e-06 | 1.53e-06 | 64 |
| hsa0401512 | Cervix | CC | Rap1 signaling pathway | 56/1267 | 210/8465 | 6.23e-06 | 5.61e-05 | 3.32e-05 | 56 |
| hsa043609 | Cervix | CC | Axon guidance | 47/1267 | 182/8465 | 8.13e-05 | 5.38e-04 | 3.18e-04 | 47 |
| hsa0413718 | Cervix | CC | Mitophagy - animal | 22/1267 | 72/8465 | 5.77e-04 | 2.75e-03 | 1.63e-03 | 22 |
| hsa040142 | Cervix | CC | Ras signaling pathway | 51/1267 | 236/8465 | 3.55e-03 | 1.34e-02 | 7.91e-03 | 51 |
| Page: 1 2 3 4 5 6 7 8 |
Top |
Cell-cell communication analysis |
| Identification of potential cell-cell interactions between two cell types and their ligand-receptor pairs for different disease states |
| Ligand | Receptor | LRpair | Pathway | Tissue | Disease Stage |
| Page: 1 |
Top |
Single-cell gene regulatory network inference analysis |
| Find out the significant the regulons (TFs) and the target genes of each regulon across cell types for different disease states |
| TF | Cell Type | Tissue | Disease Stage | Target Gene | RSS | Regulon Activity |
| ∗The dot plots of a searched regulon are shown for all cell subpopulations in each disease state of each tissue based on the regulon specific score inferred using pySCENIC and by calculating the average expression. |
| Page: 1 |
Top |
Somatic mutation of malignant transformation related genes |
| Annotation of somatic variants for genes involved in malignant transformation |
| Hugo Symbol | Variant Class | Variant Classification | dbSNP RS | HGVSc | HGVSp | HGVSp Short | SWISSPROT | BIOTYPE | SIFT | PolyPhen | Tumor Sample Barcode | Tissue | Histology | Sex | Age | Stage | Therapy Types | Drugs | Outcome |
| RRAS | SNV | Missense_Mutation | c.382N>T | p.Arg128Trp | p.R128W | P10301 | protein_coding | deleterious(0) | probably_damaging(0.999) | TCGA-G4-6628-01 | Colorectum | colon adenocarcinoma | Male | >=65 | I/II | Unknown | Unknown | SD | |
| RRAS | SNV | Missense_Mutation | c.422N>A | p.Gly141Glu | p.G141E | P10301 | protein_coding | deleterious(0) | probably_damaging(0.993) | TCGA-NH-A5IV-01 | Colorectum | colon adenocarcinoma | Female | >=65 | I/II | Unknown | Unknown | SD | |
| RRAS | SNV | Missense_Mutation | c.173N>G | p.Tyr58Cys | p.Y58C | P10301 | protein_coding | deleterious(0) | probably_damaging(0.998) | TCGA-A5-A0GH-01 | Endometrium | uterine corpus endometrioid carcinoma | Female | <65 | I/II | Unknown | Unknown | SD | |
| RRAS | SNV | Missense_Mutation | novel | c.566N>T | p.Ala189Val | p.A189V | P10301 | protein_coding | tolerated(0.41) | benign(0) | TCGA-A5-A2K3-01 | Endometrium | uterine corpus endometrioid carcinoma | Female | >=65 | I/II | Chemotherapy | carboplatin | SD |
| RRAS | SNV | Missense_Mutation | novel | c.287N>G | p.Gln96Arg | p.Q96R | P10301 | protein_coding | tolerated(0.06) | probably_damaging(0.971) | TCGA-AJ-A2QO-01 | Endometrium | uterine corpus endometrioid carcinoma | Female | >=65 | I/II | Unknown | Unknown | SD |
| RRAS | SNV | Missense_Mutation | rs748655822 | c.646G>A | p.Val216Ile | p.V216I | P10301 | protein_coding | tolerated(0.2) | benign(0) | TCGA-AJ-A3OK-01 | Endometrium | uterine corpus endometrioid carcinoma | Female | >=65 | I/II | Chemotherapy | carboplatin | CR |
| RRAS | SNV | Missense_Mutation | rs747724851 | c.281G>A | p.Arg94Lys | p.R94K | P10301 | protein_coding | deleterious(0.03) | probably_damaging(0.981) | TCGA-AP-A0LM-01 | Endometrium | uterine corpus endometrioid carcinoma | Female | <65 | III/IV | Chemotherapy | cisplatin | SD |
| RRAS | SNV | Missense_Mutation | novel | c.518N>T | p.Ala173Val | p.A173V | P10301 | protein_coding | deleterious(0) | possibly_damaging(0.786) | TCGA-AX-A2HD-01 | Endometrium | uterine corpus endometrioid carcinoma | Female | >=65 | III/IV | Unknown | Unknown | SD |
| RRAS | SNV | Missense_Mutation | c.418N>T | p.Val140Phe | p.V140F | P10301 | protein_coding | deleterious(0) | possibly_damaging(0.785) | TCGA-B5-A0JY-01 | Endometrium | uterine corpus endometrioid carcinoma | Female | <65 | III/IV | Chemotherapy | doxorubicin | SD | |
| RRAS | SNV | Missense_Mutation | novel | c.147N>A | p.Phe49Leu | p.F49L | P10301 | protein_coding | tolerated(0.26) | probably_damaging(0.989) | TCGA-B5-A0JY-01 | Endometrium | uterine corpus endometrioid carcinoma | Female | <65 | III/IV | Chemotherapy | doxorubicin | SD |
| Page: 1 2 3 |
Top |
Related drugs of malignant transformation related genes |
| Identification of chemicals and drugs interact with genes involved in malignant transfromation |
| (DGIdb 4.0) |
| Entrez ID | Symbol | Category | Interaction Types | Drug Claim Name | Drug Name | PMIDs |
| Page: 1 |

Copyright 2023-Present -The University of Texas Health Science Center at Houston |