Schematic overview of the cellular and molecular mechanisms involved in the cancer progression, including the proposed cellular and molecular mechanisms in cancer cells trajectory. AT1: alveolar type 1 cells; AT2: alveolar type 2 cells; AAH: atypical adenomatous hyperplasia; AIS: adenocarcinoma in situ; MIA: minimally invasive adenocarcinoma; IA: invasive adenocarcinoma; EMT: epithelial-mesenchymal transition

Home

Download

Statistics

Help

Contact

Center for Computational Systems Medicine
leaf

Gene summary

leaf

Malignant transformation analysis

leaf

Malignant transformation related pathway analysis

leaf

Cell-cell communication analysis

leaf

Single-cell gene regulatory network inference analysis

leaf

Somatic mutation of malignant transformation related genes

leaf

Related drugs of malignant transformation related genes

Gene: RC3H2

Gene summary for RC3H2

check button Gene summary.

Gene informationSpeciesHuman
Gene symbol

RC3H2

Gene ID

54542

Gene namering finger and CCCH-type domains 2
Gene AliasMNAB
Cytomap9q33.2
Gene Typeprotein-coding
GO ID

GO:0000209

UniProtAcc

A0A024R899


Top

Malignant transformation analysis

check button Identification of the aberrant gene expression in precancerous and cancerous lesions by comparing the gene expression of stem-like cells in diseased tissues with normal stem cells
check button Malignant transformation involving gene list.
Entrez IDSymbolReplicatesSpeciesOrganTissueAdj P-valueLog2FCMalignancy
54542RC3H2CCI_1HumanCervixCC5.64e-045.02e-010.528
54542RC3H2CCI_2HumanCervixCC1.93e-101.16e+000.5249
54542RC3H2CCI_3HumanCervixCC6.11e-097.17e-010.516
54542RC3H2LZE4THumanEsophagusESCC1.74e-093.12e-010.0811
54542RC3H2LZE5THumanEsophagusESCC8.16e-054.14e-010.0514
54542RC3H2LZE7THumanEsophagusESCC2.07e-054.73e-010.0667
54542RC3H2LZE20THumanEsophagusESCC8.89e-042.55e-010.0662
54542RC3H2LZE24THumanEsophagusESCC4.15e-183.79e-010.0596
54542RC3H2LZE21THumanEsophagusESCC1.63e-042.23e-010.0655
54542RC3H2P1T-EHumanEsophagusESCC3.58e-053.38e-010.0875
54542RC3H2P2T-EHumanEsophagusESCC5.18e-254.76e-010.1177
54542RC3H2P4T-EHumanEsophagusESCC5.59e-183.55e-010.1323
54542RC3H2P5T-EHumanEsophagusESCC1.72e-081.14e-010.1327
54542RC3H2P8T-EHumanEsophagusESCC2.04e-162.48e-010.0889
54542RC3H2P9T-EHumanEsophagusESCC1.53e-122.67e-010.1131
54542RC3H2P10T-EHumanEsophagusESCC1.62e-214.13e-010.116
54542RC3H2P11T-EHumanEsophagusESCC4.99e-033.51e-010.1426
54542RC3H2P12T-EHumanEsophagusESCC1.30e-172.83e-010.1122
54542RC3H2P15T-EHumanEsophagusESCC4.59e-102.99e-010.1149
54542RC3H2P16T-EHumanEsophagusESCC1.17e-131.76e-010.1153
Page: 1 2 3 4 5 6 

check button Transcriptomic changes along malignancy continuum.
TissueExpression DynamicsAbbreviation
CervixThe image shows the transcriptomic changes along malignancy continuum.log2FC in expression of this searched gene in stem-like cells from each diseased tissue sample relative to stem-like cells in normal samples in each tissue plotted against the malignancy continuum. Samples are colored based on if they are from different disease stage.CC: Cervix cancer
HSIL_HPV: HPV-infected high-grade squamous intraepithelial lesions
N_HPV: HPV-infected normal cervix
EsophagusThe image shows the transcriptomic changes along malignancy continuum.log2FC in expression of this searched gene in stem-like cells from each diseased tissue sample relative to stem-like cells in normal samples in each tissue plotted against the malignancy continuum. Samples are colored based on if they are from different disease stage.
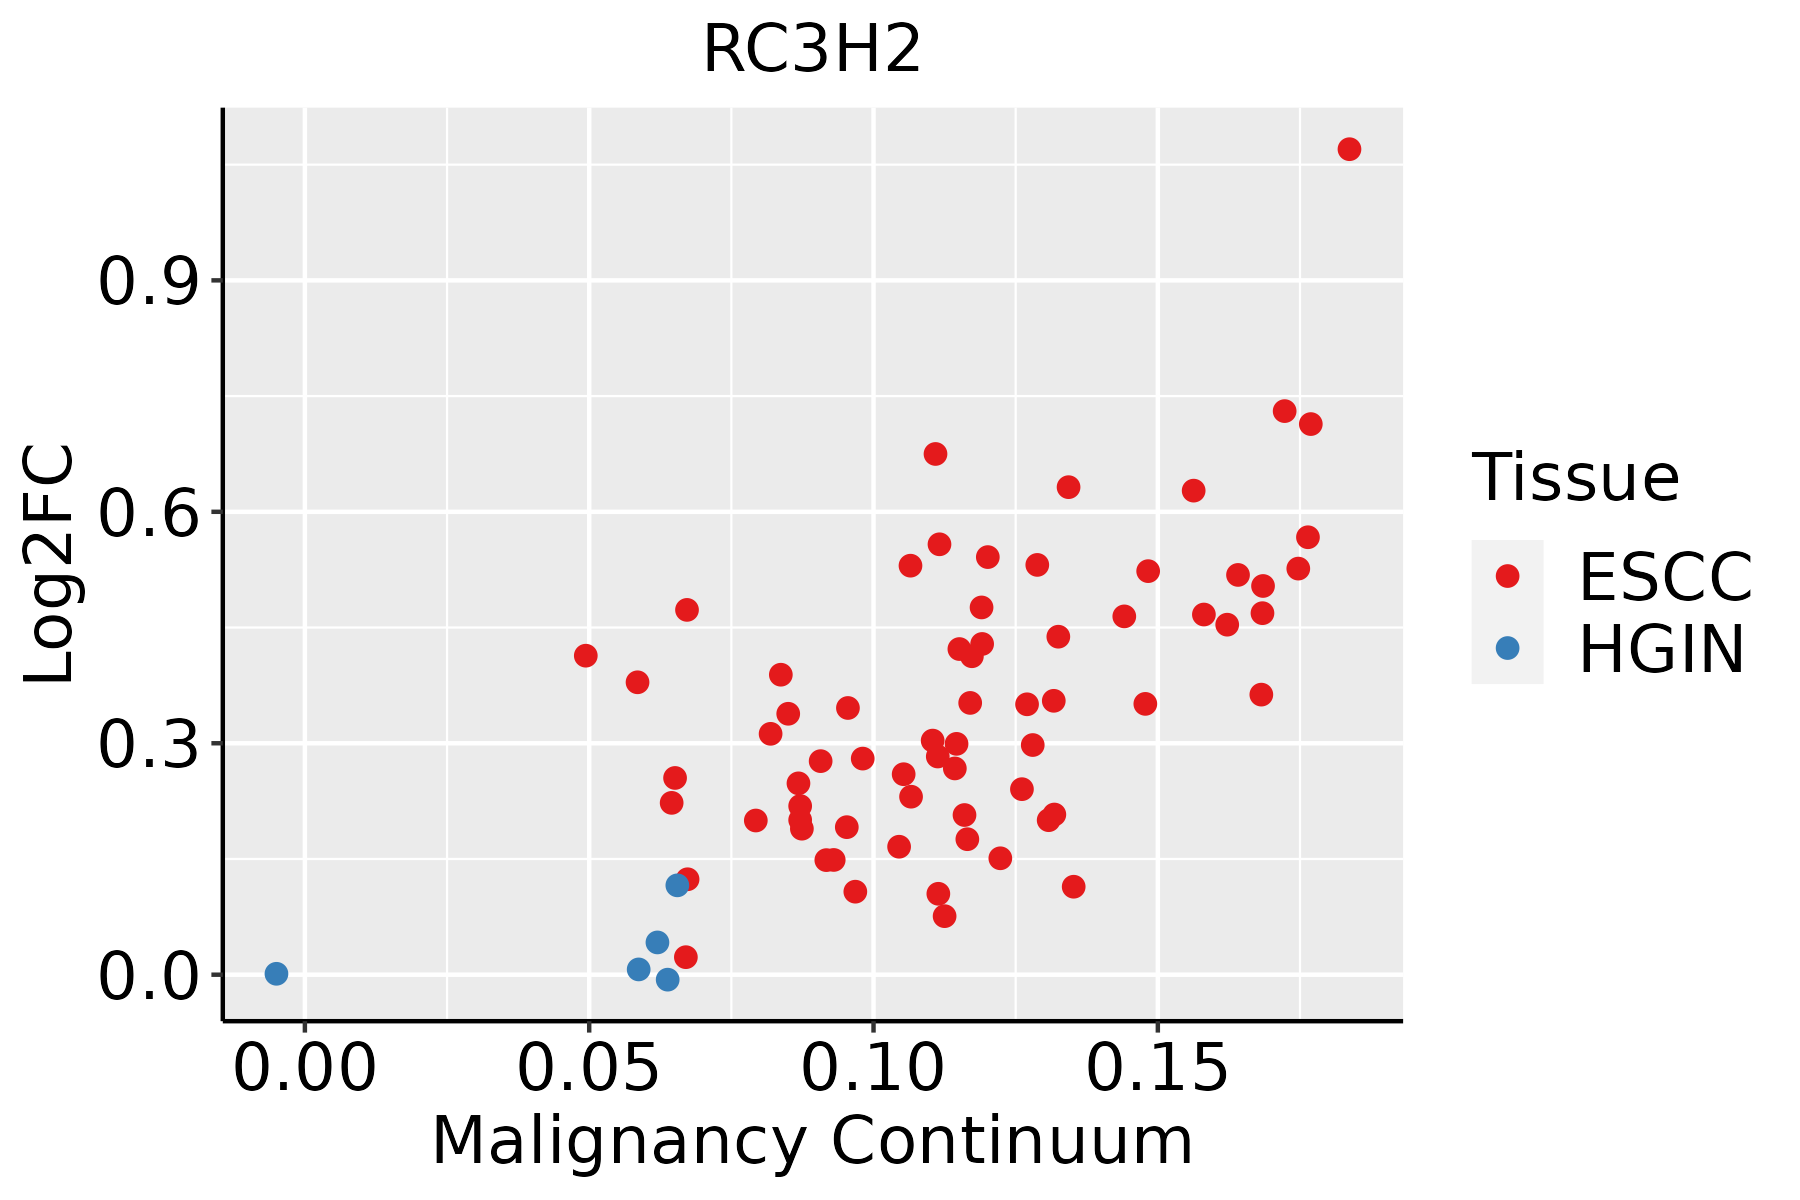
ESCC: Esophageal squamous cell carcinoma
HGIN: High-grade intraepithelial neoplasias
LGIN: Low-grade intraepithelial neoplasias
LiverThe image shows the transcriptomic changes along malignancy continuum.log2FC in expression of this searched gene in stem-like cells from each diseased tissue sample relative to stem-like cells in normal samples in each tissue plotted against the malignancy continuum. Samples are colored based on if they are from different disease stage.HCC: Hepatocellular carcinoma
NAFLD: Non-alcoholic fatty liver disease
Oral CavityThe image shows the transcriptomic changes along malignancy continuum.log2FC in expression of this searched gene in stem-like cells from each diseased tissue sample relative to stem-like cells in normal samples in each tissue plotted against the malignancy continuum. Samples are colored based on if they are from different disease stage.EOLP: Erosive Oral lichen planus
LP: leukoplakia
NEOLP: Non-erosive oral lichen planus
OSCC: Oral squamous cell carcinoma
SkinThe image shows the transcriptomic changes along malignancy continuum.log2FC in expression of this searched gene in stem-like cells from each diseased tissue sample relative to stem-like cells in normal samples in each tissue plotted against the malignancy continuum. Samples are colored based on if they are from different disease stage.AK: Actinic keratosis
cSCC: Cutaneous squamous cell carcinoma
SCCIS:squamous cell carcinoma in situ
ThyroidThe image shows the transcriptomic changes along malignancy continuum.log2FC in expression of this searched gene in stem-like cells from each diseased tissue sample relative to stem-like cells in normal samples in each tissue plotted against the malignancy continuum. Samples are colored based on if they are from different disease stage.ATC: Anaplastic thyroid cancer
HT: Hashimoto's thyroiditis
PTC: Papillary thyroid cancer
∗log2FC in expression of this searched gene in stem-like cells from each diseased tissue sample relative to stem-like cells in normal samples in each tissue plotted against the malignancy continuum. Samples are colored based on if they are from different disease stage.

Top

Malignant transformation related pathway analysis

check buttonFind out the enriched GO biological processes and KEGG pathways involved in transition from healthy to precancer to cancer
check button Figure of enriched GO biological processes.
TissueDisease StageEnriched GO biological Processes
ColorectumADGO analysis - Figure of enriched GO biological processes: Top 15 enriched GO BP terms are showed in the bar plot of each disease state in each tissue. Each row represents a significant GO biological process which is colored according to the -log10(p.adjust).
ColorectumSERGO analysis - Figure of enriched GO biological processes: Top 15 enriched GO BP terms are showed in the bar plot of each disease state in each tissue. Each row represents a significant GO biological process which is colored according to the -log10(p.adjust).
ColorectumMSSGO analysis - Figure of enriched GO biological processes: Top 15 enriched GO BP terms are showed in the bar plot of each disease state in each tissue. Each row represents a significant GO biological process which is colored according to the -log10(p.adjust).
ColorectumMSI-HGO analysis - Figure of enriched GO biological processes: Top 15 enriched GO BP terms are showed in the bar plot of each disease state in each tissue. Each row represents a significant GO biological process which is colored according to the -log10(p.adjust).
ColorectumFAPGO analysis - Figure of enriched GO biological processes: Top 15 enriched GO BP terms are showed in the bar plot of each disease state in each tissue. Each row represents a significant GO biological process which is colored according to the -log10(p.adjust).
∗Top 15 enriched GO BP terms are showed in the bar plot of each disease state in each tissue. Each row represents a significant GO biological process which is colored according to the -log10(p.adjust).
Page: 1 2 3 4 5 6 7 8 9 

check button Enriched GO biological processes.
GO IDTissueDisease StageDescriptionGene RatioBg Ratiopvaluep.adjustCount
GO:00026984Oral cavityEOLPnegative regulation of immune effector process26/2218110/187233.94e-043.53e-0326
GO:00508681Oral cavityEOLPnegative regulation of T cell activation28/2218122/187234.03e-043.58e-0328
GO:0042093Oral cavityEOLPT-helper cell differentiation18/221866/187234.94e-044.31e-0318
GO:00026974Oral cavityEOLPregulation of immune effector process61/2218339/187235.48e-044.68e-0361
GO:00022864Oral cavityEOLPT cell activation involved in immune response26/2218114/187237.06e-045.78e-0326
GO:0002294Oral cavityEOLPCD4-positive, alpha-beta T cell differentiation involved in immune response18/221868/187237.29e-045.94e-0318
GO:0002287Oral cavityEOLPalpha-beta T cell activation involved in immune response18/221869/187238.79e-046.75e-0318
GO:0002293Oral cavityEOLPalpha-beta T cell differentiation involved in immune response18/221869/187238.79e-046.75e-0318
GO:0002292Oral cavityEOLPT cell differentiation involved in immune response19/221875/187239.43e-047.15e-0319
GO:0046636Oral cavityEOLPnegative regulation of alpha-beta T cell activation13/221843/187231.03e-037.63e-0313
GO:00017761Oral cavityEOLPleukocyte homeostasis21/221887/187231.03e-037.63e-0321
GO:00456203Oral cavityEOLPnegative regulation of lymphocyte differentiation15/221855/187231.42e-039.62e-0315
GO:0046639Oral cavityEOLPnegative regulation of alpha-beta T cell differentiation9/221826/187232.14e-031.34e-029
GO:00455811Oral cavityEOLPnegative regulation of T cell differentiation13/221847/187232.52e-031.53e-0213
GO:0043371Oral cavityEOLPnegative regulation of CD4-positive, alpha-beta T cell differentiation8/221822/187232.64e-031.59e-028
GO:2000515Oral cavityEOLPnegative regulation of CD4-positive, alpha-beta T cell activation10/221832/187232.93e-031.72e-0210
GO:00028223Oral cavityEOLPregulation of adaptive immune response based on somatic recombination of immune receptors built from immunoglobulin superfamily domains32/2218168/187234.37e-032.38e-0232
GO:190122221Oral cavityEOLPregulation of NIK/NF-kappaB signaling23/2218112/187235.70e-032.92e-0223
GO:00024604Oral cavityEOLPadaptive immune response based on somatic recombination of immune receptors built from immunoglobulin superfamily domains58/2218356/187237.27e-033.52e-0258
GO:00105866Oral cavityEOLPmiRNA metabolic process8/221827/187231.07e-024.75e-028
Page: 1 2 3 4 5 6 7 8 9 10 11 12 13 14 15 16 17 18 19 20 21 22 

check button Enriched KEGG pathways.
Pathway IDTissueDisease StageDescriptionGene RatioBg Ratiopvaluep.adjustqvalueCount
Page: 1 

Top

Cell-cell communication analysis

check buttonIdentification of potential cell-cell interactions between two cell types and their ligand-receptor pairs for different disease states
LigandReceptorLRpairPathwayTissueDisease Stage
Page: 1 

Top

Single-cell gene regulatory network inference analysis

check buttonFind out the significant the regulons (TFs) and the target genes of each regulon across cell types for different disease states
TFCell TypeTissueDisease StageTarget GeneRSSRegulon Activity
∗The dot plots of a searched regulon are shown for all cell subpopulations in each disease state of each tissue based on the regulon specific score inferred using pySCENIC and by calculating the average expression.
Page: 1 

Top

Somatic mutation of malignant transformation related genes

check buttonAnnotation of somatic variants for genes involved in malignant transformation
Hugo SymbolVariant ClassVariant ClassificationdbSNP RSHGVScHGVSpHGVSp ShortSWISSPROTBIOTYPESIFTPolyPhenTumor Sample BarcodeTissueHistologySexAgeStageTherapy TypesDrugsOutcome
RC3H2SNVMissense_Mutationnovelc.464N>Ap.Ala155Aspp.A155DQ9HBD1protein_codingdeleterious(0)possibly_damaging(0.72)TCGA-AC-A8OS-01Breastbreast invasive carcinomaFemale>=65I/IIUnknownUnknownSD
RC3H2SNVMissense_Mutationc.1393G>Tp.Val465Leup.V465LQ9HBD1protein_codingtolerated(0.5)possibly_damaging(0.785)TCGA-B6-A0RU-01Breastbreast invasive carcinomaFemale<65I/IIUnknownUnknownPD
RC3H2SNVMissense_Mutationc.2117A>Gp.Tyr706Cysp.Y706CQ9HBD1protein_codingdeleterious(0.01)probably_damaging(0.984)TCGA-D8-A140-01Breastbreast invasive carcinomaFemale<65I/IIChemotherapydoxorubicin+cyclophosphamidSD
RC3H2SNVMissense_Mutationnovelc.2009N>Tp.Ser670Phep.S670FQ9HBD1protein_codingtolerated(0.1)benign(0.445)TCGA-D8-A27G-01Breastbreast invasive carcinomaFemale>=65I/IIUnknownUnknownSD
RC3H2SNVMissense_Mutationc.1768C>Gp.Pro590Alap.P590AQ9HBD1protein_codingdeleterious(0.01)probably_damaging(0.956)TCGA-E2-A10C-01Breastbreast invasive carcinomaFemale<65I/IIChemotherapycytoxanSD
RC3H2SNVMissense_Mutationc.2123N>Ap.Arg708Glnp.R708QQ9HBD1protein_codingdeleterious(0.02)possibly_damaging(0.885)TCGA-EW-A1OV-01Breastbreast invasive carcinomaFemale<65I/IIChemotherapyepirubicinSD
RC3H2insertionNonsense_Mutationnovelc.2499_2500insCCCAAGTAGCTGGGATTATAGACATGCACCACCp.Leu833_Ser834insProLysTerLeuGlyLeuTerThrCysThrThrp.L833_S834insPK*LGL*TCTTQ9HBD1protein_codingTCGA-A2-A0EX-01Breastbreast invasive carcinomaFemale<65I/IIHormone TherapytamoxiphenSD
RC3H2SNVMissense_Mutationrs370277433c.2792N>Tp.Ala931Valp.A931VQ9HBD1protein_codingdeleterious(0.05)benign(0.018)TCGA-2W-A8YY-01Cervixcervical & endocervical cancerFemale<65I/IIChemotherapycisplatinCR
RC3H2SNVMissense_Mutationc.2737N>Tp.Arg913Cysp.R913CQ9HBD1protein_codingdeleterious(0)probably_damaging(0.973)TCGA-EA-A50E-01Cervixcervical & endocervical cancerFemale<65I/IIUnknownUnknownPD
RC3H2SNVMissense_Mutationc.1259N>Cp.Arg420Prop.R420PQ9HBD1protein_codingdeleterious(0.01)possibly_damaging(0.89)TCGA-IR-A3LA-01Cervixcervical & endocervical cancerFemale<65I/IIChemotherapycisplatinCR
Page: 1 2 3 4 5 6 7 8 9 10 11 12 13 

Top

Related drugs of malignant transformation related genes

check buttonIdentification of chemicals and drugs interact with genes involved in malignant transfromation
(DGIdb 4.0)
Entrez IDSymbolCategoryInteraction TypesDrug Claim NameDrug NamePMIDs
Page: 1