
|
|||||
|
 | |
| |
| |
| |
| |
| |
|
Gene: PIK3C2A |
Gene summary for PIK3C2A |
| Gene information | Species | Human | Gene symbol | PIK3C2A | Gene ID | 5286 |
| Gene name | phosphatidylinositol-4-phosphate 3-kinase catalytic subunit type 2 alpha | |
| Gene Alias | CPK | |
| Cytomap | 11p15.1 | |
| Gene Type | protein-coding | GO ID | GO:0001525 | UniProtAcc | L7RRS0 |
Top |
Malignant transformation analysis |
| Identification of the aberrant gene expression in precancerous and cancerous lesions by comparing the gene expression of stem-like cells in diseased tissues with normal stem cells |
| Entrez ID | Symbol | Replicates | Species | Organ | Tissue | Adj P-value | Log2FC | Malignancy |
| 5286 | PIK3C2A | CA_HPV_1 | Human | Cervix | CC | 6.53e-06 | -1.53e-01 | 0.0264 |
| 5286 | PIK3C2A | CCI_2 | Human | Cervix | CC | 3.70e-03 | 6.92e-01 | 0.5249 |
| 5286 | PIK3C2A | AEH-subject1 | Human | Endometrium | AEH | 8.73e-13 | 3.69e-01 | -0.3059 |
| 5286 | PIK3C2A | AEH-subject2 | Human | Endometrium | AEH | 8.04e-03 | 1.58e-01 | -0.2525 |
| 5286 | PIK3C2A | AEH-subject3 | Human | Endometrium | AEH | 9.80e-08 | 2.33e-01 | -0.2576 |
| 5286 | PIK3C2A | AEH-subject4 | Human | Endometrium | AEH | 9.11e-03 | 2.02e-01 | -0.2657 |
| 5286 | PIK3C2A | AEH-subject5 | Human | Endometrium | AEH | 5.05e-22 | 5.73e-01 | -0.2953 |
| 5286 | PIK3C2A | EEC-subject1 | Human | Endometrium | EEC | 1.00e-15 | 4.39e-01 | -0.2682 |
| 5286 | PIK3C2A | EEC-subject2 | Human | Endometrium | EEC | 5.76e-10 | 3.39e-01 | -0.2607 |
| 5286 | PIK3C2A | EEC-subject3 | Human | Endometrium | EEC | 4.94e-07 | 1.53e-01 | -0.2525 |
| 5286 | PIK3C2A | EEC-subject5 | Human | Endometrium | EEC | 6.55e-08 | 2.93e-01 | -0.249 |
| 5286 | PIK3C2A | GSM6177620_NYU_UCEC1_lib1_lib1 | Human | Endometrium | EEC | 3.26e-12 | 2.46e-02 | -0.1869 |
| 5286 | PIK3C2A | GSM6177620_NYU_UCEC1_lib2_lib2 | Human | Endometrium | EEC | 8.76e-15 | 5.56e-02 | -0.1875 |
| 5286 | PIK3C2A | GSM6177620_NYU_UCEC1_lib3_lib3 | Human | Endometrium | EEC | 1.45e-14 | 2.47e-03 | -0.1883 |
| 5286 | PIK3C2A | GSM6177621_NYU_UCEC2_lib1_lib1 | Human | Endometrium | EEC | 1.15e-10 | 2.01e-02 | -0.1934 |
| 5286 | PIK3C2A | GSM6177622_NYU_UCEC3_lib1_lib1 | Human | Endometrium | EEC | 4.91e-20 | 1.04e-01 | -0.1917 |
| 5286 | PIK3C2A | GSM6177622_NYU_UCEC3_lib2_lib2 | Human | Endometrium | EEC | 1.06e-18 | 8.07e-02 | -0.1916 |
| 5286 | PIK3C2A | GSM6177623_NYU_UCEC3_Vis | Human | Endometrium | EEC | 1.37e-02 | 1.06e-01 | -0.1269 |
| 5286 | PIK3C2A | LZE4T | Human | Esophagus | ESCC | 1.28e-09 | 2.63e-01 | 0.0811 |
| 5286 | PIK3C2A | LZE5T | Human | Esophagus | ESCC | 9.78e-06 | 4.73e-01 | 0.0514 |
| Page: 1 2 3 4 5 6 7 8 |
| Tissue | Expression Dynamics | Abbreviation |
| Cervix | 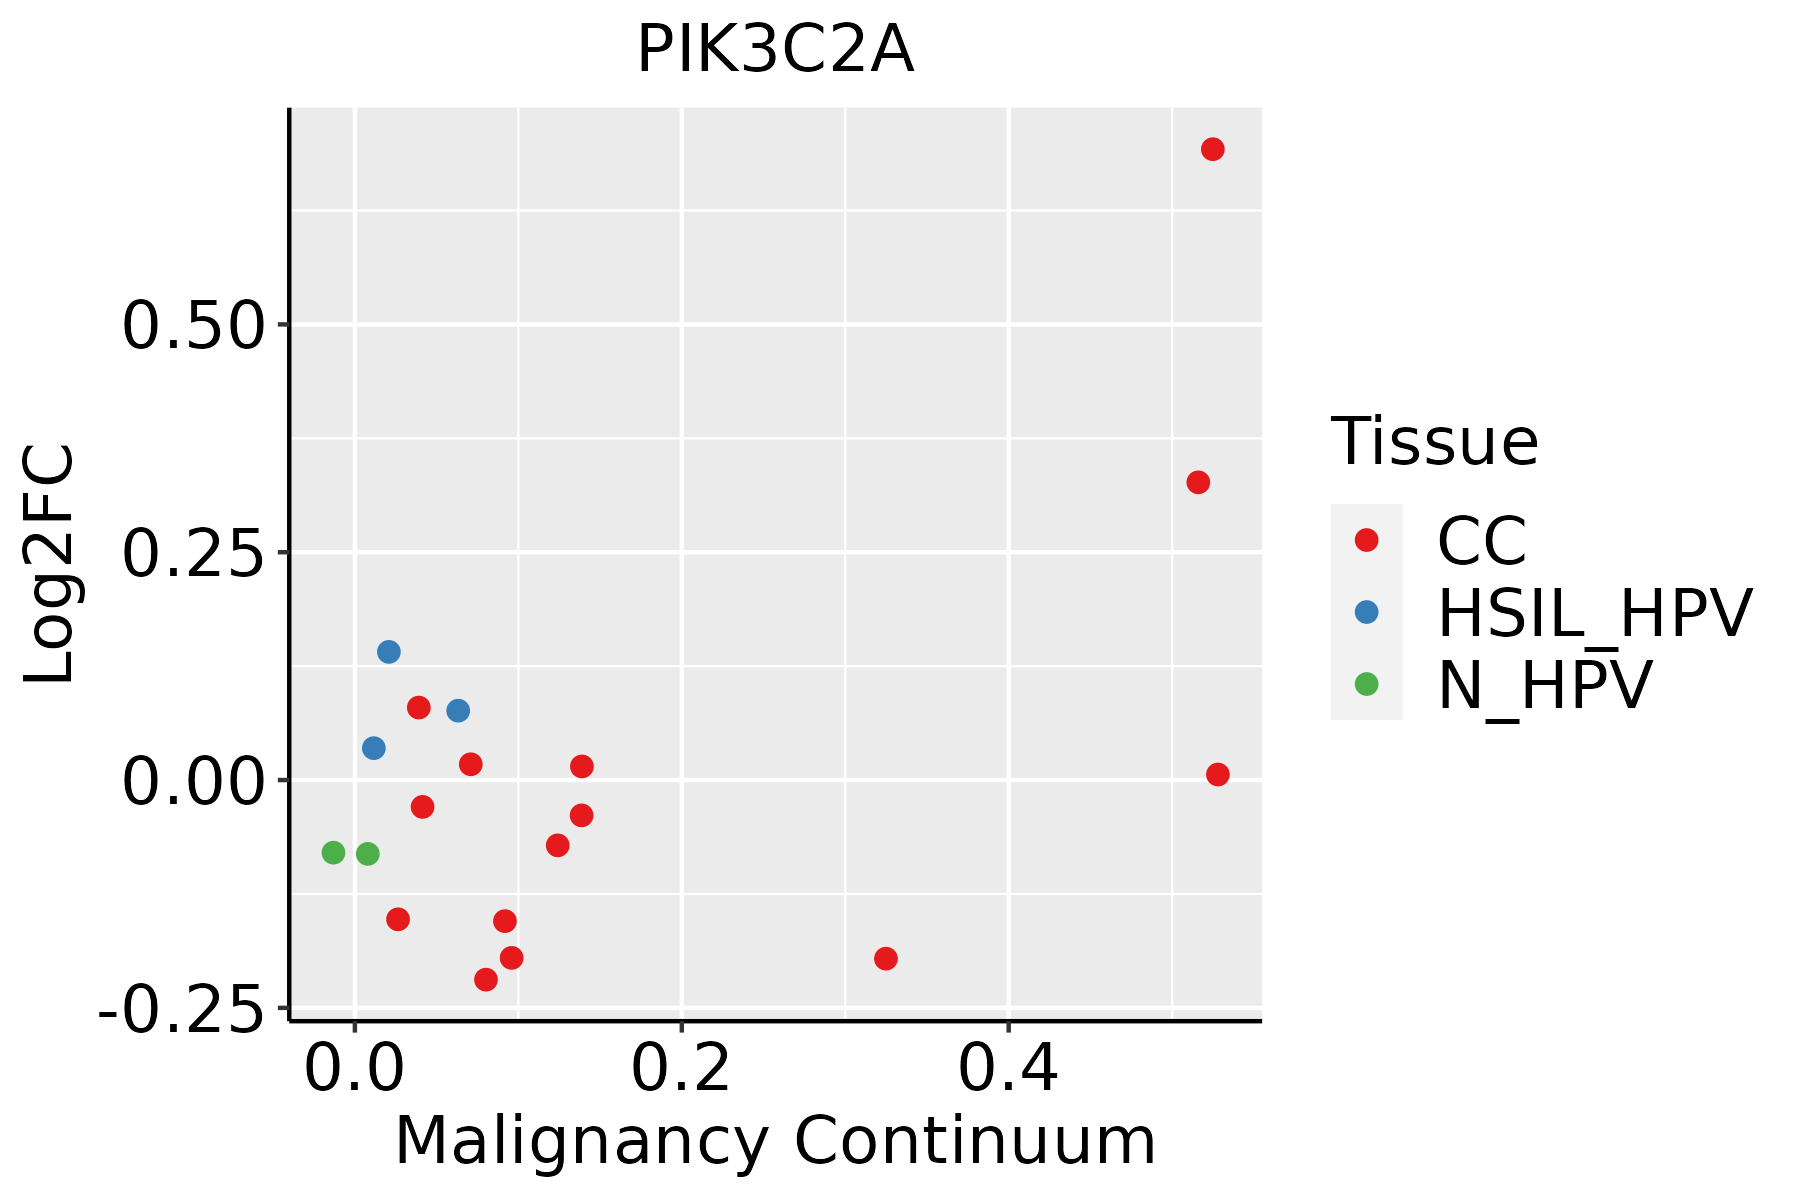 | CC: Cervix cancer |
| HSIL_HPV: HPV-infected high-grade squamous intraepithelial lesions | ||
| N_HPV: HPV-infected normal cervix | ||
| Endometrium | 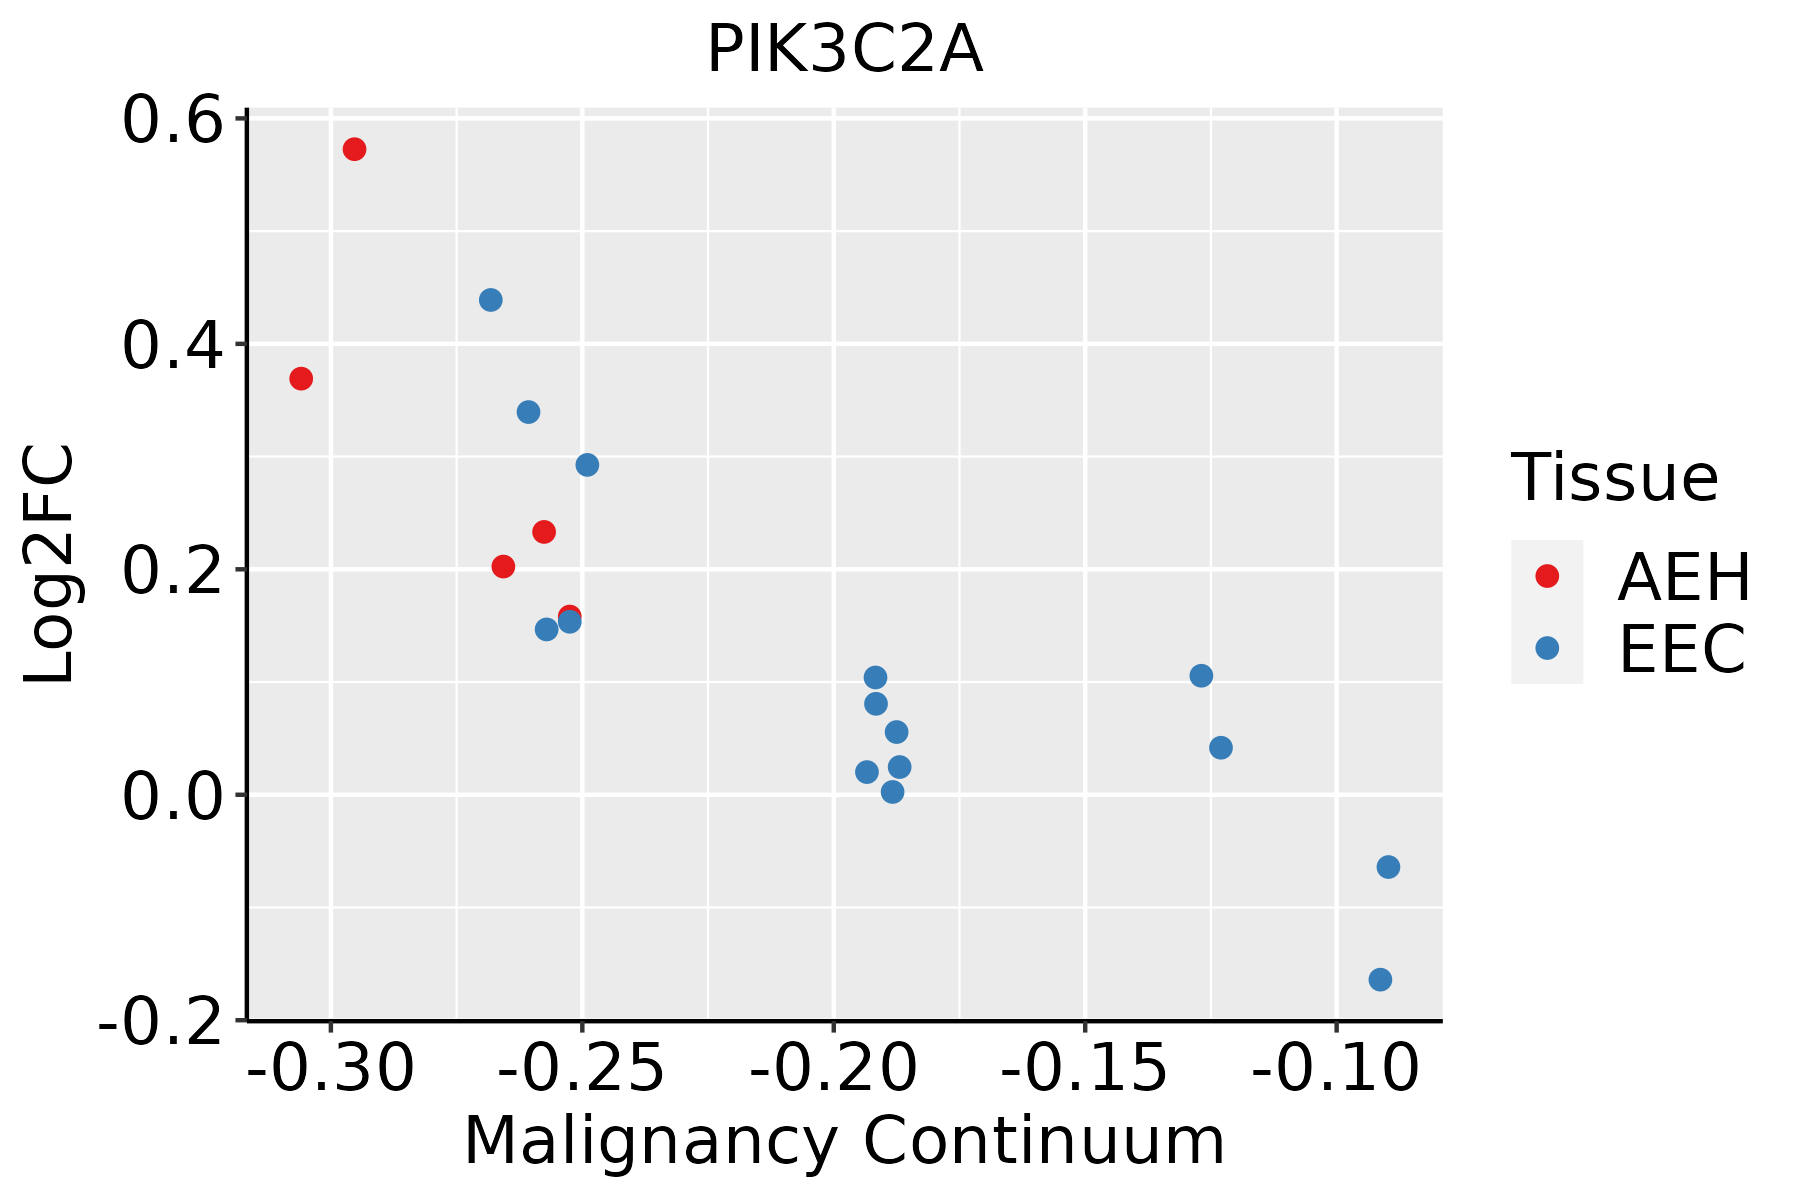 | AEH: Atypical endometrial hyperplasia |
| EEC: Endometrioid Cancer | ||
| Esophagus | 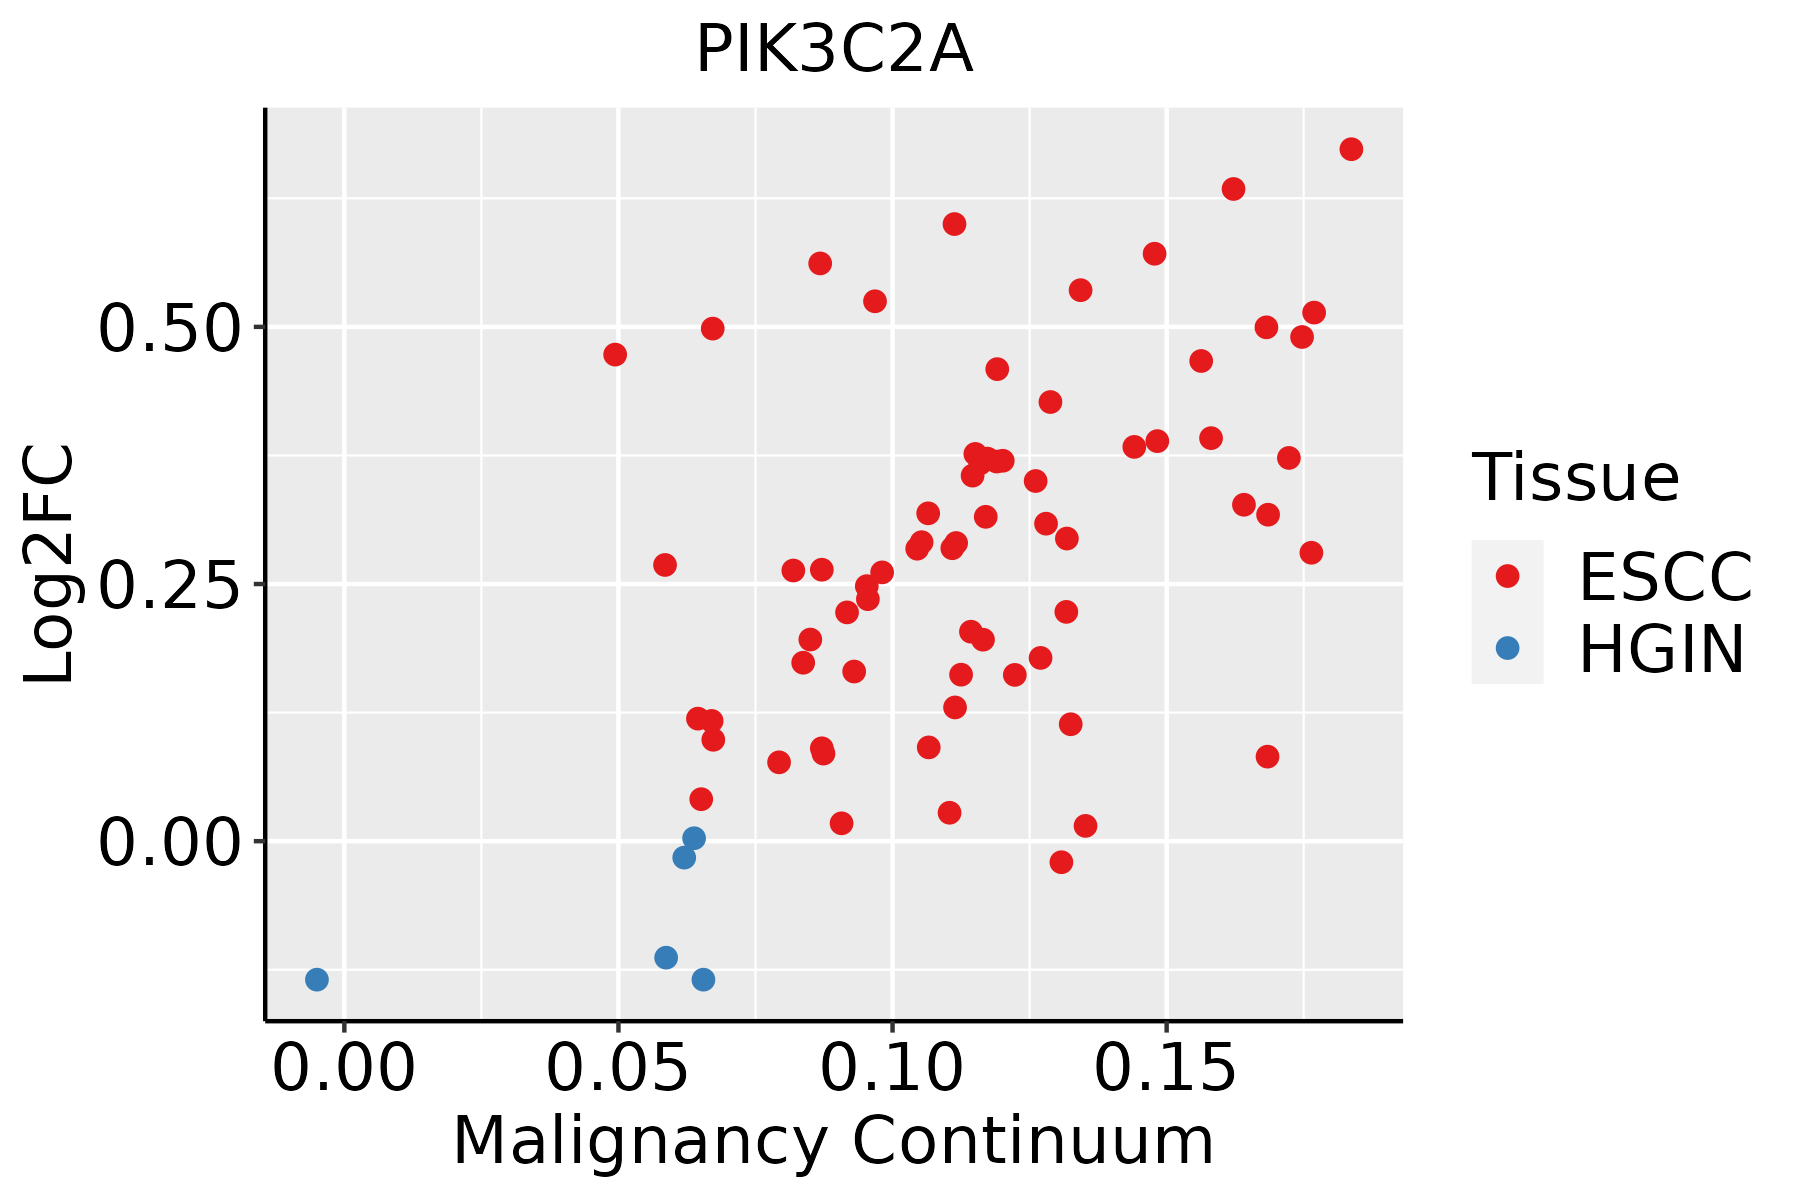 | ESCC: Esophageal squamous cell carcinoma |
| HGIN: High-grade intraepithelial neoplasias | ||
| LGIN: Low-grade intraepithelial neoplasias | ||
| Liver | 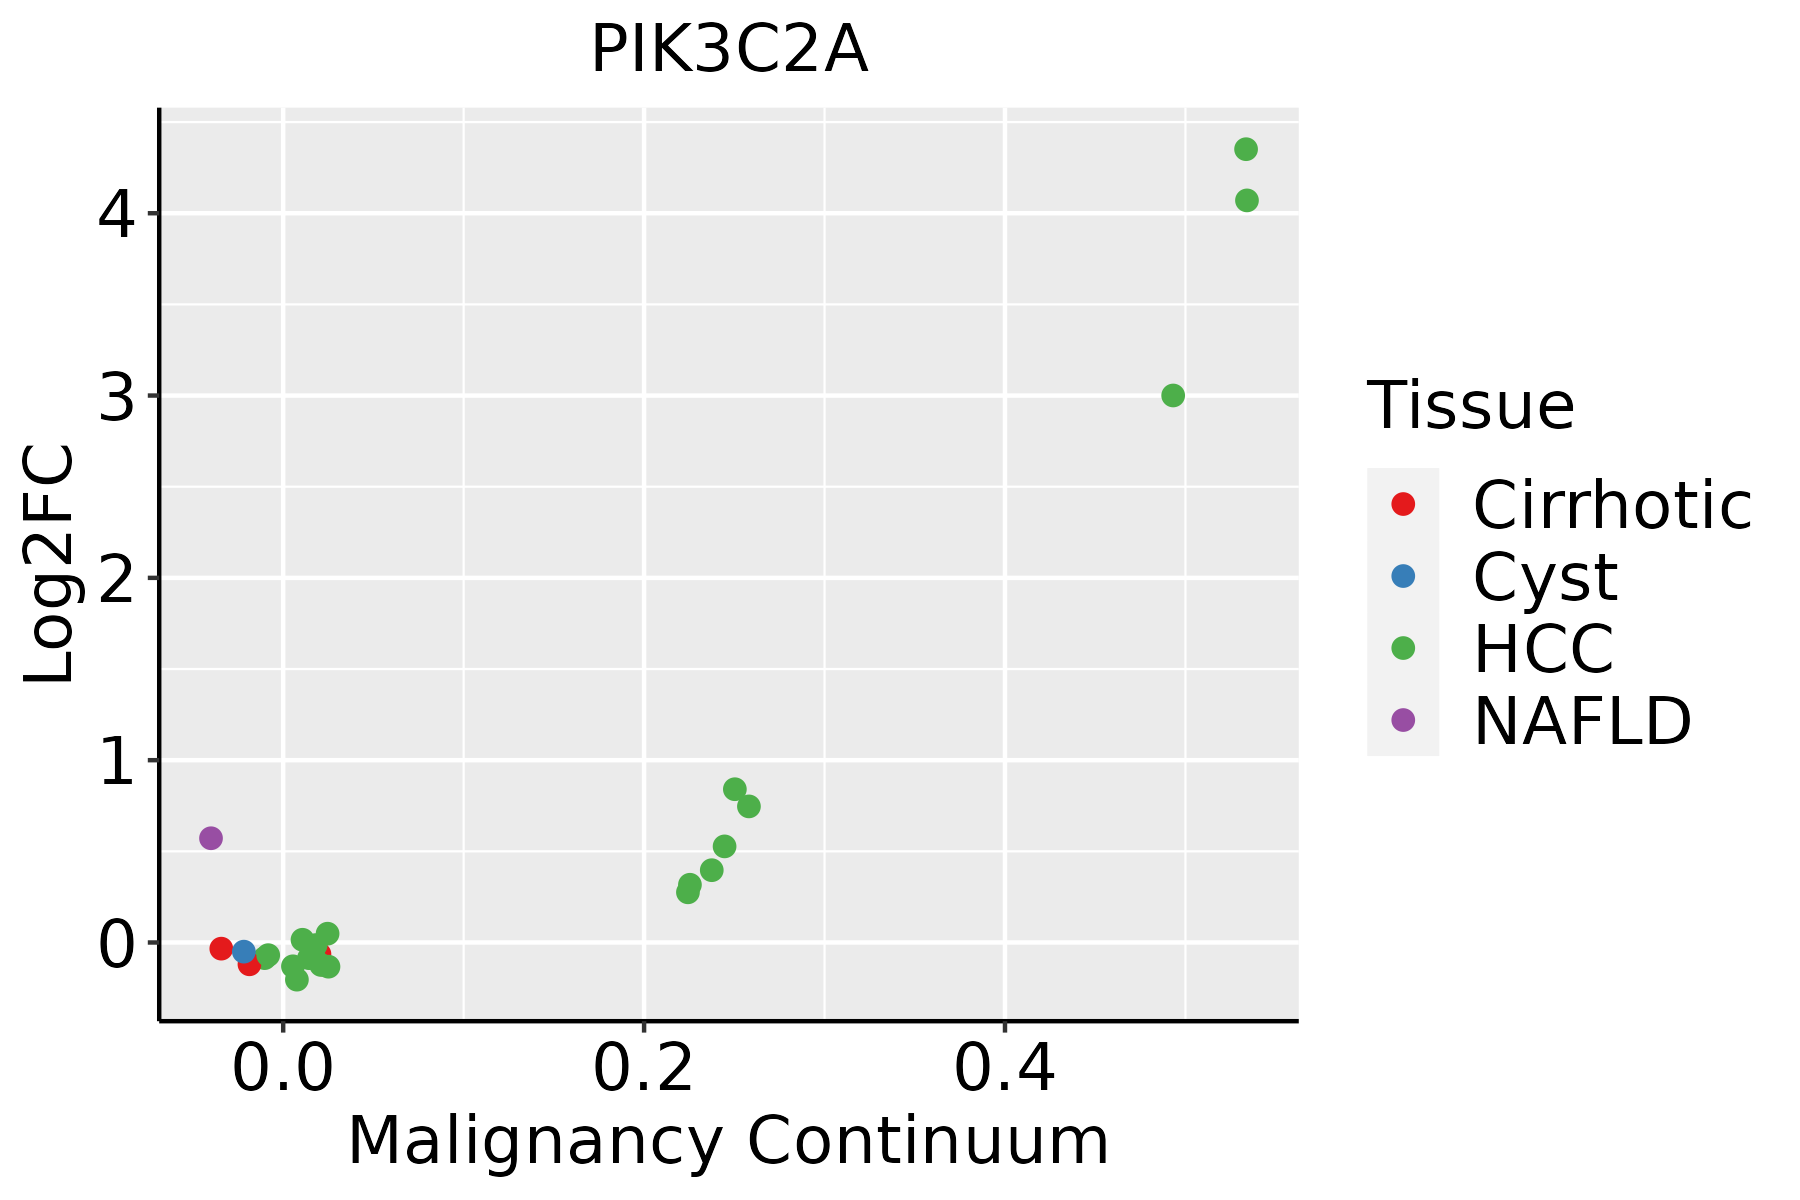 | HCC: Hepatocellular carcinoma |
| NAFLD: Non-alcoholic fatty liver disease | ||
| Lung | 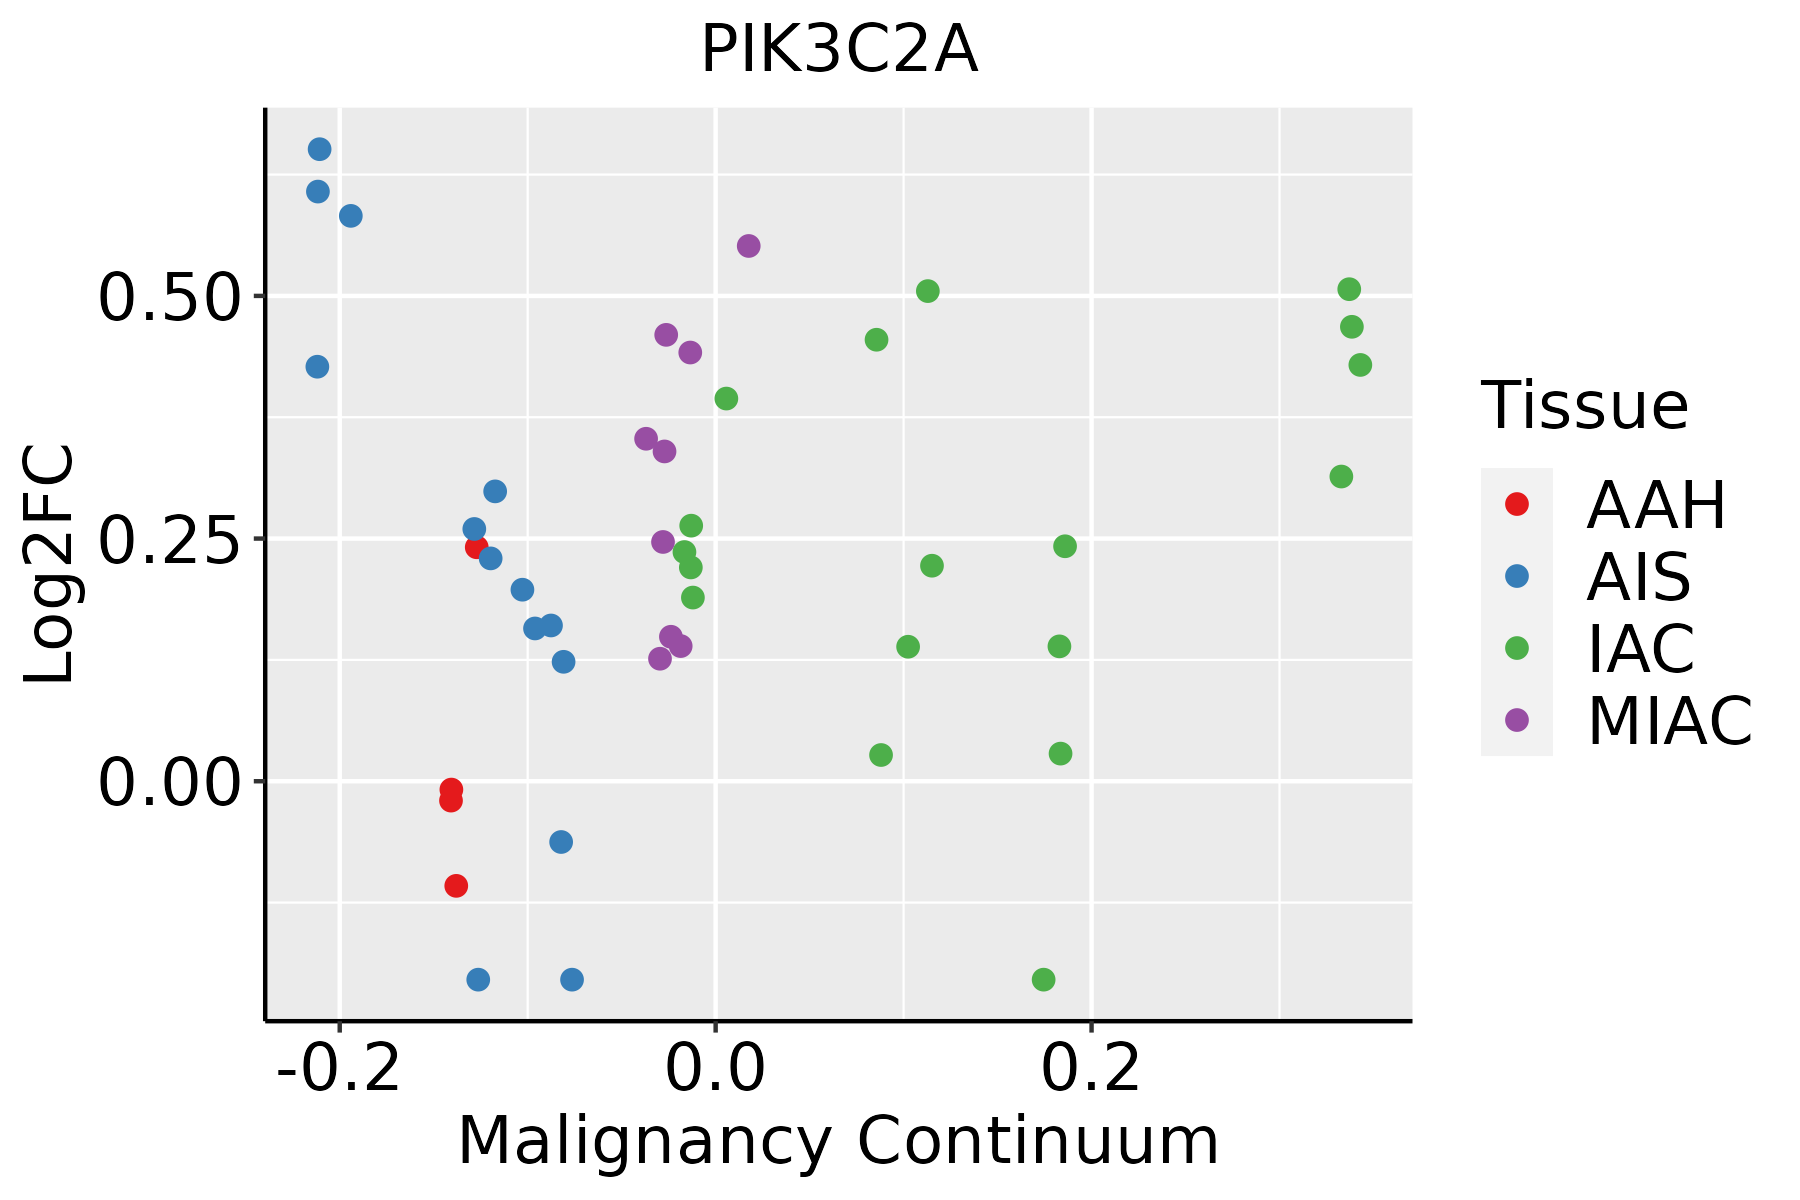 | AAH: Atypical adenomatous hyperplasia |
| AIS: Adenocarcinoma in situ | ||
| IAC: Invasive lung adenocarcinoma | ||
| MIA: Minimally invasive adenocarcinoma | ||
| Prostate | 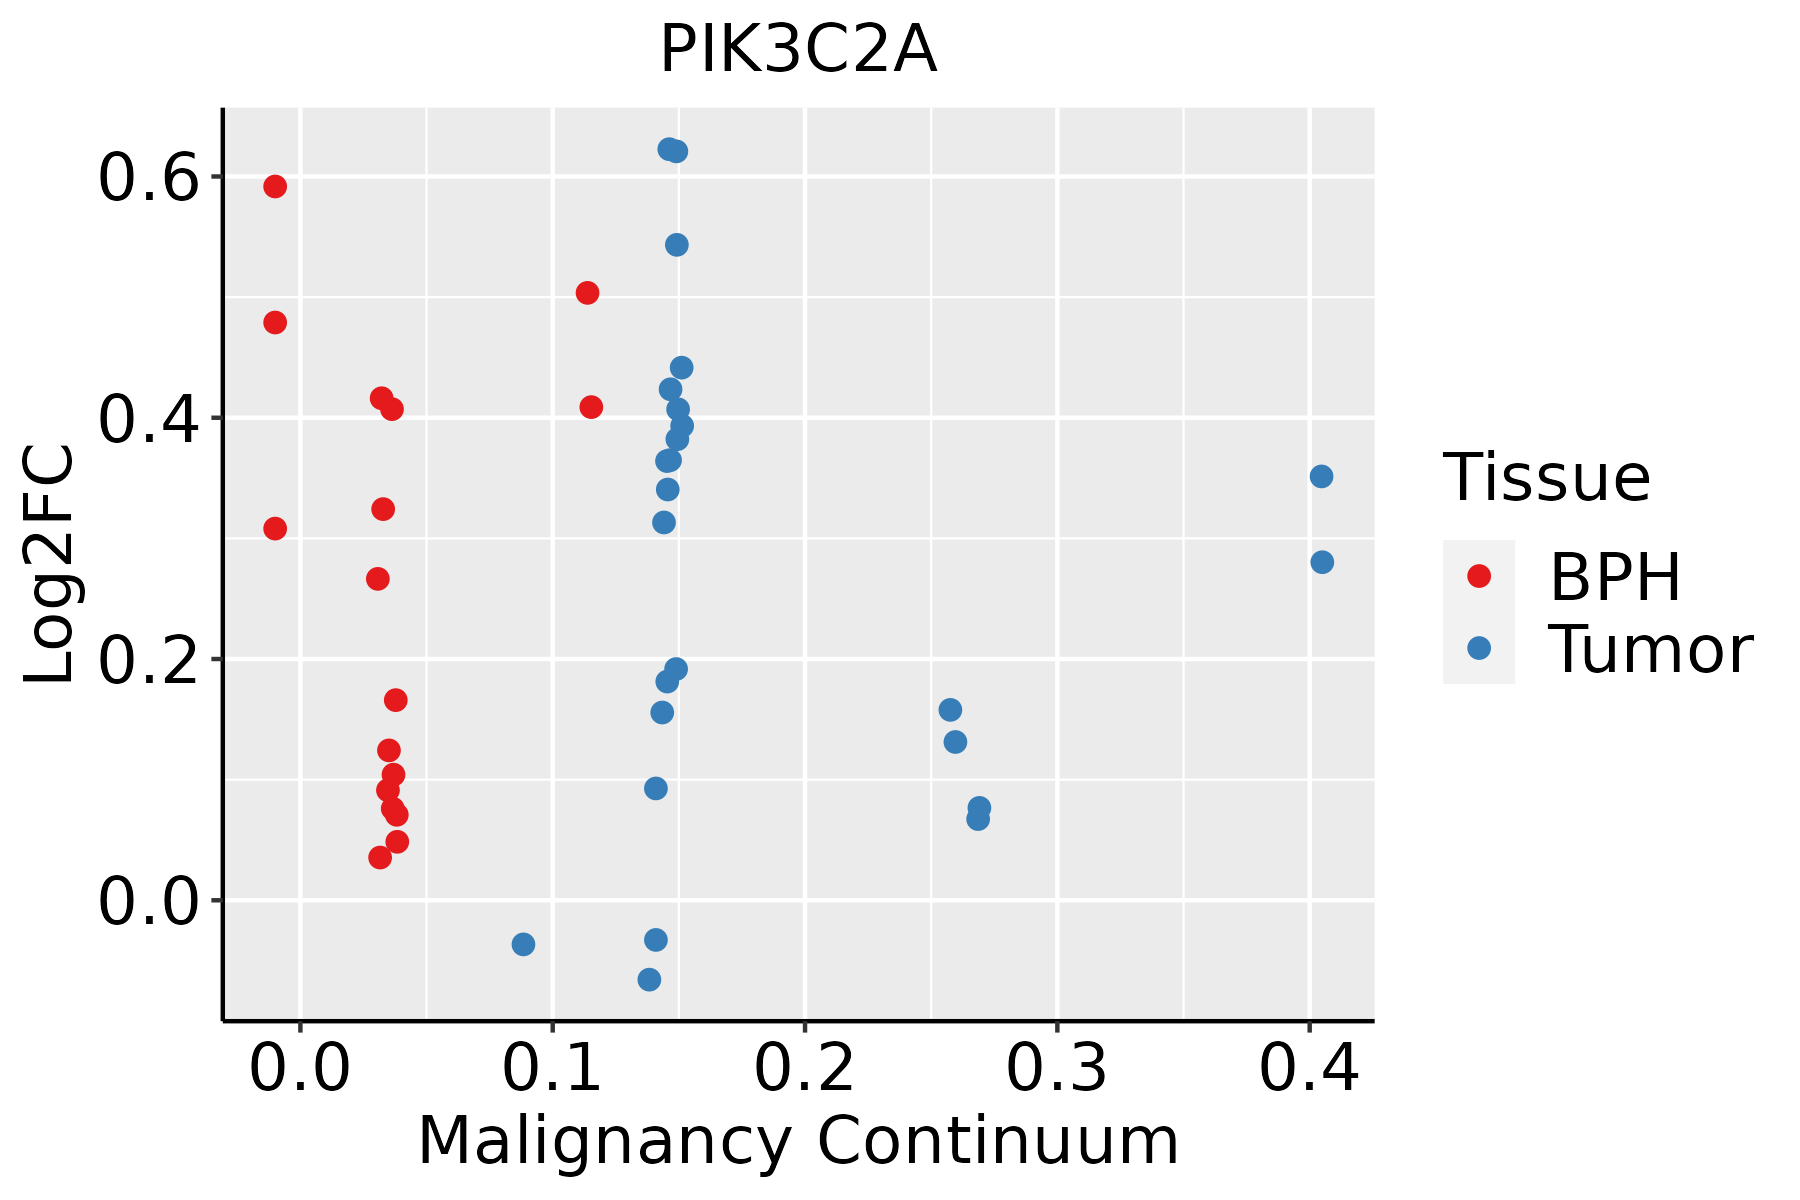 | BPH: Benign Prostatic Hyperplasia |
| Skin | 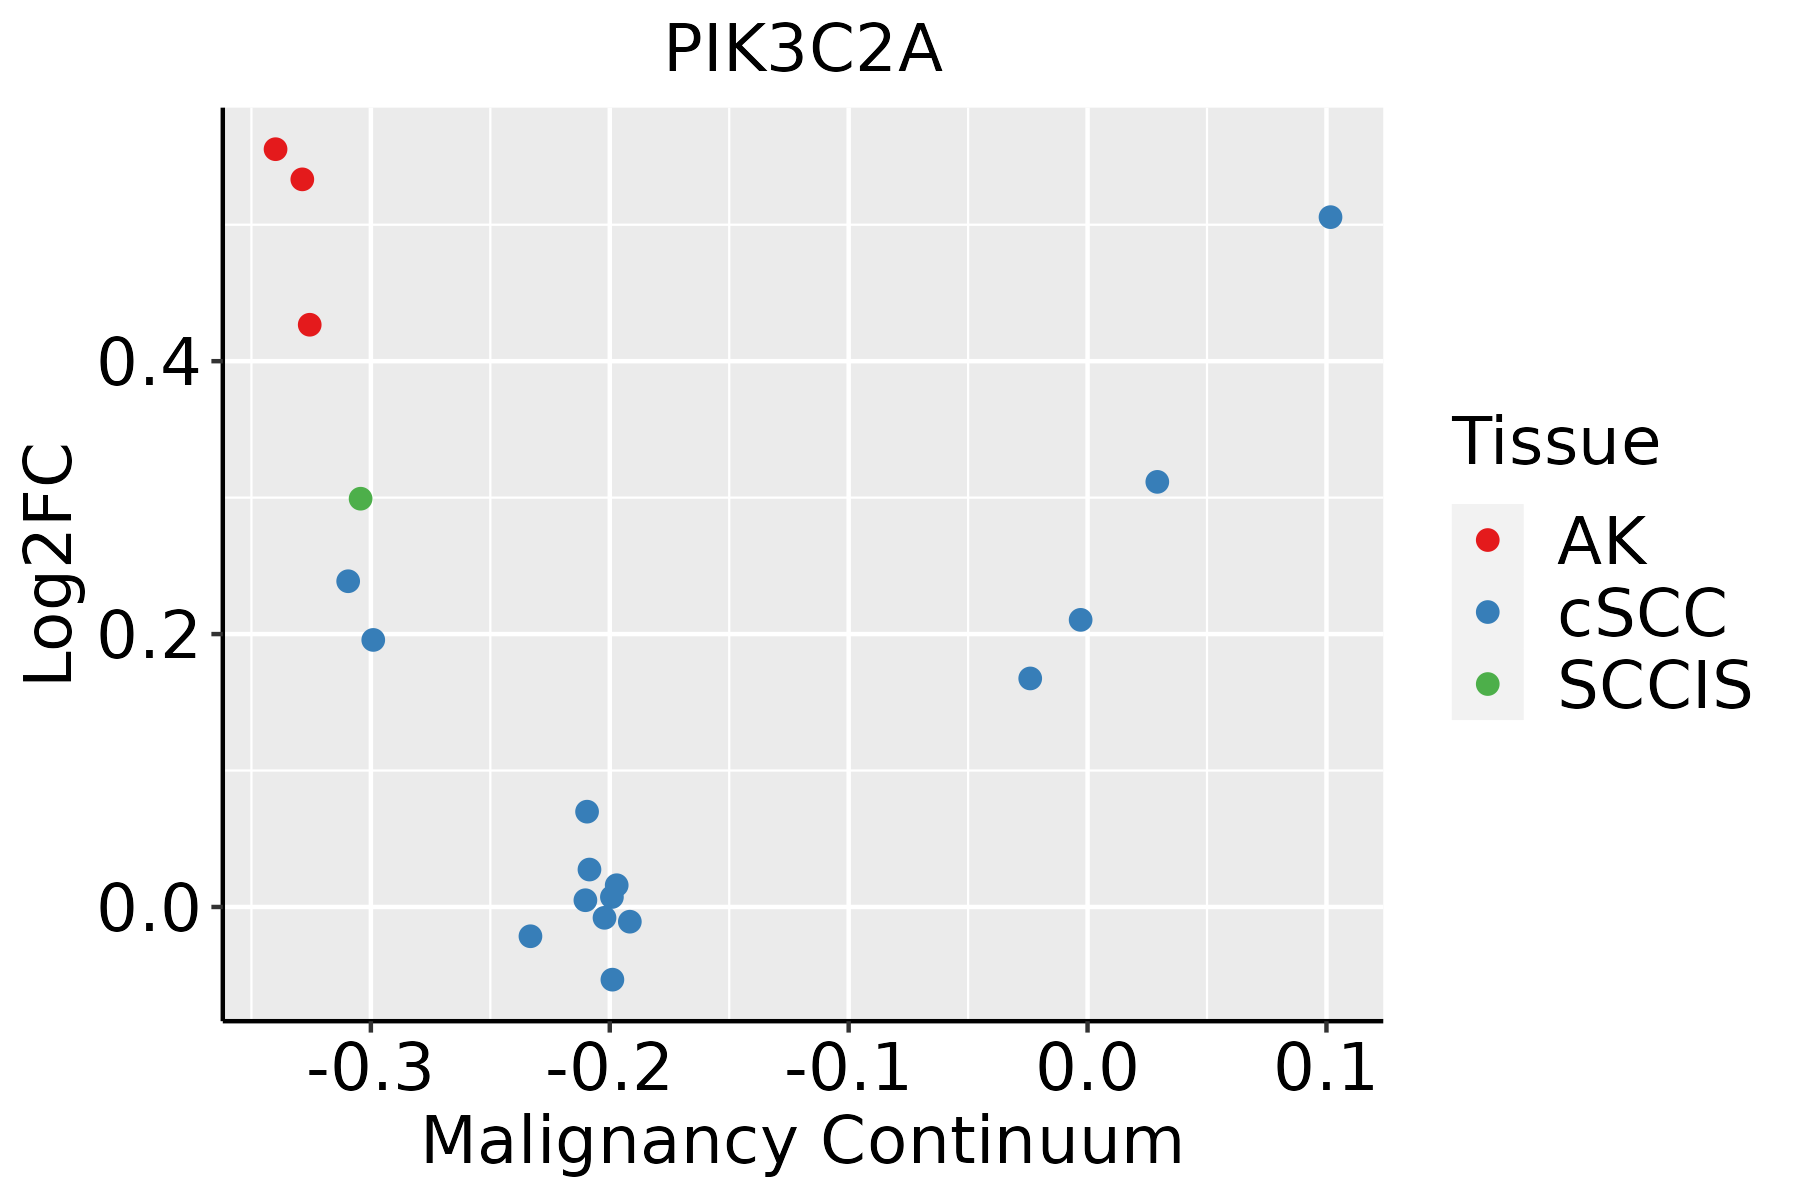 | AK: Actinic keratosis |
| cSCC: Cutaneous squamous cell carcinoma | ||
| SCCIS:squamous cell carcinoma in situ | ||
| Thyroid |  | ATC: Anaplastic thyroid cancer |
| HT: Hashimoto's thyroiditis | ||
| PTC: Papillary thyroid cancer |
| ∗log2FC in expression of this searched gene in stem-like cells from each diseased tissue sample relative to stem-like cells in normal samples in each tissue plotted against the malignancy continuum. Samples are colored based on if they are from different disease stage. |
Top |
Malignant transformation related pathway analysis |
| Find out the enriched GO biological processes and KEGG pathways involved in transition from healthy to precancer to cancer |
| Tissue | Disease Stage | Enriched GO biological Processes |
| Colorectum | AD |  |
| Colorectum | SER |  |
| Colorectum | MSS |  |
| Colorectum | MSI-H |  |
| Colorectum | FAP |  |
| ∗Top 15 enriched GO BP terms are showed in the bar plot of each disease state in each tissue. Each row represents a significant GO biological process which is colored according to the -log10(p.adjust). |
| Page: 1 2 3 4 5 6 7 8 9 |
| GO ID | Tissue | Disease Stage | Description | Gene Ratio | Bg Ratio | pvalue | p.adjust | Count |
| GO:0010506110 | Thyroid | PTC | regulation of autophagy | 172/5968 | 317/18723 | 8.76e-17 | 7.57e-15 | 172 |
| GO:1901653111 | Thyroid | PTC | cellular response to peptide | 169/5968 | 359/18723 | 9.81e-10 | 2.89e-08 | 169 |
| GO:0043434113 | Thyroid | PTC | response to peptide hormone | 188/5968 | 414/18723 | 4.13e-09 | 1.09e-07 | 188 |
| GO:001050810 | Thyroid | PTC | positive regulation of autophagy | 70/5968 | 124/18723 | 1.30e-08 | 3.08e-07 | 70 |
| GO:0071375110 | Thyroid | PTC | cellular response to peptide hormone stimulus | 136/5968 | 290/18723 | 5.49e-08 | 1.17e-06 | 136 |
| GO:0032869111 | Thyroid | PTC | cellular response to insulin stimulus | 100/5968 | 203/18723 | 1.70e-07 | 3.19e-06 | 100 |
| GO:0032868111 | Thyroid | PTC | response to insulin | 124/5968 | 264/18723 | 1.87e-07 | 3.47e-06 | 124 |
| GO:003812720 | Thyroid | PTC | ERBB signaling pathway | 66/5968 | 121/18723 | 1.97e-07 | 3.54e-06 | 66 |
| GO:000717320 | Thyroid | PTC | epidermal growth factor receptor signaling pathway | 59/5968 | 108/18723 | 8.00e-07 | 1.23e-05 | 59 |
| GO:0001667112 | Thyroid | PTC | ameboidal-type cell migration | 198/5968 | 475/18723 | 3.36e-06 | 4.34e-05 | 198 |
| GO:0010634111 | Thyroid | PTC | positive regulation of epithelial cell migration | 85/5968 | 176/18723 | 3.83e-06 | 4.80e-05 | 85 |
| GO:00480089 | Thyroid | PTC | platelet-derived growth factor receptor signaling pathway | 34/5968 | 56/18723 | 8.20e-06 | 9.42e-05 | 34 |
| GO:000828617 | Thyroid | PTC | insulin receptor signaling pathway | 58/5968 | 116/18723 | 3.59e-05 | 3.36e-04 | 58 |
| GO:0010631111 | Thyroid | PTC | epithelial cell migration | 149/5968 | 357/18723 | 4.83e-05 | 4.33e-04 | 149 |
| GO:0090132111 | Thyroid | PTC | epithelium migration | 149/5968 | 360/18723 | 7.89e-05 | 6.74e-04 | 149 |
| GO:0090130111 | Thyroid | PTC | tissue migration | 150/5968 | 365/18723 | 1.13e-04 | 9.01e-04 | 150 |
| GO:0010632111 | Thyroid | PTC | regulation of epithelial cell migration | 123/5968 | 292/18723 | 1.33e-04 | 1.05e-03 | 123 |
| GO:001059516 | Thyroid | PTC | positive regulation of endothelial cell migration | 61/5968 | 133/18723 | 4.95e-04 | 3.25e-03 | 61 |
| GO:004354219 | Thyroid | PTC | endothelial cell migration | 112/5968 | 279/18723 | 2.03e-03 | 1.09e-02 | 112 |
| GO:004826815 | Thyroid | PTC | clathrin coat assembly | 12/5968 | 18/18723 | 2.55e-03 | 1.31e-02 | 12 |
| Page: 1 2 3 4 5 6 7 8 9 10 11 12 13 14 15 16 17 18 |
| Pathway ID | Tissue | Disease Stage | Description | Gene Ratio | Bg Ratio | pvalue | p.adjust | qvalue | Count |
| hsa0513220 | Cervix | CC | Salmonella infection | 74/1267 | 249/8465 | 1.33e-09 | 2.54e-08 | 1.50e-08 | 74 |
| hsa05132110 | Cervix | CC | Salmonella infection | 74/1267 | 249/8465 | 1.33e-09 | 2.54e-08 | 1.50e-08 | 74 |
| hsa0513226 | Endometrium | AEH | Salmonella infection | 71/1197 | 249/8465 | 1.69e-09 | 3.44e-08 | 2.52e-08 | 71 |
| hsa05132112 | Endometrium | AEH | Salmonella infection | 71/1197 | 249/8465 | 1.69e-09 | 3.44e-08 | 2.52e-08 | 71 |
| hsa0513227 | Endometrium | EEC | Salmonella infection | 71/1237 | 249/8465 | 7.11e-09 | 1.30e-07 | 9.69e-08 | 71 |
| hsa0513236 | Endometrium | EEC | Salmonella infection | 71/1237 | 249/8465 | 7.11e-09 | 1.30e-07 | 9.69e-08 | 71 |
| hsa05132211 | Esophagus | ESCC | Salmonella infection | 191/4205 | 249/8465 | 6.51e-19 | 5.45e-17 | 2.79e-17 | 191 |
| hsa05132310 | Esophagus | ESCC | Salmonella infection | 191/4205 | 249/8465 | 6.51e-19 | 5.45e-17 | 2.79e-17 | 191 |
| hsa0513214 | Liver | NAFLD | Salmonella infection | 55/1043 | 249/8465 | 8.48e-06 | 3.09e-04 | 2.49e-04 | 55 |
| hsa0513215 | Liver | NAFLD | Salmonella infection | 55/1043 | 249/8465 | 8.48e-06 | 3.09e-04 | 2.49e-04 | 55 |
| hsa0513242 | Liver | HCC | Salmonella infection | 178/4020 | 249/8465 | 5.90e-15 | 1.98e-13 | 1.10e-13 | 178 |
| hsa0513252 | Liver | HCC | Salmonella infection | 178/4020 | 249/8465 | 5.90e-15 | 1.98e-13 | 1.10e-13 | 178 |
| hsa0513216 | Lung | IAC | Salmonella infection | 52/1053 | 249/8465 | 9.46e-05 | 1.28e-03 | 8.50e-04 | 52 |
| hsa0513217 | Lung | IAC | Salmonella infection | 52/1053 | 249/8465 | 9.46e-05 | 1.28e-03 | 8.50e-04 | 52 |
| hsa0513223 | Lung | AIS | Salmonella infection | 50/961 | 249/8465 | 3.47e-05 | 5.62e-04 | 3.59e-04 | 50 |
| hsa0513233 | Lung | AIS | Salmonella infection | 50/961 | 249/8465 | 3.47e-05 | 5.62e-04 | 3.59e-04 | 50 |
| hsa0513228 | Prostate | BPH | Salmonella infection | 99/1718 | 249/8465 | 7.26e-13 | 1.50e-11 | 9.27e-12 | 99 |
| hsa05132113 | Prostate | BPH | Salmonella infection | 99/1718 | 249/8465 | 7.26e-13 | 1.50e-11 | 9.27e-12 | 99 |
| hsa0513229 | Prostate | Tumor | Salmonella infection | 98/1791 | 249/8465 | 2.55e-11 | 5.28e-10 | 3.27e-10 | 98 |
| hsa0513237 | Prostate | Tumor | Salmonella infection | 98/1791 | 249/8465 | 2.55e-11 | 5.28e-10 | 3.27e-10 | 98 |
| Page: 1 |
Top |
Cell-cell communication analysis |
| Identification of potential cell-cell interactions between two cell types and their ligand-receptor pairs for different disease states |
| Ligand | Receptor | LRpair | Pathway | Tissue | Disease Stage |
| Page: 1 |
Top |
Single-cell gene regulatory network inference analysis |
| Find out the significant the regulons (TFs) and the target genes of each regulon across cell types for different disease states |
| TF | Cell Type | Tissue | Disease Stage | Target Gene | RSS | Regulon Activity |
| ∗The dot plots of a searched regulon are shown for all cell subpopulations in each disease state of each tissue based on the regulon specific score inferred using pySCENIC and by calculating the average expression. |
| Page: 1 |
Top |
Somatic mutation of malignant transformation related genes |
| Annotation of somatic variants for genes involved in malignant transformation |
| Hugo Symbol | Variant Class | Variant Classification | dbSNP RS | HGVSc | HGVSp | HGVSp Short | SWISSPROT | BIOTYPE | SIFT | PolyPhen | Tumor Sample Barcode | Tissue | Histology | Sex | Age | Stage | Therapy Types | Drugs | Outcome |
| PIK3C2A | SNV | Missense_Mutation | c.185N>C | p.Arg62Thr | p.R62T | O00443 | protein_coding | tolerated_low_confidence(0.56) | benign(0.01) | TCGA-AR-A1AJ-01 | Breast | breast invasive carcinoma | Female | >=65 | I/II | Unknown | Unknown | SD | |
| PIK3C2A | SNV | Missense_Mutation | novel | c.4297N>T | p.His1433Tyr | p.H1433Y | O00443 | protein_coding | deleterious(0) | possibly_damaging(0.589) | TCGA-AR-A24U-01 | Breast | breast invasive carcinoma | Female | <65 | I/II | Chemotherapy | doxorubicin | SD |
| PIK3C2A | SNV | Missense_Mutation | c.742A>T | p.Ile248Leu | p.I248L | O00443 | protein_coding | tolerated_low_confidence(0.5) | benign(0.003) | TCGA-BH-A1FD-01 | Breast | breast invasive carcinoma | Female | >=65 | I/II | Unknown | Unknown | PD | |
| PIK3C2A | SNV | Missense_Mutation | c.4022G>A | p.Gly1341Glu | p.G1341E | O00443 | protein_coding | deleterious(0) | possibly_damaging(0.885) | TCGA-C8-A12K-01 | Breast | breast invasive carcinoma | Female | >=65 | I/II | Unknown | Unknown | SD | |
| PIK3C2A | SNV | Missense_Mutation | rs374593257 | c.642N>G | p.Ile214Met | p.I214M | O00443 | protein_coding | tolerated_low_confidence(0.31) | benign(0.021) | TCGA-GM-A3XL-01 | Breast | breast invasive carcinoma | Female | <65 | I/II | Chemotherapy | fluorouracil | CR |
| PIK3C2A | insertion | Frame_Shift_Ins | novel | c.256_257insA | p.Arg86LysfsTer6 | p.R86Kfs*6 | O00443 | protein_coding | TCGA-A8-A09Z-01 | Breast | breast invasive carcinoma | Female | >=65 | I/II | Unknown | Unknown | SD | ||
| PIK3C2A | deletion | Frame_Shift_Del | c.4970delN | p.Phe1657SerfsTer5 | p.F1657Sfs*5 | O00443 | protein_coding | TCGA-AN-A0AK-01 | Breast | breast invasive carcinoma | Female | >=65 | I/II | Unknown | Unknown | SD | |||
| PIK3C2A | insertion | In_Frame_Ins | novel | c.1373_1374insCACAGGAATACATAGTTGCCTATGGCAAAG | p.Val458_His459insThrGlyIleHisSerCysLeuTrpGlnArg | p.V458_H459insTGIHSCLWQR | O00443 | protein_coding | TCGA-BH-A0AY-01 | Breast | breast invasive carcinoma | Female | <65 | I/II | Chemotherapy | SD | |||
| PIK3C2A | deletion | Frame_Shift_Del | novel | c.2064delN | p.Phe688LeufsTer22 | p.F688Lfs*22 | O00443 | protein_coding | TCGA-D8-A27V-01 | Breast | breast invasive carcinoma | Female | <65 | I/II | Hormone Therapy | tamoxiphen | SD | ||
| PIK3C2A | deletion | Frame_Shift_Del | novel | c.1423delT | p.Cys475ValfsTer34 | p.C475Vfs*34 | O00443 | protein_coding | TCGA-EW-A2FV-01 | Breast | breast invasive carcinoma | Female | <65 | III/IV | Chemotherapy | docetaxel | SD |
| Page: 1 2 3 4 5 6 7 8 9 10 11 12 13 14 15 16 17 18 |
Top |
Related drugs of malignant transformation related genes |
| Identification of chemicals and drugs interact with genes involved in malignant transfromation |
| (DGIdb 4.0) |
| Entrez ID | Symbol | Category | Interaction Types | Drug Claim Name | Drug Name | PMIDs |
| 5286 | PIK3C2A | ENZYME, DRUGGABLE GENOME, PHOSPHATIDYLINOSITOL 3 KINASE, KINASE, TRANSPORTER | inhibitor | XL147 | PILARALISIB | |
| 5286 | PIK3C2A | ENZYME, DRUGGABLE GENOME, PHOSPHATIDYLINOSITOL 3 KINASE, KINASE, TRANSPORTER | inhibitor | BAY80-6946 | COPANLISIB | |
| 5286 | PIK3C2A | ENZYME, DRUGGABLE GENOME, PHOSPHATIDYLINOSITOL 3 KINASE, KINASE, TRANSPORTER | inhibitor | BYL719 | ALPELISIB | |
| 5286 | PIK3C2A | ENZYME, DRUGGABLE GENOME, PHOSPHATIDYLINOSITOL 3 KINASE, KINASE, TRANSPORTER | inhibitor | PI-103 | PI-103 | |
| 5286 | PIK3C2A | ENZYME, DRUGGABLE GENOME, PHOSPHATIDYLINOSITOL 3 KINASE, KINASE, TRANSPORTER | inhibitor | PF-4691502 | PF-04691502 | |
| 5286 | PIK3C2A | ENZYME, DRUGGABLE GENOME, PHOSPHATIDYLINOSITOL 3 KINASE, KINASE, TRANSPORTER | inhibitor | BKM120 | BUPARLISIB | |
| 5286 | PIK3C2A | ENZYME, DRUGGABLE GENOME, PHOSPHATIDYLINOSITOL 3 KINASE, KINASE, TRANSPORTER | inhibitor | GSK2636771 | GSK-2636771 | |
| 5286 | PIK3C2A | ENZYME, DRUGGABLE GENOME, PHOSPHATIDYLINOSITOL 3 KINASE, KINASE, TRANSPORTER | inhibitor | PX-866 | SONOLISIB | |
| 5286 | PIK3C2A | ENZYME, DRUGGABLE GENOME, PHOSPHATIDYLINOSITOL 3 KINASE, KINASE, TRANSPORTER | inhibitor | BGJ398 | INFIGRATINIB | |
| 5286 | PIK3C2A | ENZYME, DRUGGABLE GENOME, PHOSPHATIDYLINOSITOL 3 KINASE, KINASE, TRANSPORTER | inhibitor | PKI-587 | GEDATOLISIB |
| Page: 1 2 |

Copyright 2023-Present -The University of Texas Health Science Center at Houston |