
|
|||||
|
 | |
| |
| |
| |
| |
| |
|
Gene: PHLDA2 |
Gene summary for PHLDA2 |
| Gene information | Species | Human | Gene symbol | PHLDA2 | Gene ID | 7262 |
| Gene name | pleckstrin homology like domain family A member 2 | |
| Gene Alias | BRW1C | |
| Cytomap | 11p15.4 | |
| Gene Type | protein-coding | GO ID | GO:0000003 | UniProtAcc | Q53GA4 |
Top |
Malignant transformation analysis |
| Identification of the aberrant gene expression in precancerous and cancerous lesions by comparing the gene expression of stem-like cells in diseased tissues with normal stem cells |
| Entrez ID | Symbol | Replicates | Species | Organ | Tissue | Adj P-value | Log2FC | Malignancy |
| 7262 | PHLDA2 | GSM4909280 | Human | Breast | Precancer | 2.97e-09 | 7.28e-01 | 0.0305 |
| 7262 | PHLDA2 | GSM4909281 | Human | Breast | IDC | 3.84e-12 | -4.58e-01 | 0.21 |
| 7262 | PHLDA2 | GSM4909282 | Human | Breast | IDC | 5.50e-05 | 4.01e-01 | -0.0288 |
| 7262 | PHLDA2 | GSM4909286 | Human | Breast | IDC | 1.43e-31 | -6.14e-01 | 0.1081 |
| 7262 | PHLDA2 | GSM4909288 | Human | Breast | IDC | 2.16e-06 | -5.32e-01 | 0.0988 |
| 7262 | PHLDA2 | GSM4909293 | Human | Breast | IDC | 3.40e-14 | -4.66e-01 | 0.1581 |
| 7262 | PHLDA2 | GSM4909294 | Human | Breast | IDC | 1.76e-05 | -3.09e-01 | 0.2022 |
| 7262 | PHLDA2 | GSM4909296 | Human | Breast | IDC | 1.81e-06 | -1.99e-01 | 0.1524 |
| 7262 | PHLDA2 | GSM4909297 | Human | Breast | IDC | 4.79e-07 | 1.46e-01 | 0.1517 |
| 7262 | PHLDA2 | GSM4909298 | Human | Breast | IDC | 3.72e-08 | -4.17e-01 | 0.1551 |
| 7262 | PHLDA2 | GSM4909301 | Human | Breast | IDC | 9.81e-10 | -3.92e-01 | 0.1577 |
| 7262 | PHLDA2 | GSM4909302 | Human | Breast | IDC | 7.17e-03 | -3.31e-01 | 0.1545 |
| 7262 | PHLDA2 | GSM4909306 | Human | Breast | IDC | 2.62e-05 | -3.36e-01 | 0.1564 |
| 7262 | PHLDA2 | GSM4909308 | Human | Breast | IDC | 3.64e-03 | 1.94e-01 | 0.158 |
| 7262 | PHLDA2 | GSM4909311 | Human | Breast | IDC | 8.70e-23 | -4.84e-01 | 0.1534 |
| 7262 | PHLDA2 | GSM4909312 | Human | Breast | IDC | 1.82e-25 | -5.29e-01 | 0.1552 |
| 7262 | PHLDA2 | GSM4909315 | Human | Breast | IDC | 7.24e-04 | -2.91e-01 | 0.21 |
| 7262 | PHLDA2 | GSM4909317 | Human | Breast | IDC | 1.17e-02 | 3.50e-01 | 0.1355 |
| 7262 | PHLDA2 | GSM4909319 | Human | Breast | IDC | 7.15e-30 | -3.94e-01 | 0.1563 |
| 7262 | PHLDA2 | GSM4909320 | Human | Breast | IDC | 7.05e-03 | -2.24e-01 | 0.1575 |
| Page: 1 2 3 4 5 6 7 8 9 10 11 12 13 |
| Tissue | Expression Dynamics | Abbreviation |
| Breast | 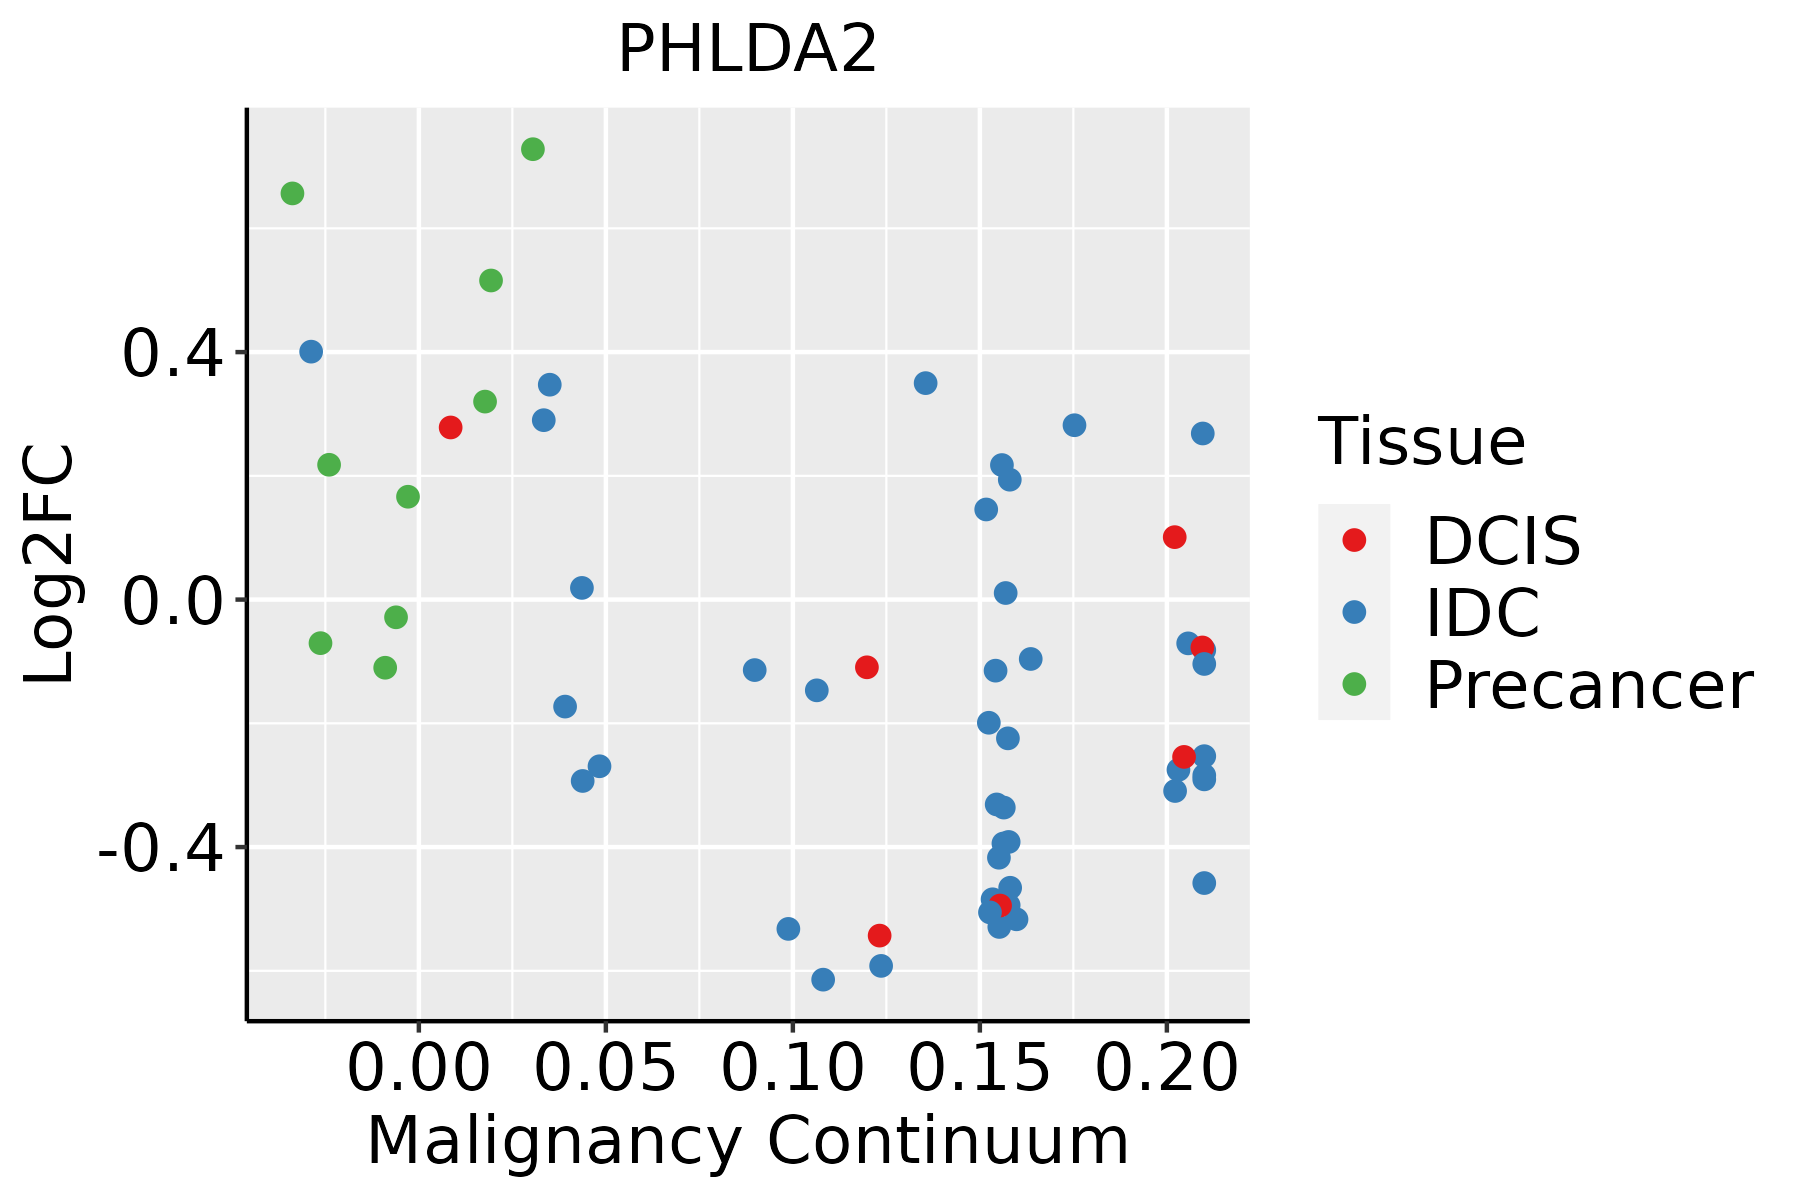 | IDC: Invasive ductal carcinoma |
| DCIS: Ductal carcinoma in situ | ||
| Precancer(BRCA1-mut): Precancerous lesion from BRCA1 mutation carriers | ||
| Cervix | 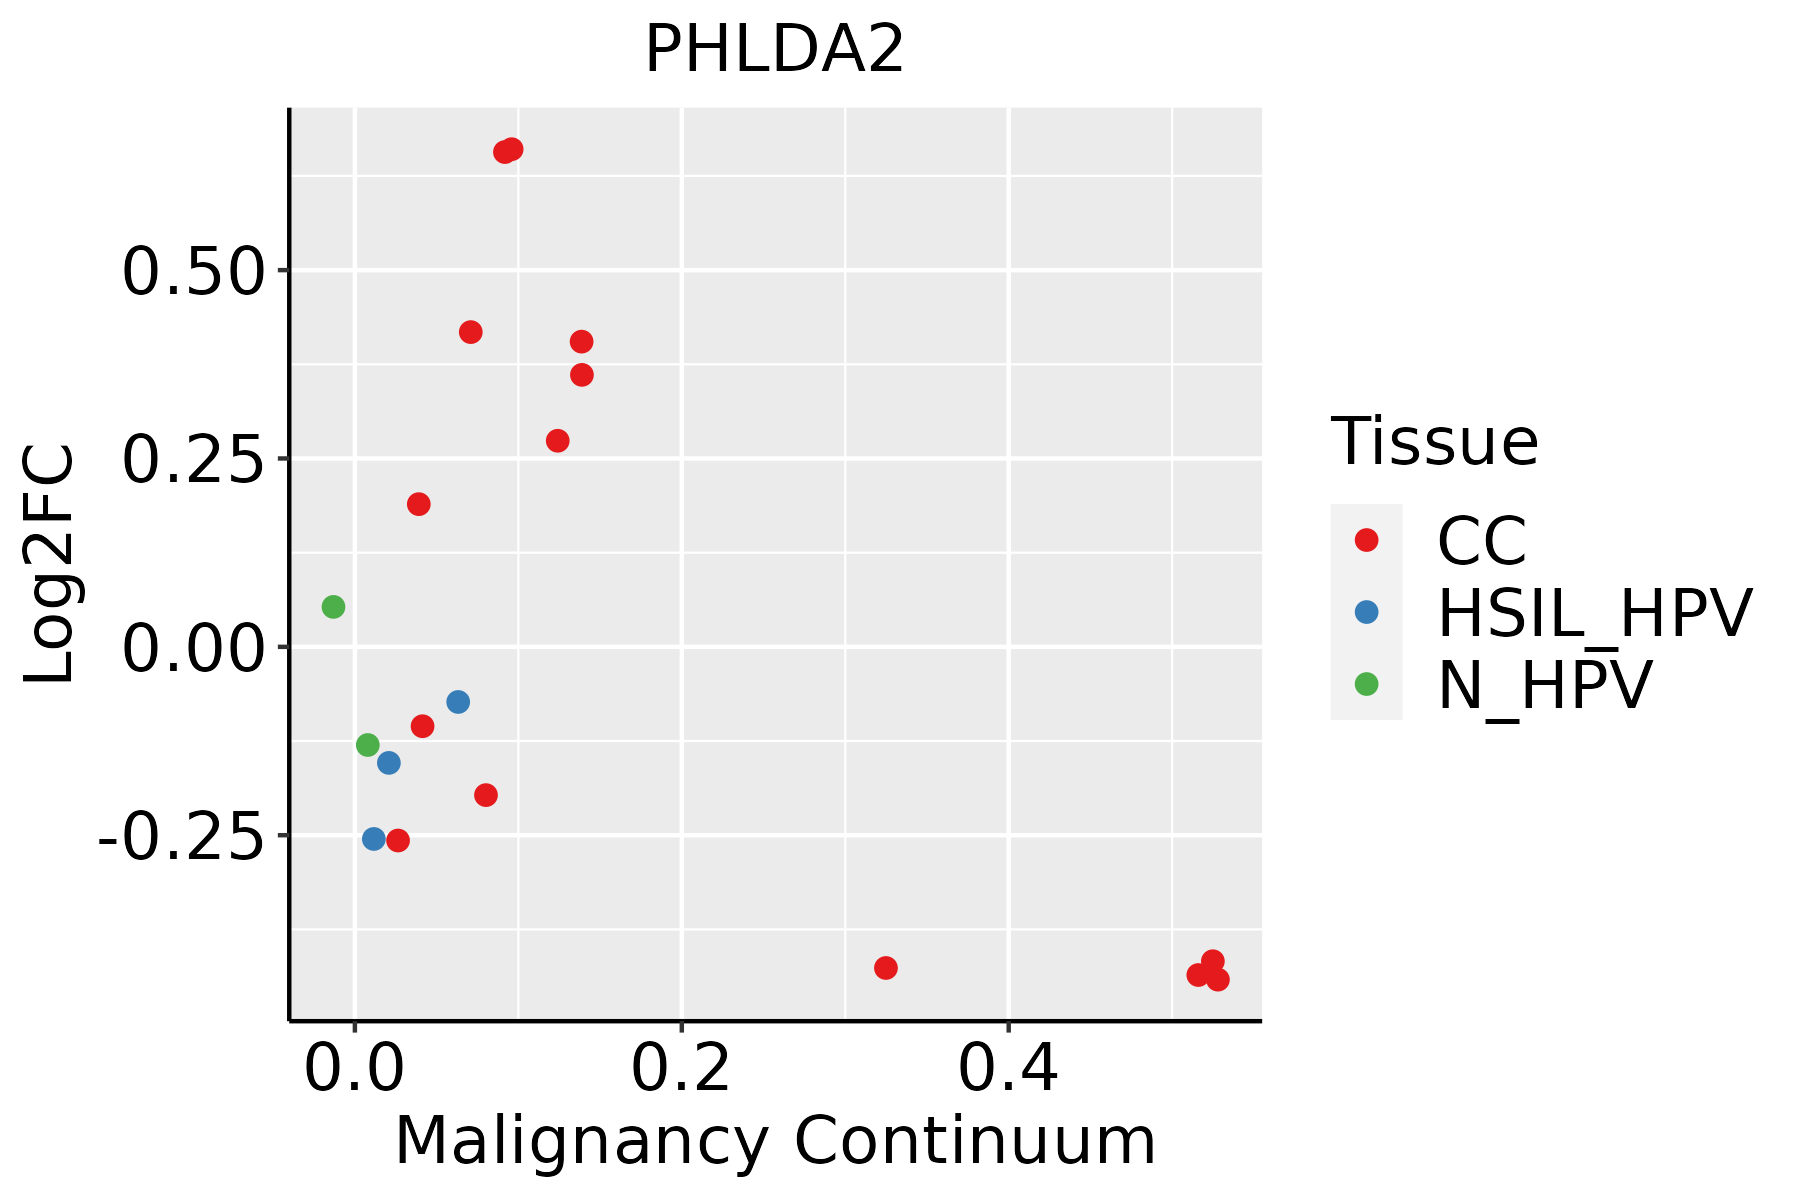 | CC: Cervix cancer |
| HSIL_HPV: HPV-infected high-grade squamous intraepithelial lesions | ||
| N_HPV: HPV-infected normal cervix | ||
| Colorectum (GSE201348) |  | FAP: Familial adenomatous polyposis |
| CRC: Colorectal cancer | ||
| Colorectum (HTA11) |  | AD: Adenomas |
| SER: Sessile serrated lesions | ||
| MSI-H: Microsatellite-high colorectal cancer | ||
| MSS: Microsatellite stable colorectal cancer | ||
| Endometrium | 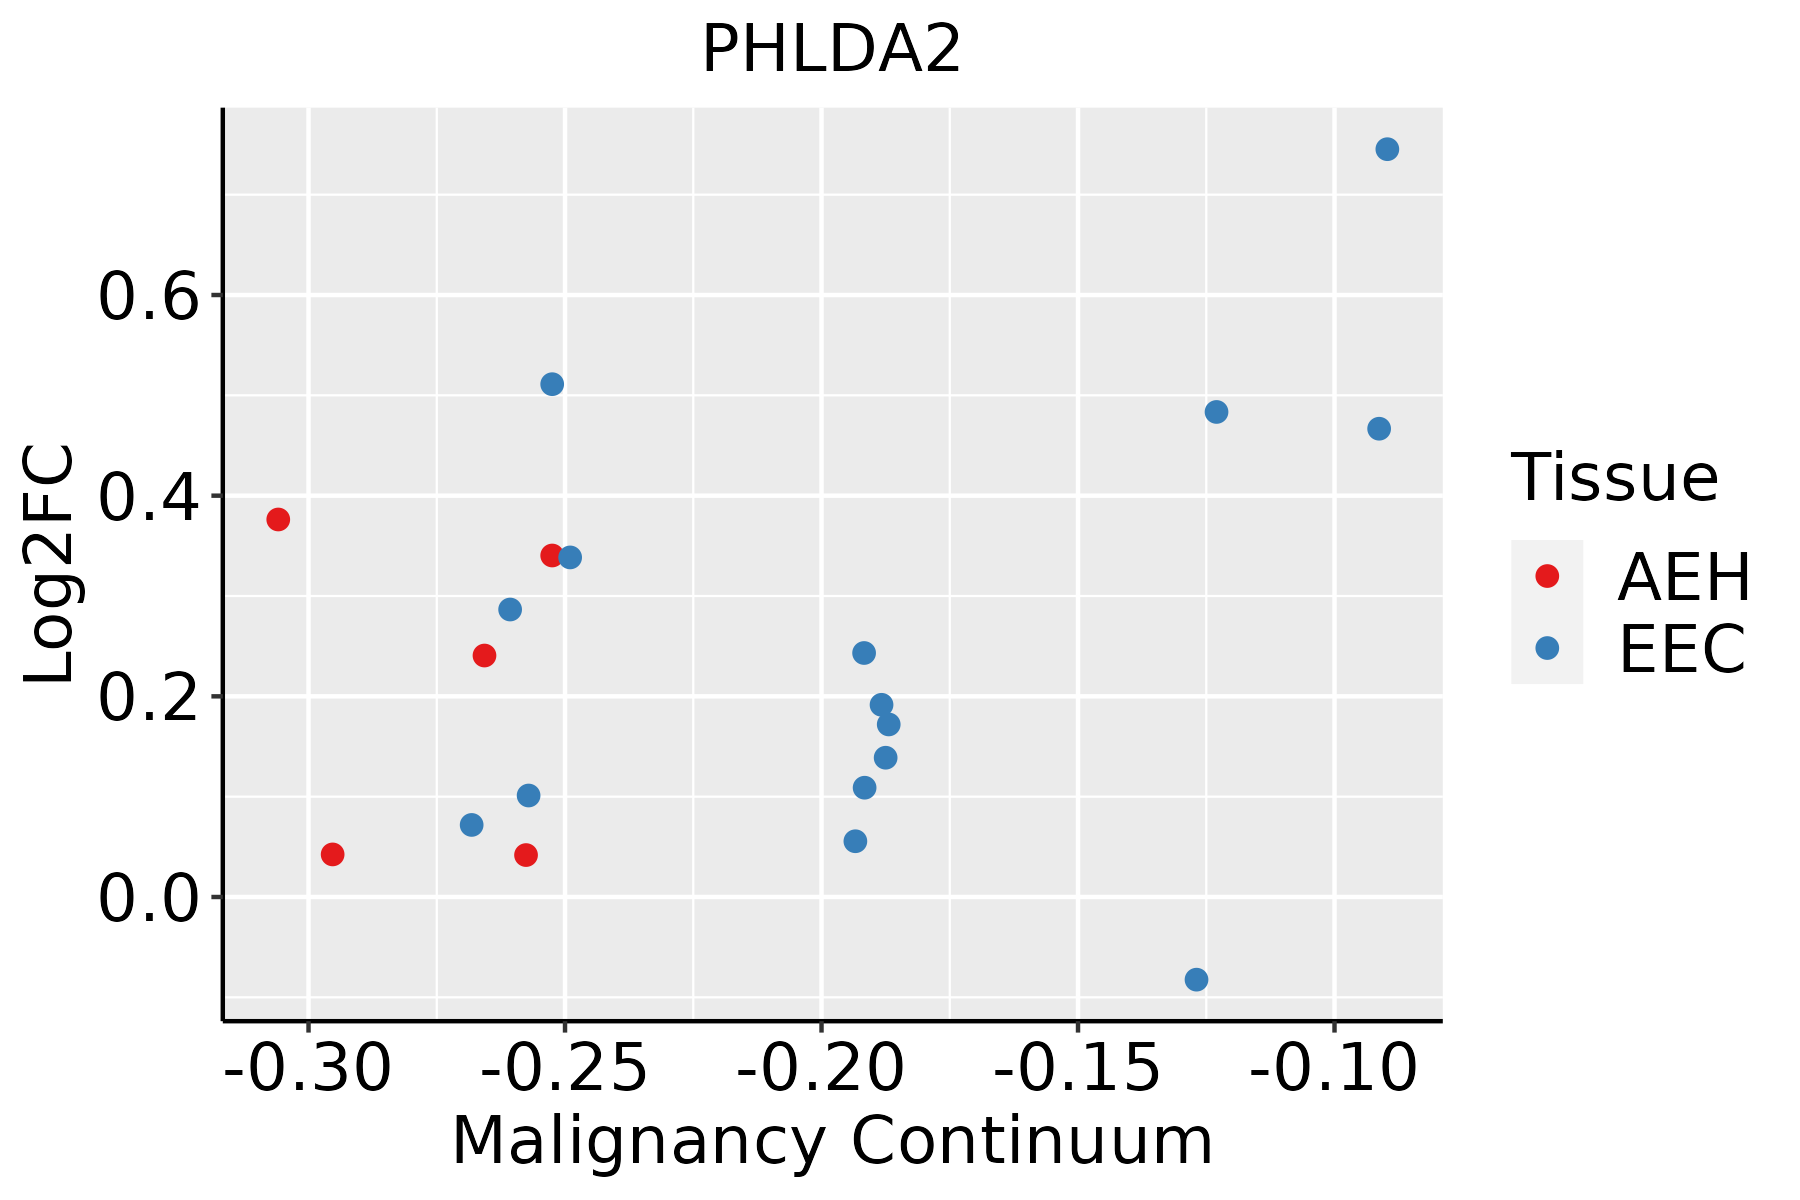 | AEH: Atypical endometrial hyperplasia |
| EEC: Endometrioid Cancer | ||
| Esophagus | 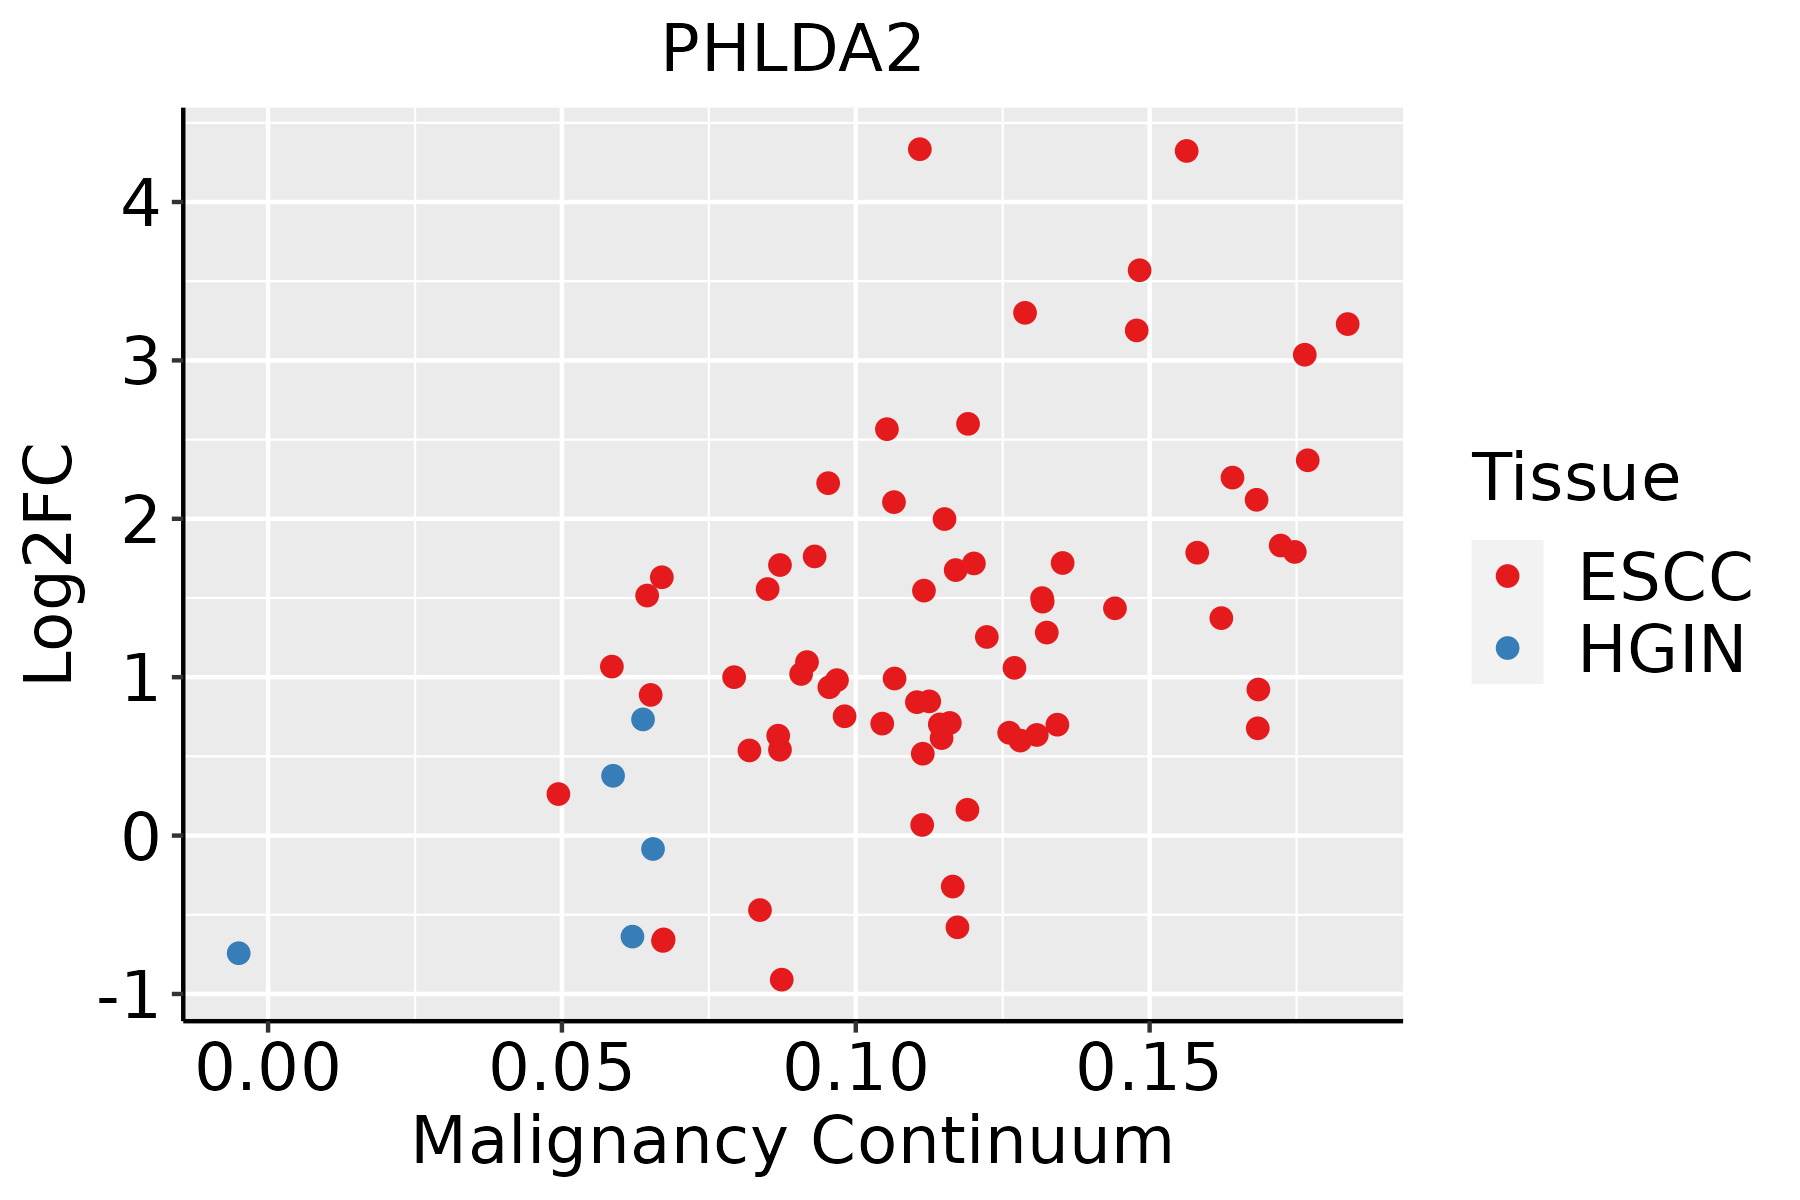 | ESCC: Esophageal squamous cell carcinoma |
| HGIN: High-grade intraepithelial neoplasias | ||
| LGIN: Low-grade intraepithelial neoplasias | ||
| GC | 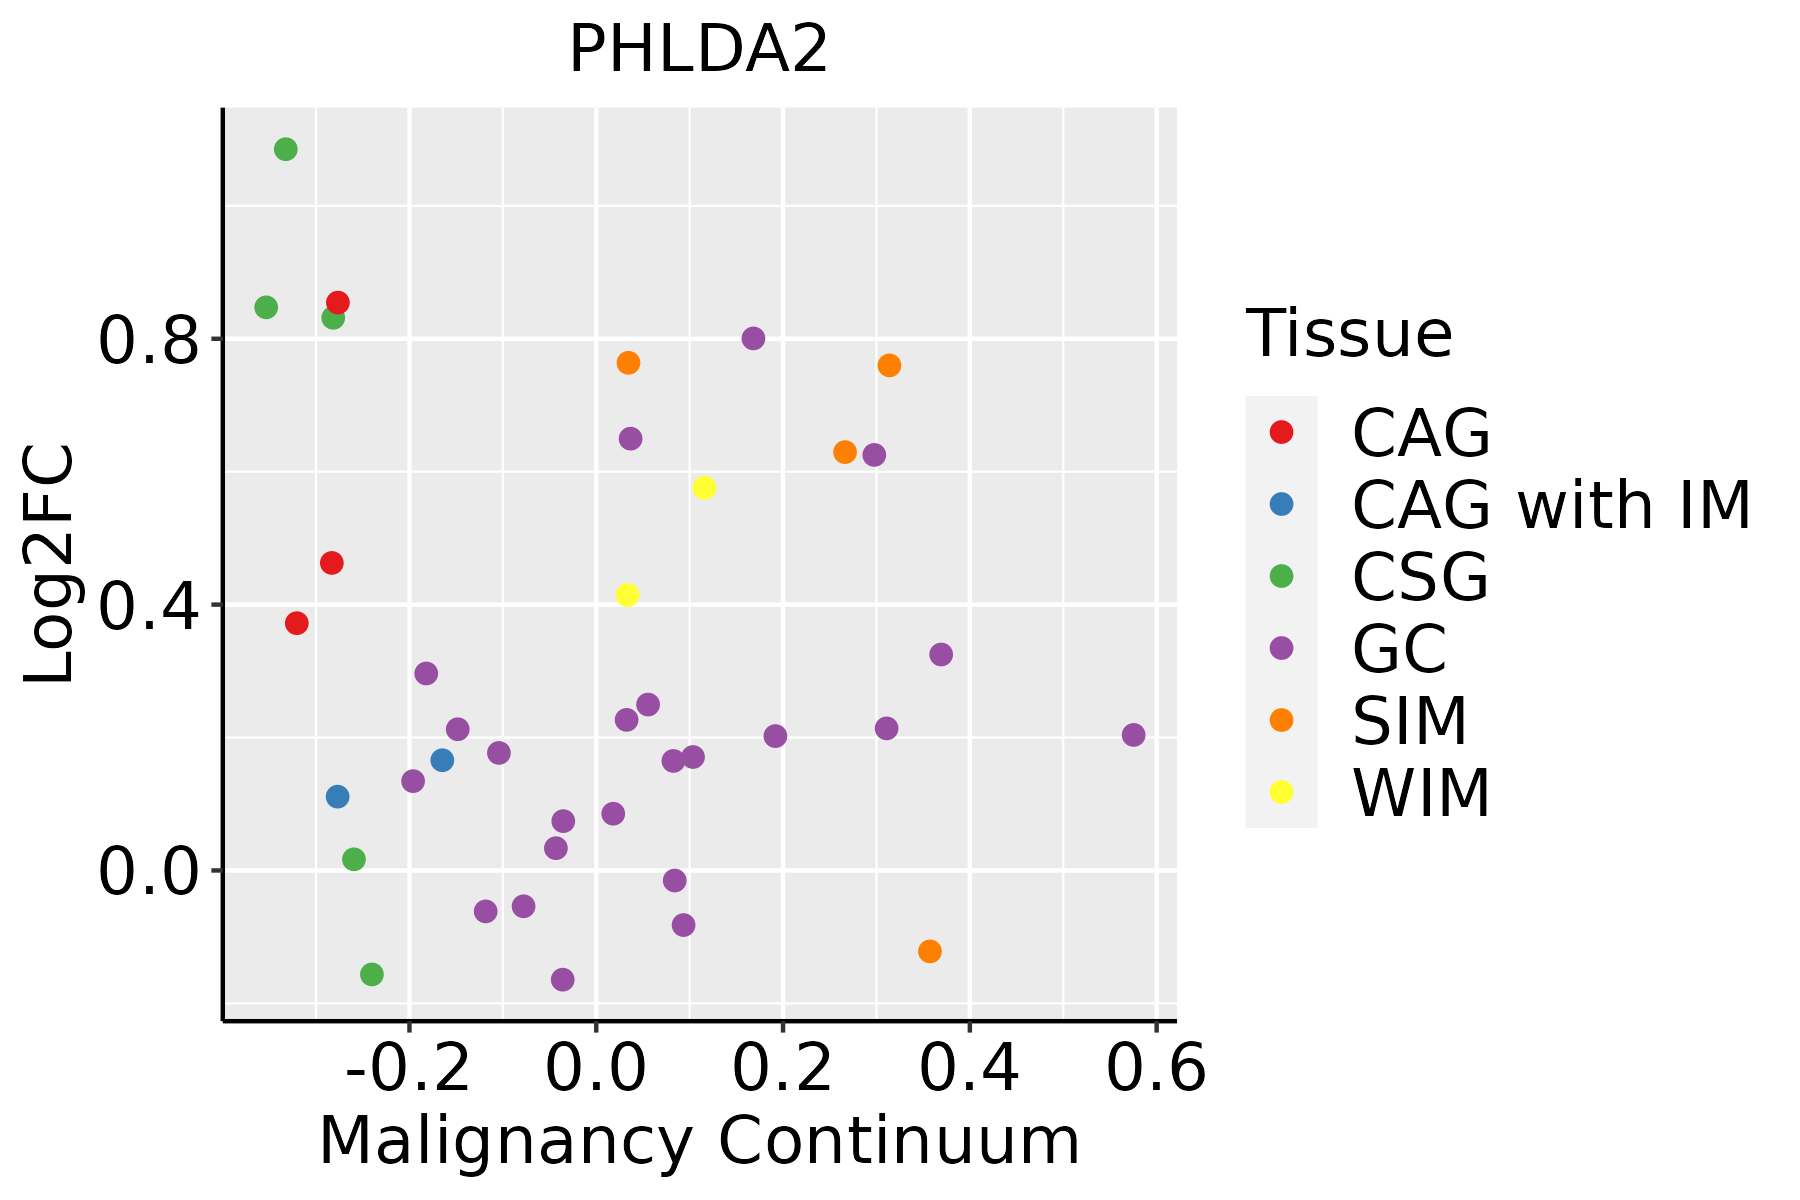 | CAG: Chronic atrophic gastritis |
| CAG with IM: Chronic atrophic gastritis with intestinal metaplasia | ||
| CSG: Chronic superficial gastritis | ||
| GC: Gastric cancer | ||
| SIM: Severe intestinal metaplasia | ||
| WIM: Wild intestinal metaplasia | ||
| Liver | 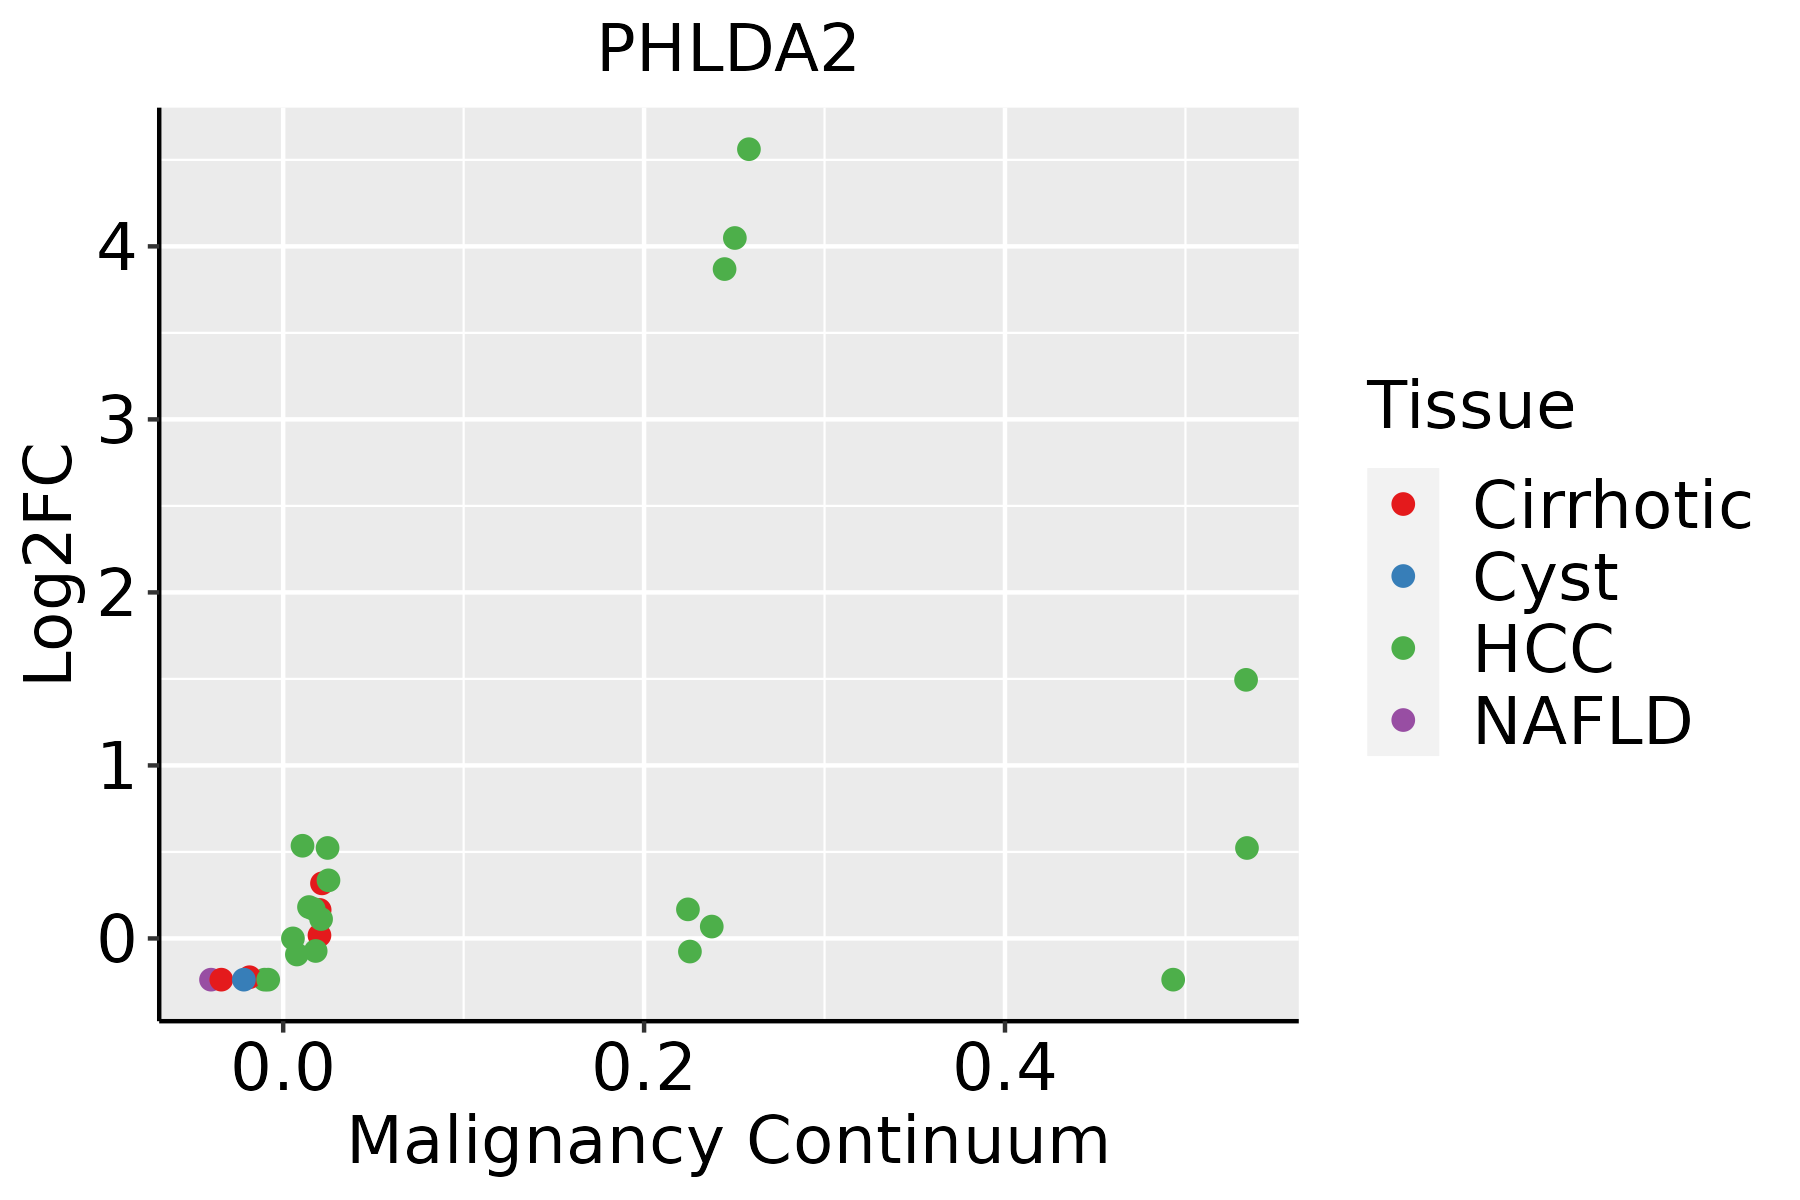 | HCC: Hepatocellular carcinoma |
| NAFLD: Non-alcoholic fatty liver disease | ||
| Lung |  | AAH: Atypical adenomatous hyperplasia |
| AIS: Adenocarcinoma in situ | ||
| IAC: Invasive lung adenocarcinoma | ||
| MIA: Minimally invasive adenocarcinoma | ||
| Oral Cavity | 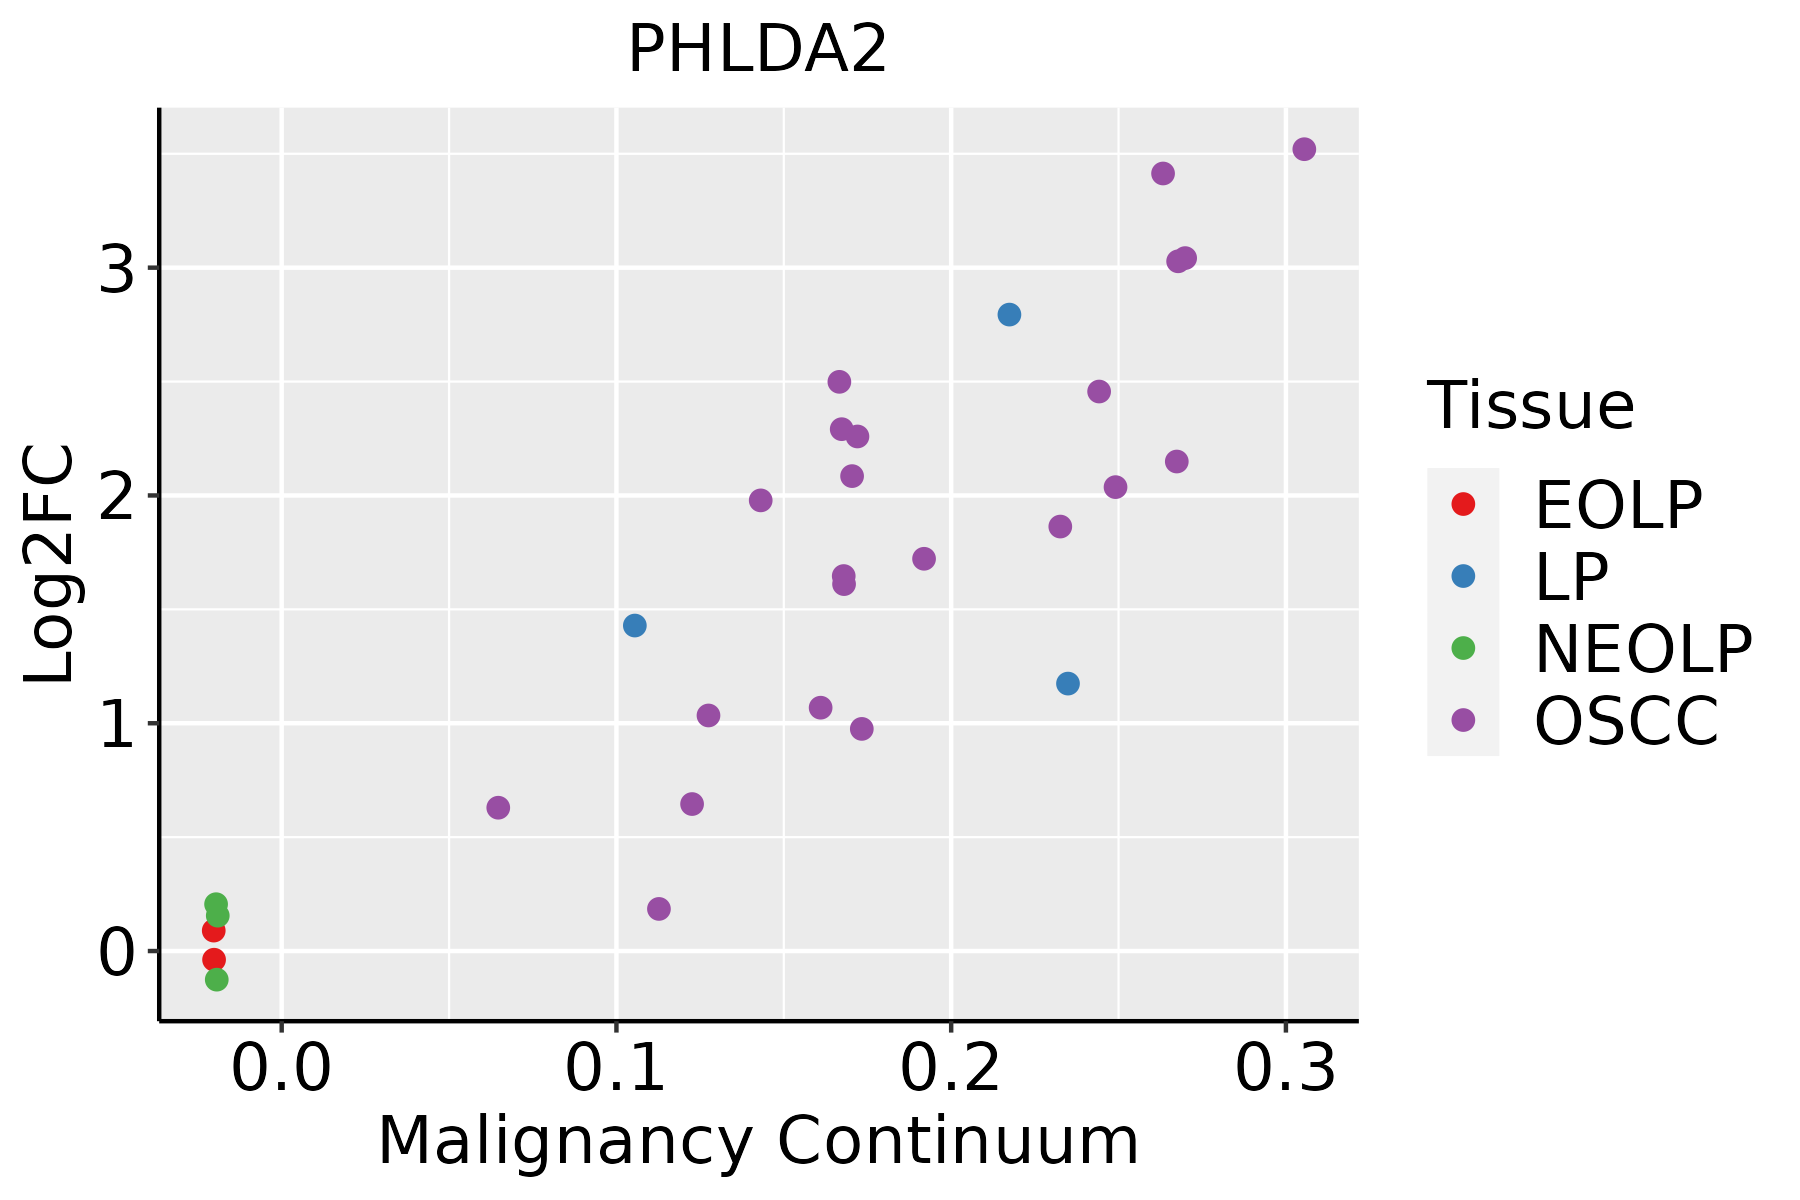 | EOLP: Erosive Oral lichen planus |
| LP: leukoplakia | ||
| NEOLP: Non-erosive oral lichen planus | ||
| OSCC: Oral squamous cell carcinoma | ||
| Prostate | 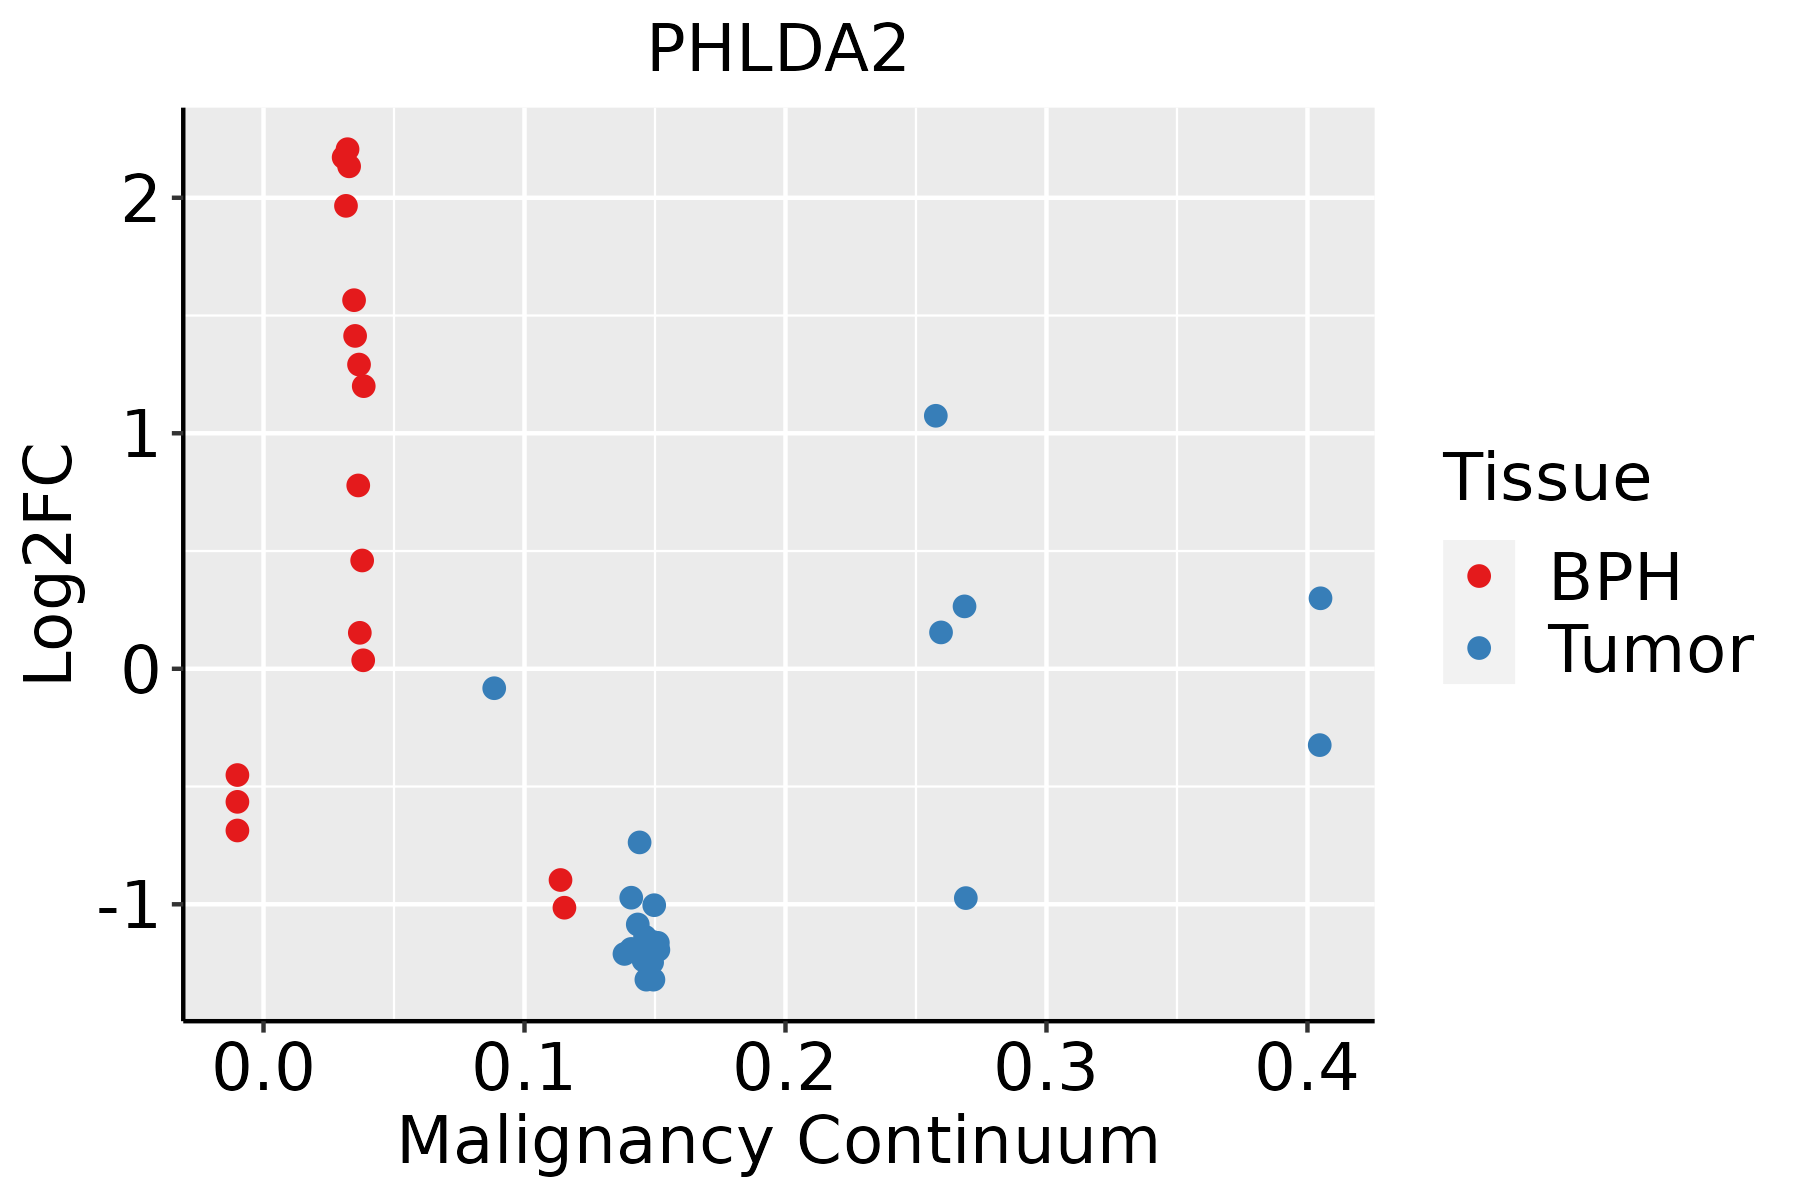 | BPH: Benign Prostatic Hyperplasia |
| Skin |  | AK: Actinic keratosis |
| cSCC: Cutaneous squamous cell carcinoma | ||
| SCCIS:squamous cell carcinoma in situ | ||
| Thyroid |  | ATC: Anaplastic thyroid cancer |
| HT: Hashimoto's thyroiditis | ||
| PTC: Papillary thyroid cancer |
| ∗log2FC in expression of this searched gene in stem-like cells from each diseased tissue sample relative to stem-like cells in normal samples in each tissue plotted against the malignancy continuum. Samples are colored based on if they are from different disease stage. |
Top |
Malignant transformation related pathway analysis |
| Find out the enriched GO biological processes and KEGG pathways involved in transition from healthy to precancer to cancer |
| Tissue | Disease Stage | Enriched GO biological Processes |
| Colorectum | AD |  |
| Colorectum | SER |  |
| Colorectum | MSS |  |
| Colorectum | MSI-H |  |
| Colorectum | FAP |  |
| ∗Top 15 enriched GO BP terms are showed in the bar plot of each disease state in each tissue. Each row represents a significant GO biological process which is colored according to the -log10(p.adjust). |
| Page: 1 2 3 4 5 6 7 8 9 |
| GO ID | Tissue | Disease Stage | Description | Gene Ratio | Bg Ratio | pvalue | p.adjust | Count |
| GO:00193184 | Stomach | GC | hexose metabolic process | 29/1159 | 237/18723 | 3.53e-04 | 5.54e-03 | 29 |
| GO:00433936 | Stomach | GC | regulation of protein binding | 25/1159 | 196/18723 | 4.72e-04 | 6.84e-03 | 25 |
| GO:00060064 | Stomach | GC | glucose metabolic process | 23/1159 | 196/18723 | 2.39e-03 | 2.29e-02 | 23 |
| GO:00459953 | Stomach | GC | regulation of embryonic development | 10/1159 | 64/18723 | 5.67e-03 | 4.36e-02 | 10 |
| GO:0070873 | Stomach | GC | regulation of glycogen metabolic process | 7/1159 | 36/18723 | 5.87e-03 | 4.44e-02 | 7 |
| GO:000609111 | Stomach | CAG with IM | generation of precursor metabolites and energy | 86/1050 | 490/18723 | 1.45e-21 | 1.93e-18 | 86 |
| GO:001598011 | Stomach | CAG with IM | energy derivation by oxidation of organic compounds | 64/1050 | 318/18723 | 1.96e-19 | 1.49e-16 | 64 |
| GO:005109811 | Stomach | CAG with IM | regulation of binding | 45/1050 | 363/18723 | 4.99e-07 | 2.71e-05 | 45 |
| GO:004346711 | Stomach | CAG with IM | regulation of generation of precursor metabolites and energy | 20/1050 | 130/18723 | 3.68e-05 | 1.02e-03 | 20 |
| GO:004339311 | Stomach | CAG with IM | regulation of protein binding | 25/1050 | 196/18723 | 1.05e-04 | 2.29e-03 | 25 |
| GO:006201211 | Stomach | CAG with IM | regulation of small molecule metabolic process | 34/1050 | 334/18723 | 5.85e-04 | 8.52e-03 | 34 |
| GO:000599611 | Stomach | CAG with IM | monosaccharide metabolic process | 26/1050 | 257/18723 | 2.67e-03 | 2.58e-02 | 26 |
| GO:00459951 | Stomach | CAG with IM | regulation of embryonic development | 10/1050 | 64/18723 | 2.82e-03 | 2.69e-02 | 10 |
| GO:00708731 | Stomach | CAG with IM | regulation of glycogen metabolic process | 7/1050 | 36/18723 | 3.41e-03 | 3.08e-02 | 7 |
| GO:001931811 | Stomach | CAG with IM | hexose metabolic process | 24/1050 | 237/18723 | 3.77e-03 | 3.31e-02 | 24 |
| GO:000609121 | Stomach | CSG | generation of precursor metabolites and energy | 83/1034 | 490/18723 | 2.95e-20 | 3.12e-17 | 83 |
| GO:001598021 | Stomach | CSG | energy derivation by oxidation of organic compounds | 63/1034 | 318/18723 | 4.03e-19 | 3.05e-16 | 63 |
| GO:005109821 | Stomach | CSG | regulation of binding | 45/1034 | 363/18723 | 3.26e-07 | 2.02e-05 | 45 |
| GO:004339321 | Stomach | CSG | regulation of protein binding | 25/1034 | 196/18723 | 8.25e-05 | 1.95e-03 | 25 |
| GO:004346721 | Stomach | CSG | regulation of generation of precursor metabolites and energy | 19/1034 | 130/18723 | 9.48e-05 | 2.15e-03 | 19 |
| Page: 1 2 3 4 5 6 7 8 9 10 11 12 13 14 15 16 17 18 19 |
| Pathway ID | Tissue | Disease Stage | Description | Gene Ratio | Bg Ratio | pvalue | p.adjust | qvalue | Count |
| Page: 1 |
Top |
Cell-cell communication analysis |
| Identification of potential cell-cell interactions between two cell types and their ligand-receptor pairs for different disease states |
| Ligand | Receptor | LRpair | Pathway | Tissue | Disease Stage |
| Page: 1 |
Top |
Single-cell gene regulatory network inference analysis |
| Find out the significant the regulons (TFs) and the target genes of each regulon across cell types for different disease states |
| TF | Cell Type | Tissue | Disease Stage | Target Gene | RSS | Regulon Activity |
| PHLDA2 | MYOFIB | Cervix | HSIL_HPV | SERPINI1,NDUFA4L2,CRIP1, etc. | 1.00e-01 |  |
| PHLDA2 | M1MAC | Pancreas | PDAC | UTP6,BCL2L13,CCL20, etc. | 7.45e-02 |  |
| ∗The dot plots of a searched regulon are shown for all cell subpopulations in each disease state of each tissue based on the regulon specific score inferred using pySCENIC and by calculating the average expression. |
| Page: 1 |
Top |
Somatic mutation of malignant transformation related genes |
| Annotation of somatic variants for genes involved in malignant transformation |
| Hugo Symbol | Variant Class | Variant Classification | dbSNP RS | HGVSc | HGVSp | HGVSp Short | SWISSPROT | BIOTYPE | SIFT | PolyPhen | Tumor Sample Barcode | Tissue | Histology | Sex | Age | Stage | Therapy Types | Drugs | Outcome |
| PHLDA2 | SNV | Missense_Mutation | c.28N>C | p.Glu10Gln | p.E10Q | Q53GA4 | protein_coding | deleterious(0) | probably_damaging(0.987) | TCGA-IR-A3LK-01 | Cervix | cervical & endocervical cancer | Female | >=65 | I/II | Chemotherapy | cisplatin | PD | |
| PHLDA2 | SNV | Missense_Mutation | c.137N>C | p.Arg46Pro | p.R46P | Q53GA4 | protein_coding | deleterious(0) | benign(0.013) | TCGA-AU-6004-01 | Colorectum | colon adenocarcinoma | Female | >=65 | I/II | Unknown | Unknown | SD | |
| PHLDA2 | SNV | Missense_Mutation | novel | c.80A>T | p.Lys27Met | p.K27M | Q53GA4 | protein_coding | deleterious(0) | probably_damaging(0.991) | TCGA-A5-A0G1-01 | Endometrium | uterine corpus endometrioid carcinoma | Female | >=65 | I/II | Unknown | Unknown | SD |
| PHLDA2 | SNV | Missense_Mutation | novel | c.278N>T | p.Ala93Val | p.A93V | Q53GA4 | protein_coding | tolerated(0.11) | benign(0.019) | TCGA-AX-A1CE-01 | Endometrium | uterine corpus endometrioid carcinoma | Female | <65 | I/II | Unspecific | Paclitaxel | SD |
| PHLDA2 | SNV | Missense_Mutation | novel | c.250N>G | p.Cys84Gly | p.C84G | Q53GA4 | protein_coding | deleterious(0.02) | probably_damaging(0.961) | TCGA-D1-A167-01 | Endometrium | uterine corpus endometrioid carcinoma | Female | >=65 | I/II | Unknown | Unknown | SD |
| PHLDA2 | SNV | Missense_Mutation | c.259N>A | p.Glu87Lys | p.E87K | Q53GA4 | protein_coding | deleterious(0.02) | benign(0.204) | TCGA-95-7948-01 | Lung | lung adenocarcinoma | Female | <65 | I/II | Unknown | Unknown | SD | |
| PHLDA2 | SNV | Missense_Mutation | novel | c.161N>G | p.Ser54Cys | p.S54C | Q53GA4 | protein_coding | tolerated(0.05) | probably_damaging(0.971) | TCGA-BA-5152-01 | Oral cavity | head & neck squamous cell carcinoma | Male | <65 | I/II | Unknown | Unknown | SD |
| PHLDA2 | SNV | Missense_Mutation | rs755568865 | c.16N>A | p.Glu6Lys | p.E6K | Q53GA4 | protein_coding | tolerated(1) | benign(0.148) | TCGA-CV-7423-01 | Oral cavity | head & neck squamous cell carcinoma | Male | >=65 | I/II | Unknown | Unknown | SD |
| PHLDA2 | SNV | Missense_Mutation | rs878960560 | c.98C>T | p.Ser33Phe | p.S33F | Q53GA4 | protein_coding | deleterious(0) | benign(0.321) | TCGA-P3-A6T5-01 | Oral cavity | head & neck squamous cell carcinoma | Female | >=65 | I/II | Unknown | Unknown | PD |
| PHLDA2 | SNV | Missense_Mutation | c.228N>A | p.Asp76Glu | p.D76E | Q53GA4 | protein_coding | tolerated(0.5) | possibly_damaging(0.754) | TCGA-BR-4294-01 | Stomach | stomach adenocarcinoma | Male | >=65 | I/II | Unknown | Unknown | SD |
| Page: 1 2 |
Top |
Related drugs of malignant transformation related genes |
| Identification of chemicals and drugs interact with genes involved in malignant transfromation |
| (DGIdb 4.0) |
| Entrez ID | Symbol | Category | Interaction Types | Drug Claim Name | Drug Name | PMIDs |
| Page: 1 |

Copyright 2023-Present -The University of Texas Health Science Center at Houston |