
|
|||||
|
 | |
| |
| |
| |
| |
| |
|
Gene: PDCD5 |
Gene summary for PDCD5 |
| Gene information | Species | Human | Gene symbol | PDCD5 | Gene ID | 9141 |
| Gene name | programmed cell death 5 | |
| Gene Alias | TFAR19 | |
| Cytomap | 19q13.11 | |
| Gene Type | protein-coding | GO ID | GO:0001836 | UniProtAcc | O14737 |
Top |
Malignant transformation analysis |
| Identification of the aberrant gene expression in precancerous and cancerous lesions by comparing the gene expression of stem-like cells in diseased tissues with normal stem cells |
| Entrez ID | Symbol | Replicates | Species | Organ | Tissue | Adj P-value | Log2FC | Malignancy |
| 9141 | PDCD5 | CA_HPV_1 | Human | Cervix | CC | 1.89e-03 | -2.03e-01 | 0.0264 |
| 9141 | PDCD5 | CA_HPV_3 | Human | Cervix | CC | 1.95e-03 | 2.28e-01 | 0.0414 |
| 9141 | PDCD5 | CCI_1 | Human | Cervix | CC | 4.63e-04 | -4.84e-01 | 0.528 |
| 9141 | PDCD5 | CCI_2 | Human | Cervix | CC | 1.24e-02 | -4.58e-01 | 0.5249 |
| 9141 | PDCD5 | CCI_3 | Human | Cervix | CC | 2.78e-10 | -5.49e-01 | 0.516 |
| 9141 | PDCD5 | CCII_1 | Human | Cervix | CC | 3.28e-15 | -5.53e-01 | 0.3249 |
| 9141 | PDCD5 | sample3 | Human | Cervix | CC | 6.65e-03 | -6.67e-02 | 0.1387 |
| 9141 | PDCD5 | L1 | Human | Cervix | CC | 4.89e-07 | -1.37e-02 | 0.0802 |
| 9141 | PDCD5 | T3 | Human | Cervix | CC | 4.27e-03 | -9.57e-02 | 0.1389 |
| 9141 | PDCD5 | HTA11_1391_2000001011 | Human | Colorectum | AD | 5.65e-03 | 1.95e-01 | -0.059 |
| 9141 | PDCD5 | HTA11_866_3004761011 | Human | Colorectum | AD | 1.50e-02 | 1.78e-01 | 0.096 |
| 9141 | PDCD5 | HTA11_6818_2000001021 | Human | Colorectum | AD | 1.02e-02 | 2.33e-01 | 0.0588 |
| 9141 | PDCD5 | HTA11_99999971662_82457 | Human | Colorectum | MSS | 7.23e-07 | 3.24e-01 | 0.3859 |
| 9141 | PDCD5 | HTA11_99999974143_84620 | Human | Colorectum | MSS | 4.87e-04 | 1.89e-01 | 0.3005 |
| 9141 | PDCD5 | AEH-subject1 | Human | Endometrium | AEH | 3.29e-09 | -3.15e-01 | -0.3059 |
| 9141 | PDCD5 | AEH-subject2 | Human | Endometrium | AEH | 8.86e-16 | -4.13e-01 | -0.2525 |
| 9141 | PDCD5 | AEH-subject3 | Human | Endometrium | AEH | 3.14e-10 | -2.84e-01 | -0.2576 |
| 9141 | PDCD5 | AEH-subject4 | Human | Endometrium | AEH | 1.91e-08 | -3.62e-01 | -0.2657 |
| 9141 | PDCD5 | AEH-subject5 | Human | Endometrium | AEH | 2.49e-03 | -2.69e-01 | -0.2953 |
| 9141 | PDCD5 | EEC-subject1 | Human | Endometrium | EEC | 2.64e-17 | -4.04e-01 | -0.2682 |
| Page: 1 2 3 4 5 6 7 8 9 10 |
| Tissue | Expression Dynamics | Abbreviation |
| Cervix | 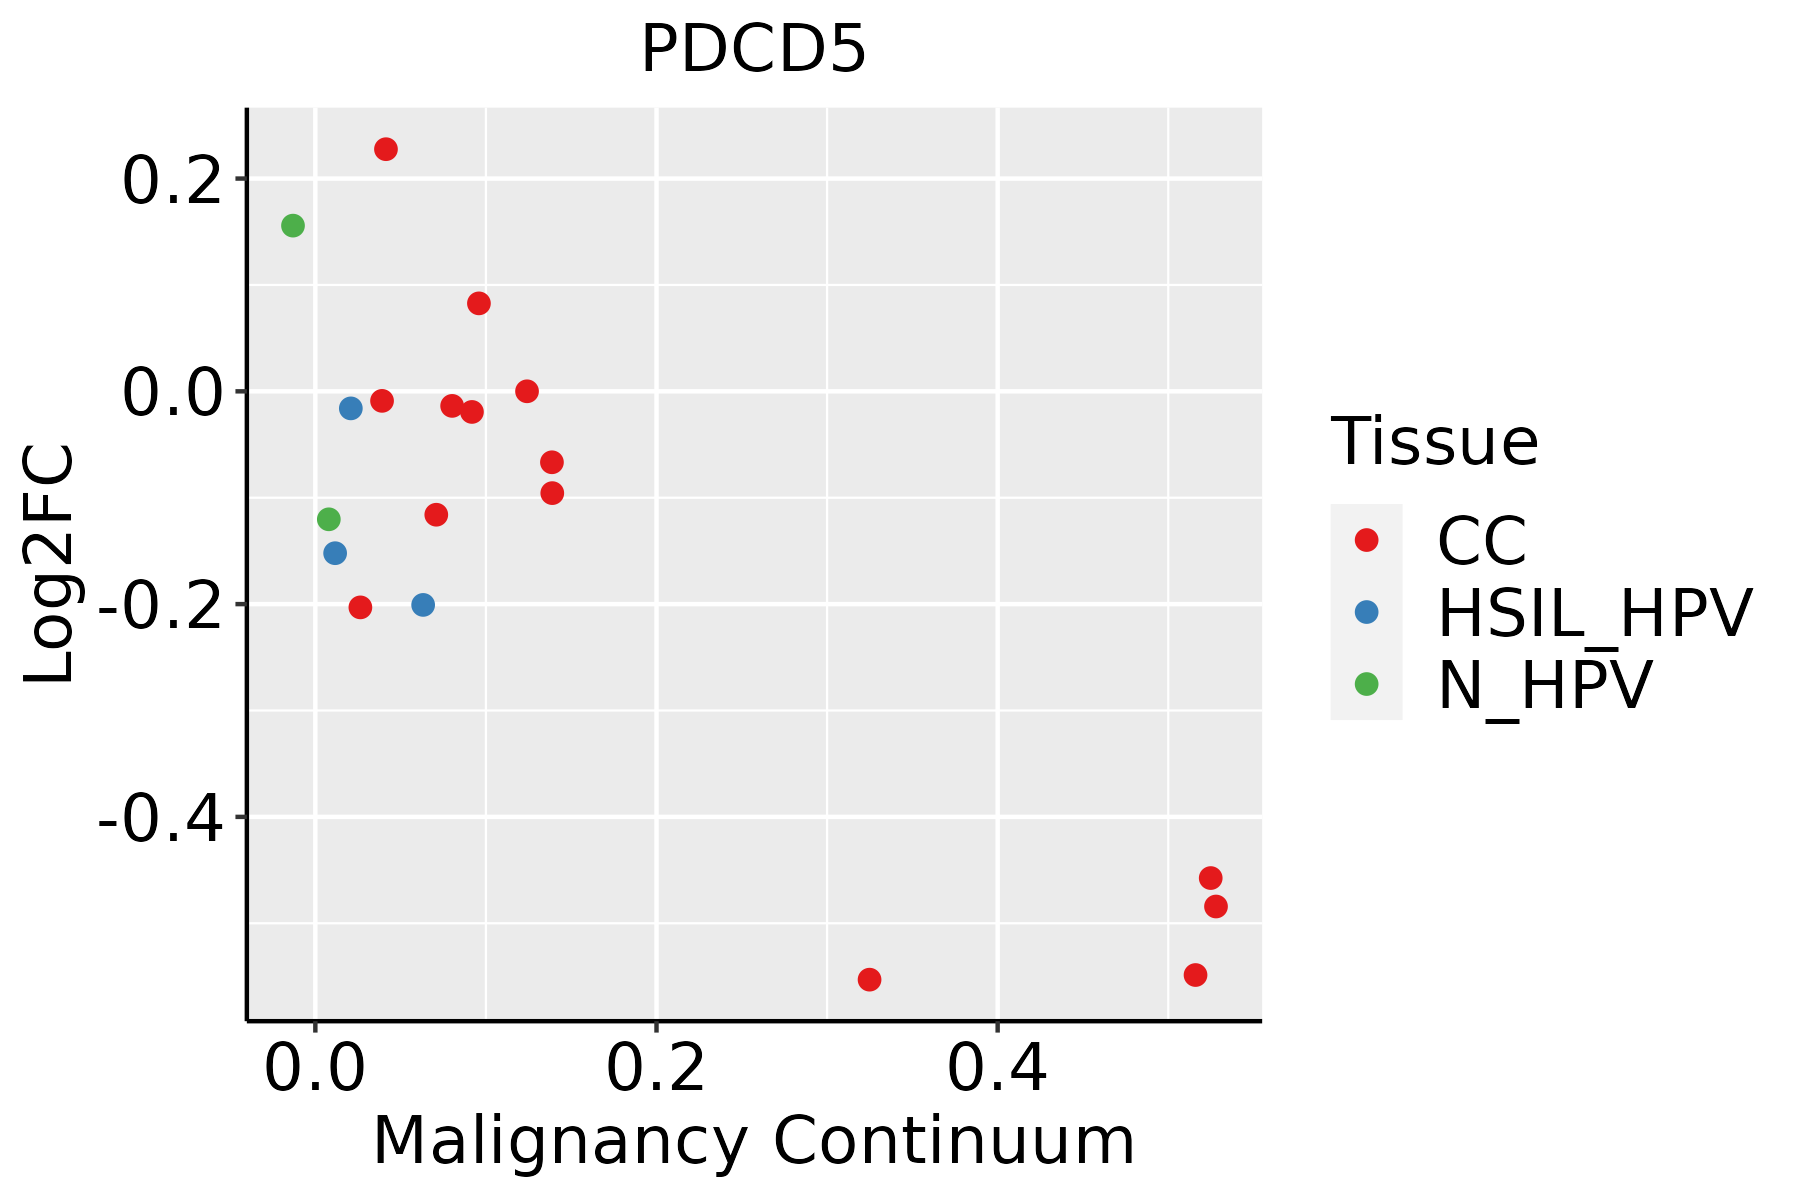 | CC: Cervix cancer |
| HSIL_HPV: HPV-infected high-grade squamous intraepithelial lesions | ||
| N_HPV: HPV-infected normal cervix | ||
| Colorectum (GSE201348) |  | FAP: Familial adenomatous polyposis |
| CRC: Colorectal cancer | ||
| Colorectum (HTA11) |  | AD: Adenomas |
| SER: Sessile serrated lesions | ||
| MSI-H: Microsatellite-high colorectal cancer | ||
| MSS: Microsatellite stable colorectal cancer | ||
| Endometrium | 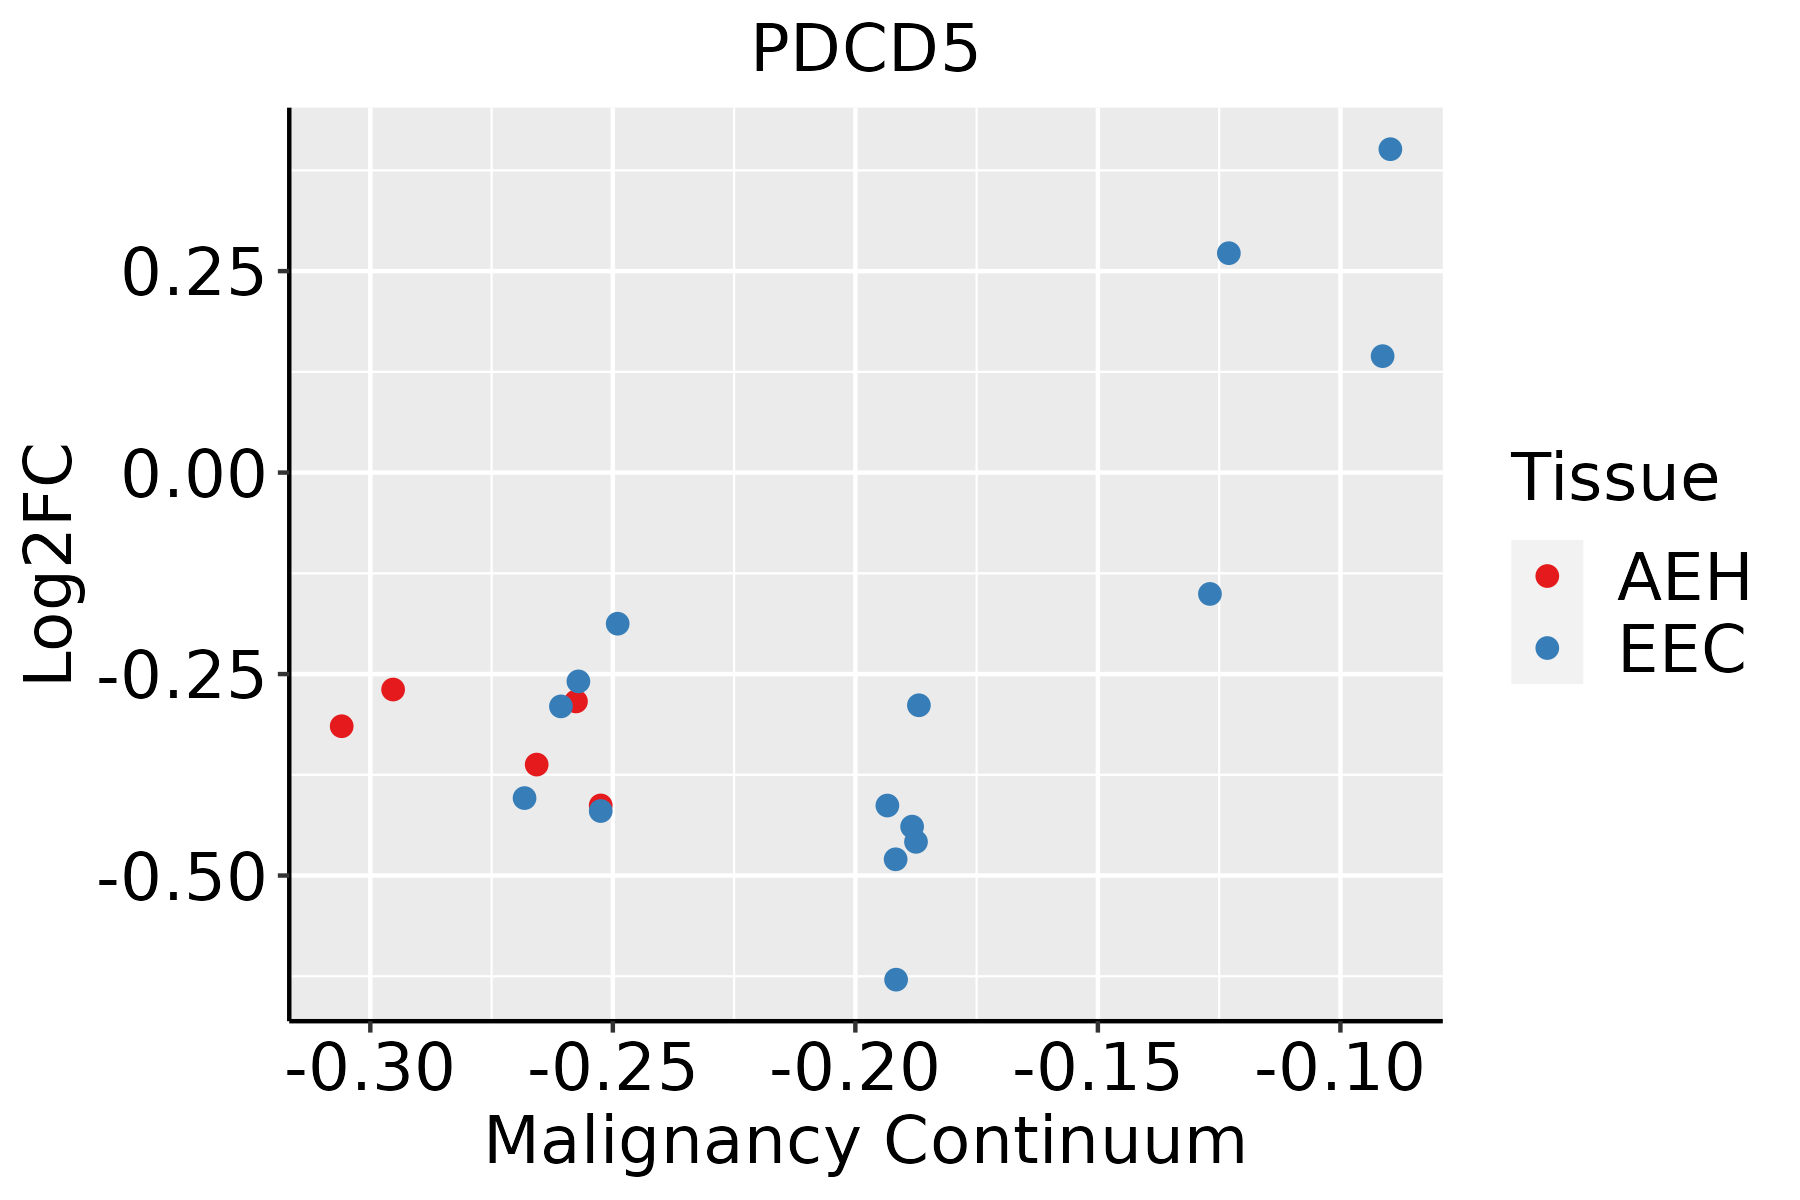 | AEH: Atypical endometrial hyperplasia |
| EEC: Endometrioid Cancer | ||
| Esophagus |  | ESCC: Esophageal squamous cell carcinoma |
| HGIN: High-grade intraepithelial neoplasias | ||
| LGIN: Low-grade intraepithelial neoplasias | ||
| Liver | 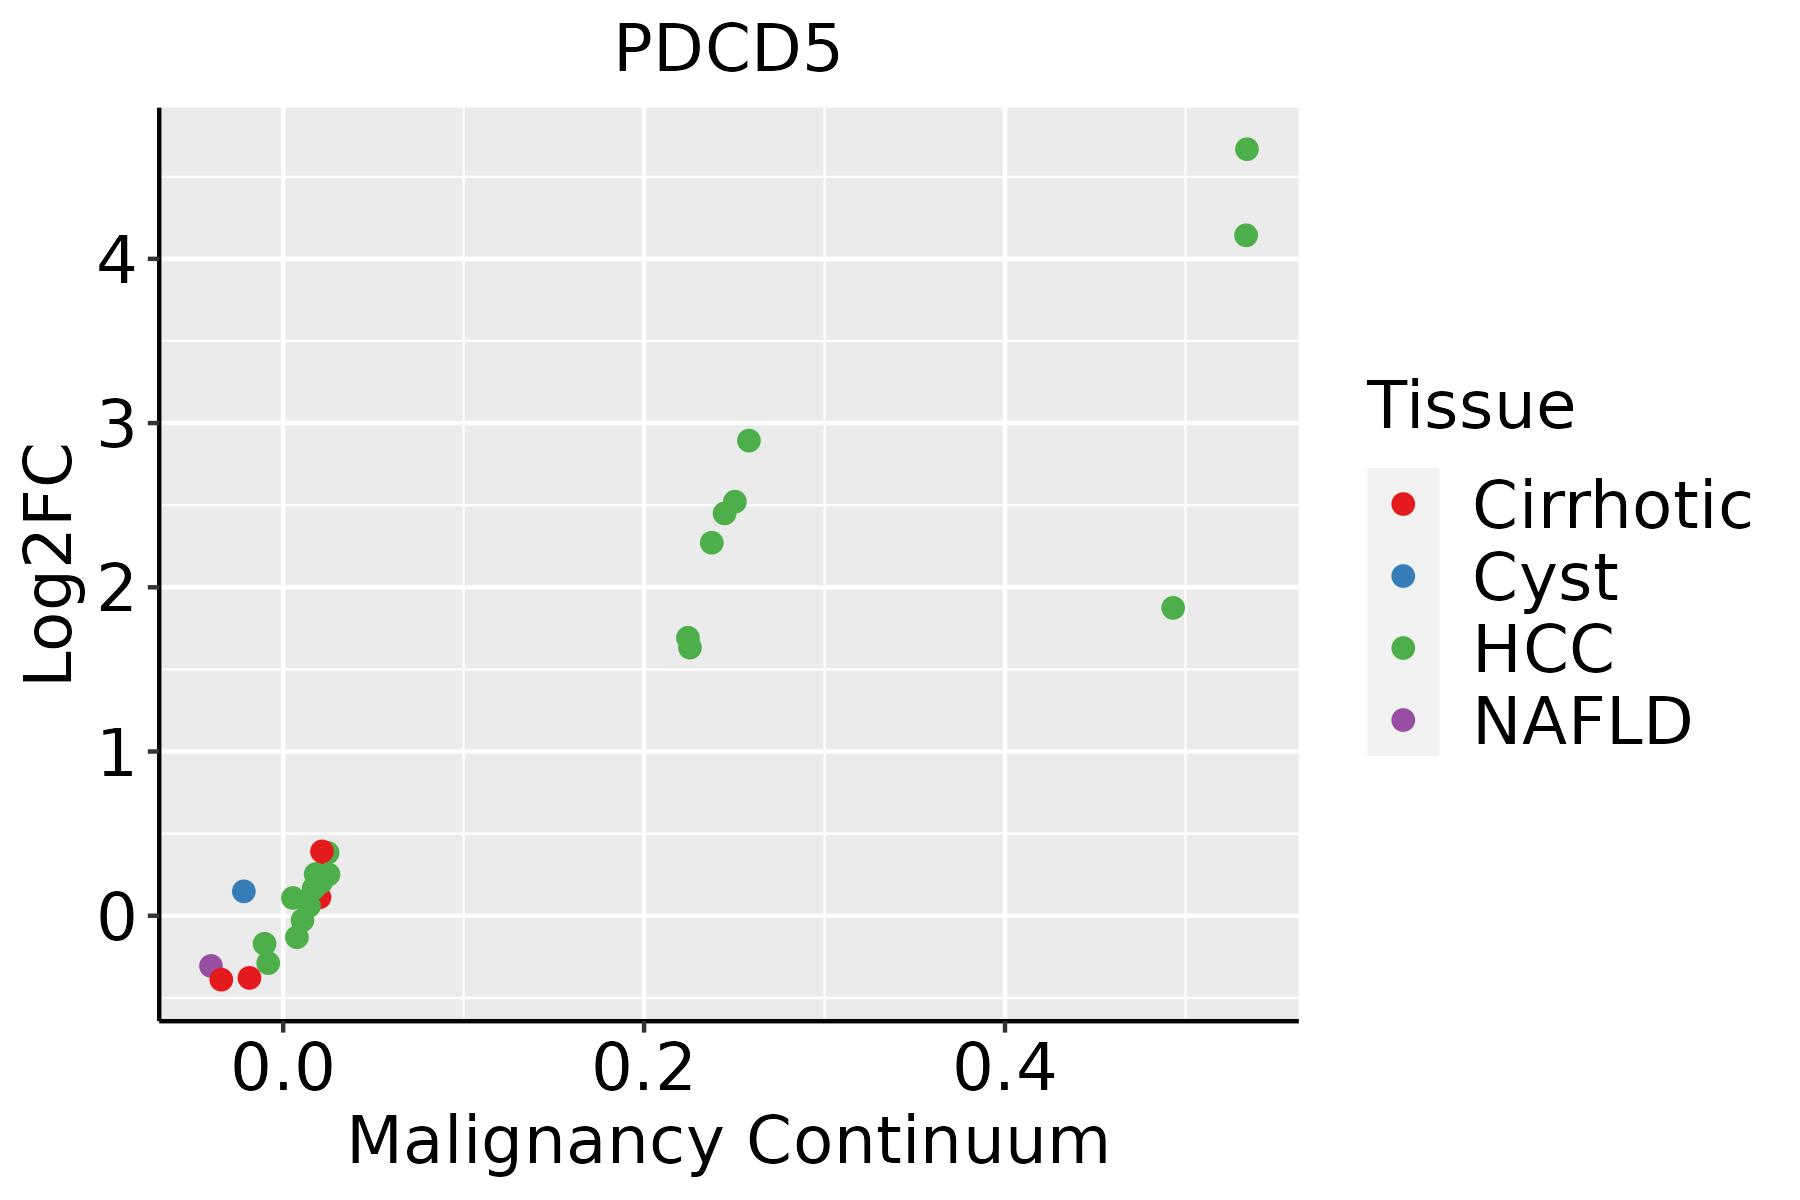 | HCC: Hepatocellular carcinoma |
| NAFLD: Non-alcoholic fatty liver disease | ||
| Oral Cavity |  | EOLP: Erosive Oral lichen planus |
| LP: leukoplakia | ||
| NEOLP: Non-erosive oral lichen planus | ||
| OSCC: Oral squamous cell carcinoma | ||
| Prostate |  | BPH: Benign Prostatic Hyperplasia |
| Skin | 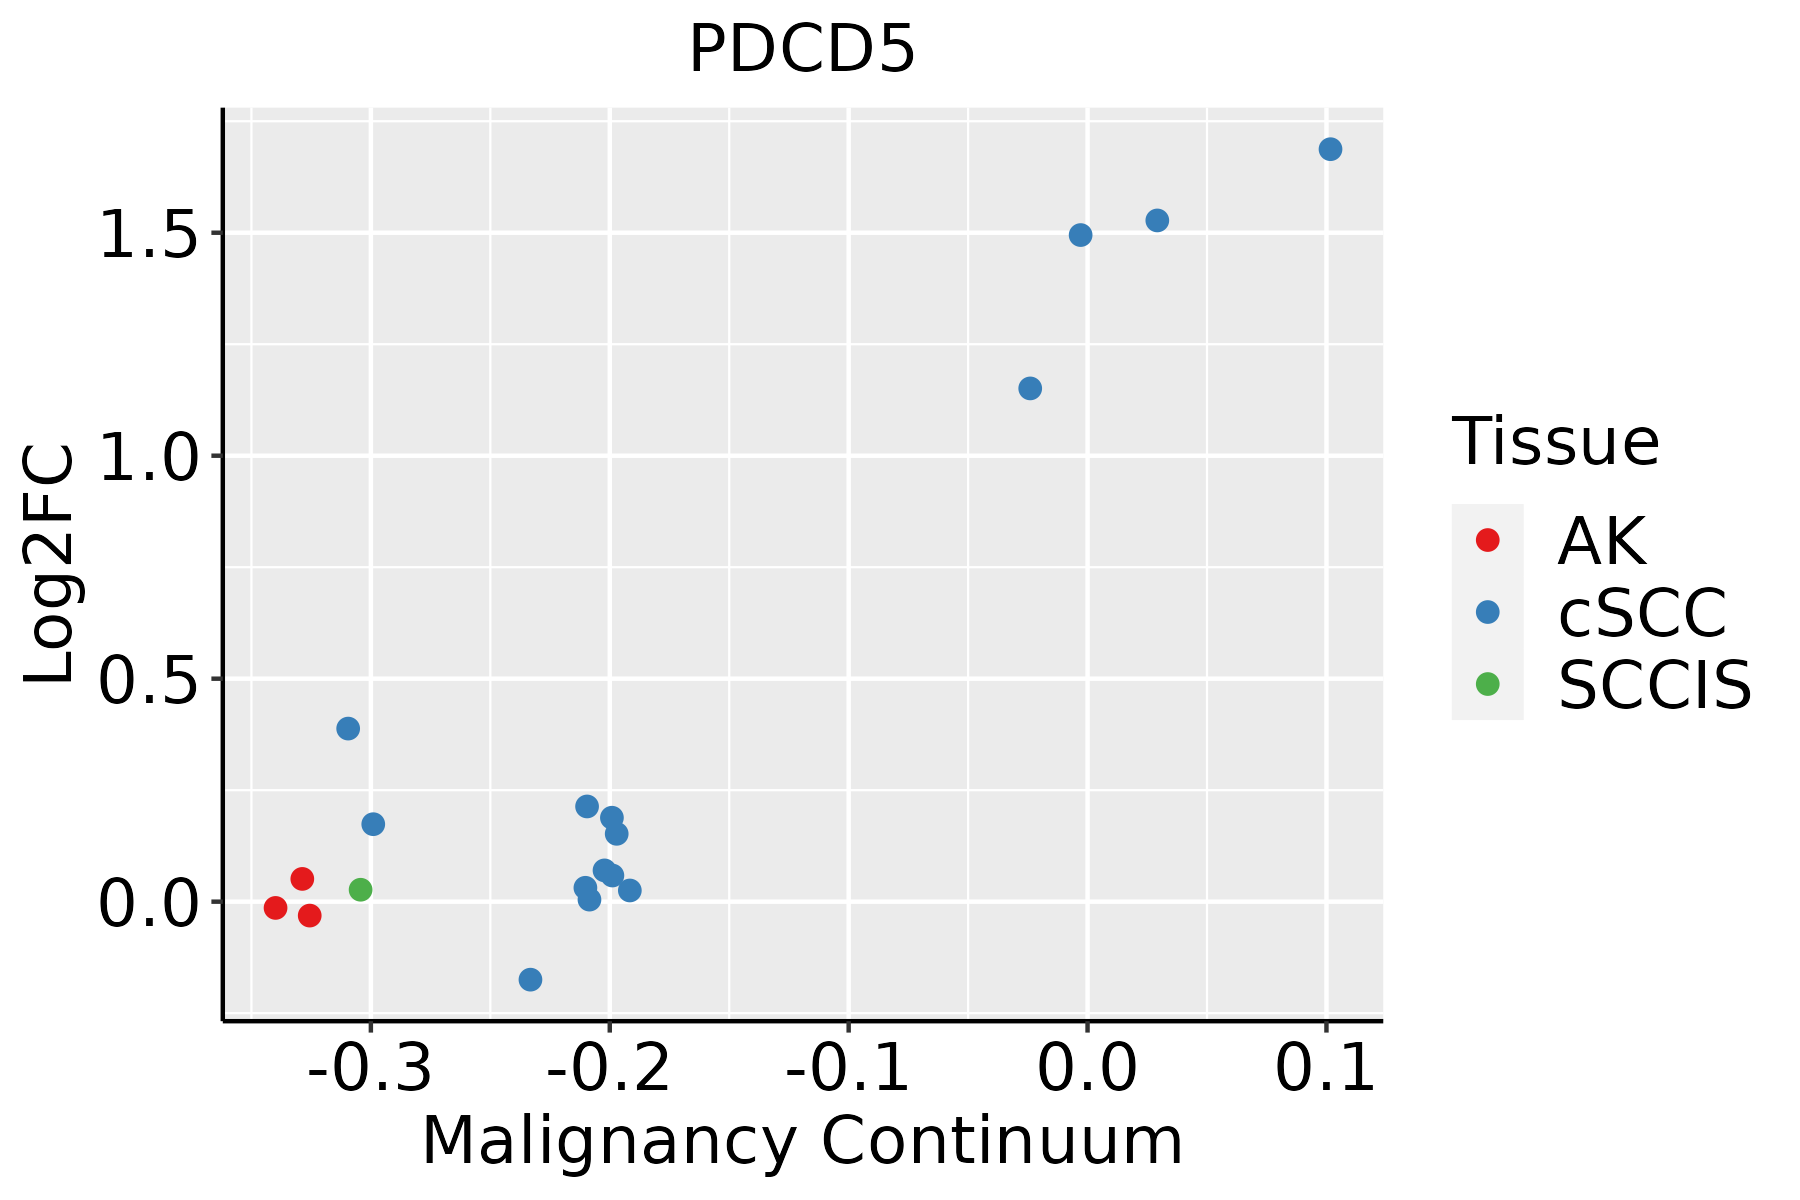 | AK: Actinic keratosis |
| cSCC: Cutaneous squamous cell carcinoma | ||
| SCCIS:squamous cell carcinoma in situ | ||
| Thyroid | 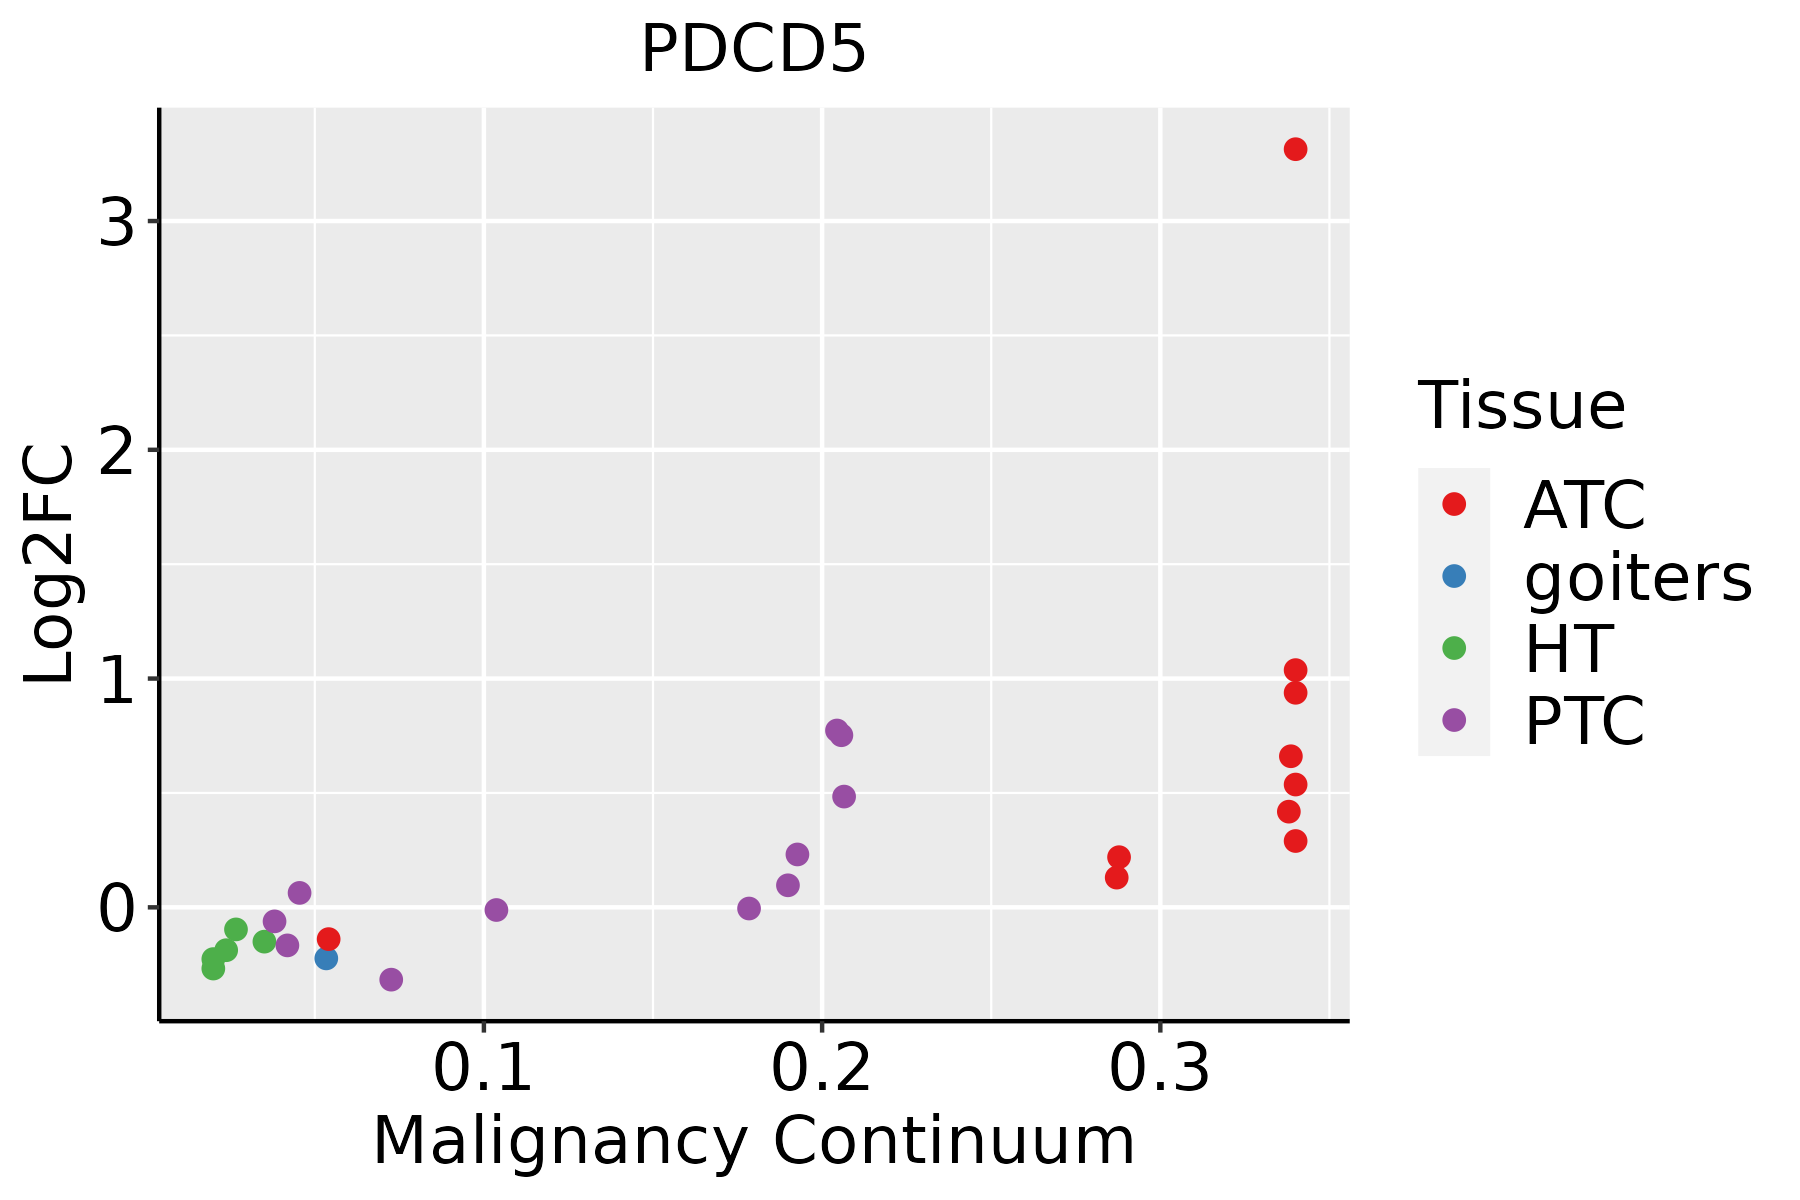 | ATC: Anaplastic thyroid cancer |
| HT: Hashimoto's thyroiditis | ||
| PTC: Papillary thyroid cancer |
| ∗log2FC in expression of this searched gene in stem-like cells from each diseased tissue sample relative to stem-like cells in normal samples in each tissue plotted against the malignancy continuum. Samples are colored based on if they are from different disease stage. |
Top |
Malignant transformation related pathway analysis |
| Find out the enriched GO biological processes and KEGG pathways involved in transition from healthy to precancer to cancer |
| Tissue | Disease Stage | Enriched GO biological Processes |
| Colorectum | AD |  |
| Colorectum | SER |  |
| Colorectum | MSS |  |
| Colorectum | MSI-H |  |
| Colorectum | FAP |  |
| ∗Top 15 enriched GO BP terms are showed in the bar plot of each disease state in each tissue. Each row represents a significant GO biological process which is colored according to the -log10(p.adjust). |
| Page: 1 2 3 4 5 6 7 8 9 |
| GO ID | Tissue | Disease Stage | Description | Gene Ratio | Bg Ratio | pvalue | p.adjust | Count |
| GO:009015118 | Esophagus | ESCC | establishment of protein localization to mitochondrial membrane | 26/8552 | 30/18723 | 3.79e-06 | 4.12e-05 | 26 |
| GO:190353315 | Esophagus | ESCC | regulation of protein targeting | 57/8552 | 81/18723 | 5.83e-06 | 6.03e-05 | 57 |
| GO:0043280110 | Esophagus | ESCC | positive regulation of cysteine-type endopeptidase activity involved in apoptotic process | 84/8552 | 129/18723 | 6.38e-06 | 6.55e-05 | 84 |
| GO:2001056110 | Esophagus | ESCC | positive regulation of cysteine-type endopeptidase activity | 94/8552 | 148/18723 | 8.87e-06 | 8.59e-05 | 94 |
| GO:190374715 | Esophagus | ESCC | regulation of establishment of protein localization to mitochondrion | 37/8552 | 50/18723 | 4.42e-05 | 3.51e-04 | 37 |
| GO:19033324 | Esophagus | ESCC | regulation of protein folding | 12/8552 | 12/18723 | 8.21e-05 | 6.01e-04 | 12 |
| GO:19037498 | Esophagus | ESCC | positive regulation of establishment of protein localization to mitochondrion | 28/8552 | 36/18723 | 8.62e-05 | 6.22e-04 | 28 |
| GO:005120416 | Esophagus | ESCC | protein insertion into mitochondrial membrane | 21/8552 | 25/18723 | 9.12e-05 | 6.54e-04 | 21 |
| GO:190321415 | Esophagus | ESCC | regulation of protein targeting to mitochondrion | 32/8552 | 44/18723 | 2.50e-04 | 1.54e-03 | 32 |
| GO:00902004 | Esophagus | ESCC | positive regulation of release of cytochrome c from mitochondria | 22/8552 | 28/18723 | 3.95e-04 | 2.26e-03 | 22 |
| GO:19039556 | Esophagus | ESCC | positive regulation of protein targeting to mitochondrion | 24/8552 | 32/18723 | 7.22e-04 | 3.77e-03 | 24 |
| GO:00064577 | Liver | Cirrhotic | protein folding | 114/4634 | 212/18723 | 9.23e-20 | 2.31e-17 | 114 |
| GO:007259412 | Liver | Cirrhotic | establishment of protein localization to organelle | 189/4634 | 422/18723 | 1.01e-19 | 2.45e-17 | 189 |
| GO:00066057 | Liver | Cirrhotic | protein targeting | 148/4634 | 314/18723 | 3.86e-18 | 6.20e-16 | 148 |
| GO:004586212 | Liver | Cirrhotic | positive regulation of proteolysis | 163/4634 | 372/18723 | 4.18e-16 | 5.14e-14 | 163 |
| GO:00901507 | Liver | Cirrhotic | establishment of protein localization to membrane | 123/4634 | 260/18723 | 1.85e-15 | 2.15e-13 | 123 |
| GO:003238611 | Liver | Cirrhotic | regulation of intracellular transport | 147/4634 | 337/18723 | 1.84e-14 | 1.72e-12 | 147 |
| GO:003315711 | Liver | Cirrhotic | regulation of intracellular protein transport | 108/4634 | 229/18723 | 1.23e-13 | 1.04e-11 | 108 |
| GO:005254712 | Liver | Cirrhotic | regulation of peptidase activity | 185/4634 | 461/18723 | 1.32e-13 | 1.09e-11 | 185 |
| GO:190382912 | Liver | Cirrhotic | positive regulation of cellular protein localization | 123/4634 | 276/18723 | 4.06e-13 | 3.22e-11 | 123 |
| Page: 1 2 3 4 5 6 7 8 9 10 11 12 13 14 15 16 17 18 19 20 21 22 23 24 25 26 27 28 29 30 31 32 33 34 35 36 37 38 39 40 41 |
| Pathway ID | Tissue | Disease Stage | Description | Gene Ratio | Bg Ratio | pvalue | p.adjust | qvalue | Count |
| Page: 1 |
Top |
Cell-cell communication analysis |
| Identification of potential cell-cell interactions between two cell types and their ligand-receptor pairs for different disease states |
| Ligand | Receptor | LRpair | Pathway | Tissue | Disease Stage |
| Page: 1 |
Top |
Single-cell gene regulatory network inference analysis |
| Find out the significant the regulons (TFs) and the target genes of each regulon across cell types for different disease states |
| TF | Cell Type | Tissue | Disease Stage | Target Gene | RSS | Regulon Activity |
| ∗The dot plots of a searched regulon are shown for all cell subpopulations in each disease state of each tissue based on the regulon specific score inferred using pySCENIC and by calculating the average expression. |
| Page: 1 |
Top |
Somatic mutation of malignant transformation related genes |
| Annotation of somatic variants for genes involved in malignant transformation |
| Hugo Symbol | Variant Class | Variant Classification | dbSNP RS | HGVSc | HGVSp | HGVSp Short | SWISSPROT | BIOTYPE | SIFT | PolyPhen | Tumor Sample Barcode | Tissue | Histology | Sex | Age | Stage | Therapy Types | Drugs | Outcome |
| PDCD5 | SNV | Missense_Mutation | c.122A>G | p.Asn41Ser | p.N41S | O14737 | protein_coding | deleterious(0.02) | benign(0.174) | TCGA-AA-3672-01 | Colorectum | colon adenocarcinoma | Female | >=65 | III/IV | Unknown | Unknown | SD | |
| PDCD5 | SNV | Missense_Mutation | c.169A>G | p.Ser57Gly | p.S57G | O14737 | protein_coding | tolerated(0.07) | benign(0.134) | TCGA-AD-6895-01 | Colorectum | colon adenocarcinoma | Male | >=65 | III/IV | Unknown | Unknown | SD | |
| PDCD5 | SNV | Missense_Mutation | c.213N>T | p.Glu71Asp | p.E71D | O14737 | protein_coding | deleterious(0) | probably_damaging(0.985) | TCGA-AG-A002-01 | Colorectum | rectum adenocarcinoma | Male | <65 | I/II | Unknown | Unknown | SD | |
| PDCD5 | SNV | Missense_Mutation | rs376281754 | c.70N>T | p.Pro24Ser | p.P24S | O14737 | protein_coding | tolerated(0.31) | benign(0.003) | TCGA-AP-A1DV-01 | Endometrium | uterine corpus endometrioid carcinoma | Female | <65 | I/II | Unknown | Unknown | SD |
| PDCD5 | SNV | Missense_Mutation | c.247C>A | p.Leu83Ile | p.L83I | O14737 | protein_coding | tolerated(0.93) | benign(0.009) | TCGA-BS-A0UF-01 | Endometrium | uterine corpus endometrioid carcinoma | Female | >=65 | I/II | Unknown | Unknown | SD | |
| PDCD5 | SNV | Missense_Mutation | rs201933073 | c.158N>A | p.Arg53Gln | p.R53Q | O14737 | protein_coding | deleterious(0.02) | possibly_damaging(0.761) | TCGA-55-A4DF-01 | Lung | lung adenocarcinoma | Male | >=65 | I/II | Unknown | Unknown | PD |
| PDCD5 | SNV | Missense_Mutation | c.253N>A | p.Glu85Lys | p.E85K | O14737 | protein_coding | deleterious(0.02) | benign(0.124) | TCGA-78-7150-01 | Lung | lung adenocarcinoma | Male | <65 | I/II | Chemotherapy | carboplatin | PD | |
| PDCD5 | SNV | Missense_Mutation | novel | c.331N>C | p.Phe111Leu | p.F111L | O14737 | protein_coding | deleterious(0.03) | probably_damaging(0.981) | TCGA-MP-A4T4-01 | Lung | lung adenocarcinoma | Female | >=65 | I/II | Unknown | Unknown | SD |
| PDCD5 | SNV | Missense_Mutation | c.265G>C | p.Glu89Gln | p.E89Q | O14737 | protein_coding | deleterious(0) | possibly_damaging(0.862) | TCGA-EJ-8470-01 | Prostate | prostate adenocarcinoma | Male | <65 | 7 | Unknown | Unknown | SD | |
| PDCD5 | SNV | Missense_Mutation | c.258N>T | p.Lys86Asn | p.K86N | O14737 | protein_coding | deleterious(0) | benign(0.015) | TCGA-HU-A4H3-01 | Stomach | stomach adenocarcinoma | Female | <65 | III/IV | Chemotherapy | ts-1 | PD |
| Page: 1 |
Top |
Related drugs of malignant transformation related genes |
| Identification of chemicals and drugs interact with genes involved in malignant transfromation |
| (DGIdb 4.0) |
| Entrez ID | Symbol | Category | Interaction Types | Drug Claim Name | Drug Name | PMIDs |
| Page: 1 |

Copyright 2023-Present -The University of Texas Health Science Center at Houston |