| Tissue | Expression Dynamics | Abbreviation |
| Cervix | 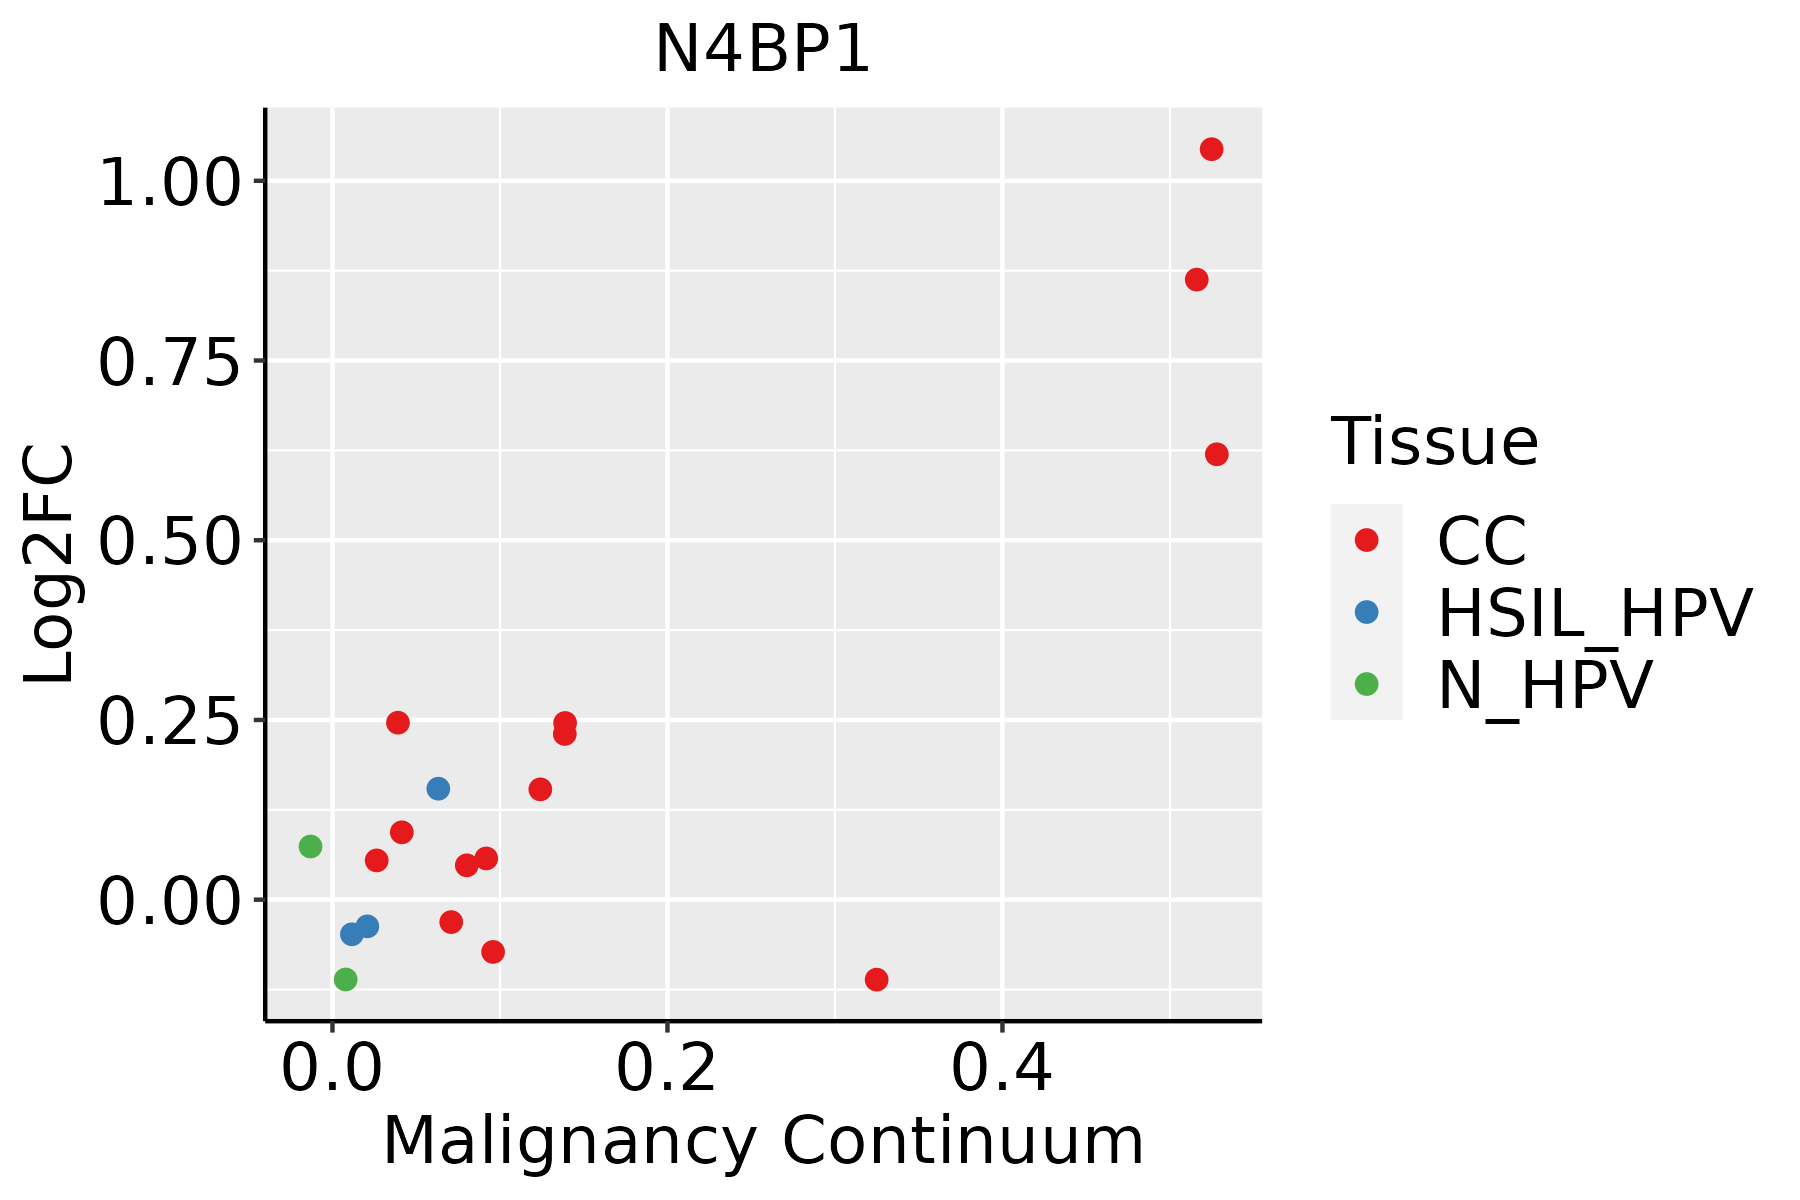 | CC: Cervix cancer |
| HSIL_HPV: HPV-infected high-grade squamous intraepithelial lesions |
| N_HPV: HPV-infected normal cervix |
| Esophagus | 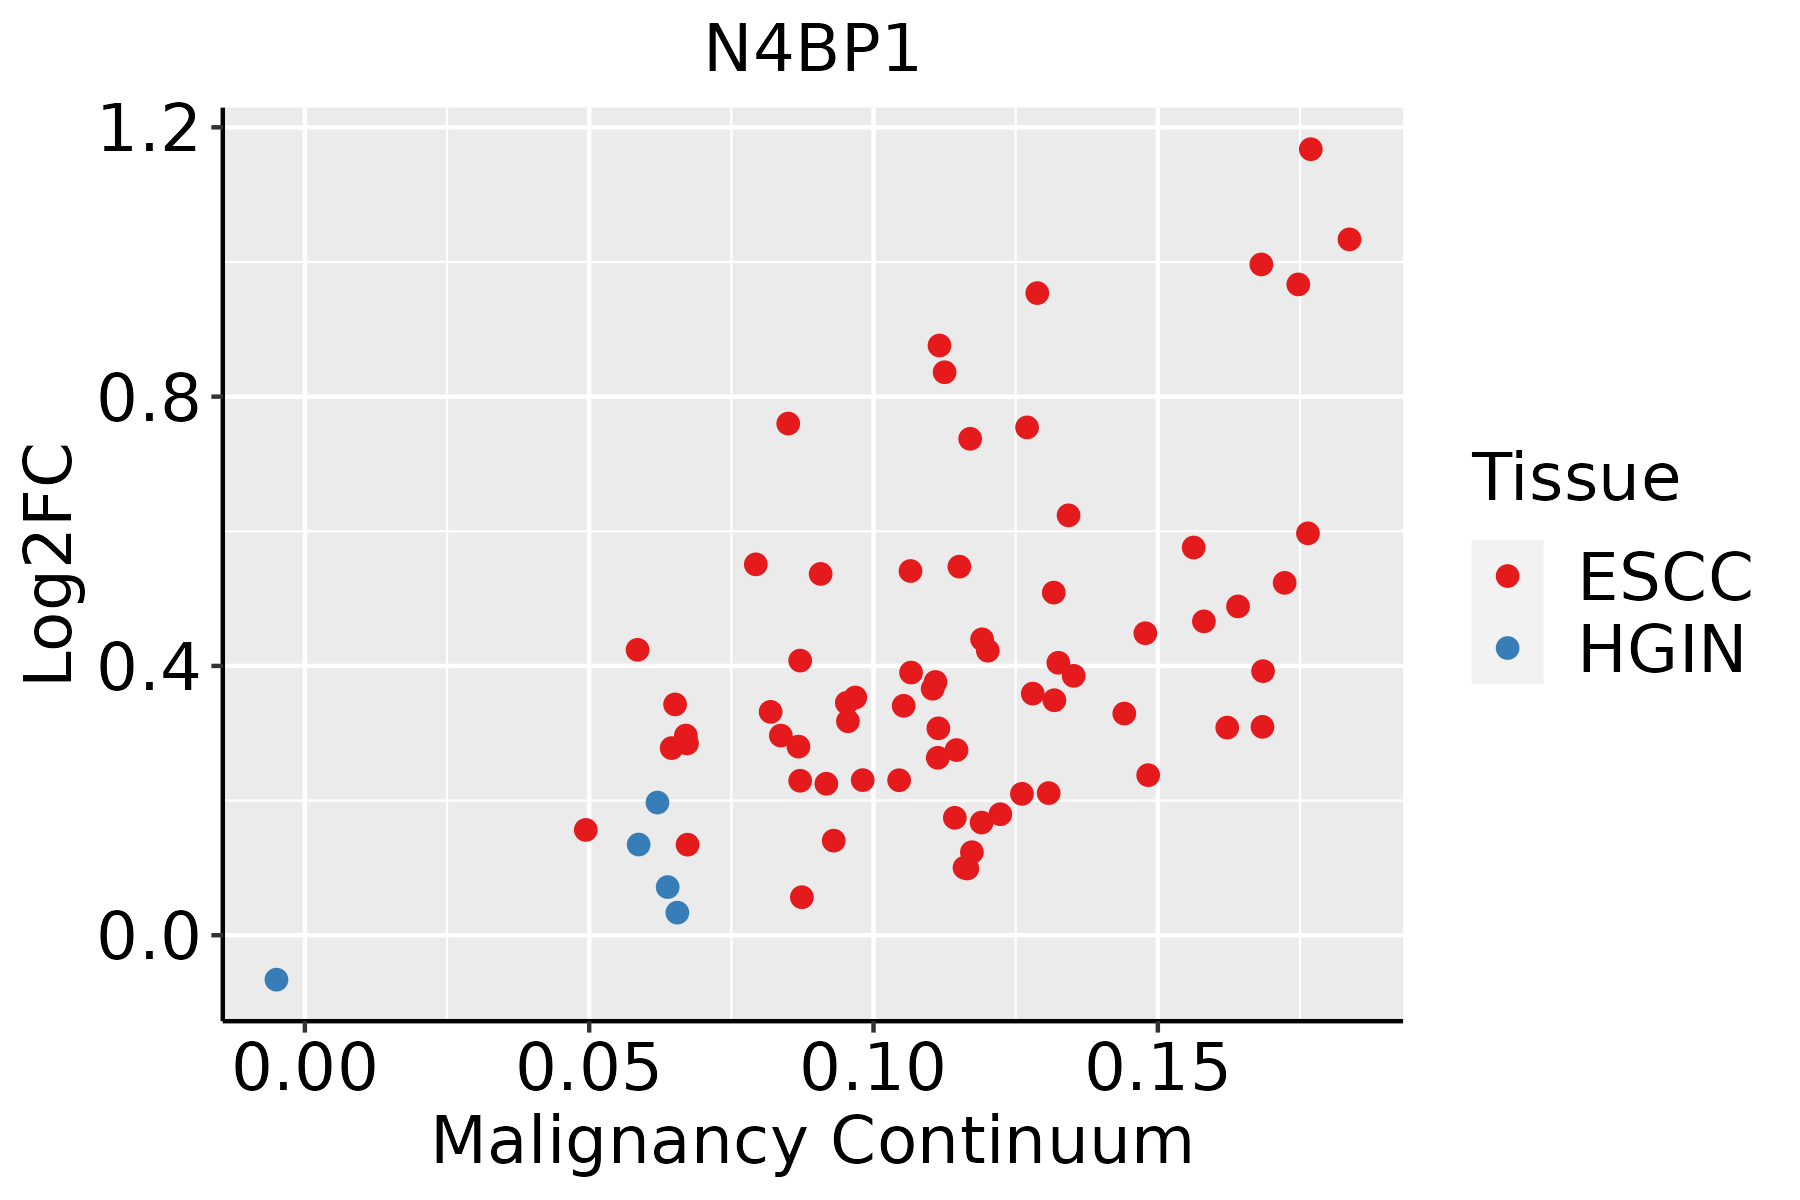 | ESCC: Esophageal squamous cell carcinoma |
| HGIN: High-grade intraepithelial neoplasias |
| LGIN: Low-grade intraepithelial neoplasias |
| Liver |  | HCC: Hepatocellular carcinoma |
| NAFLD: Non-alcoholic fatty liver disease |
| Oral Cavity | 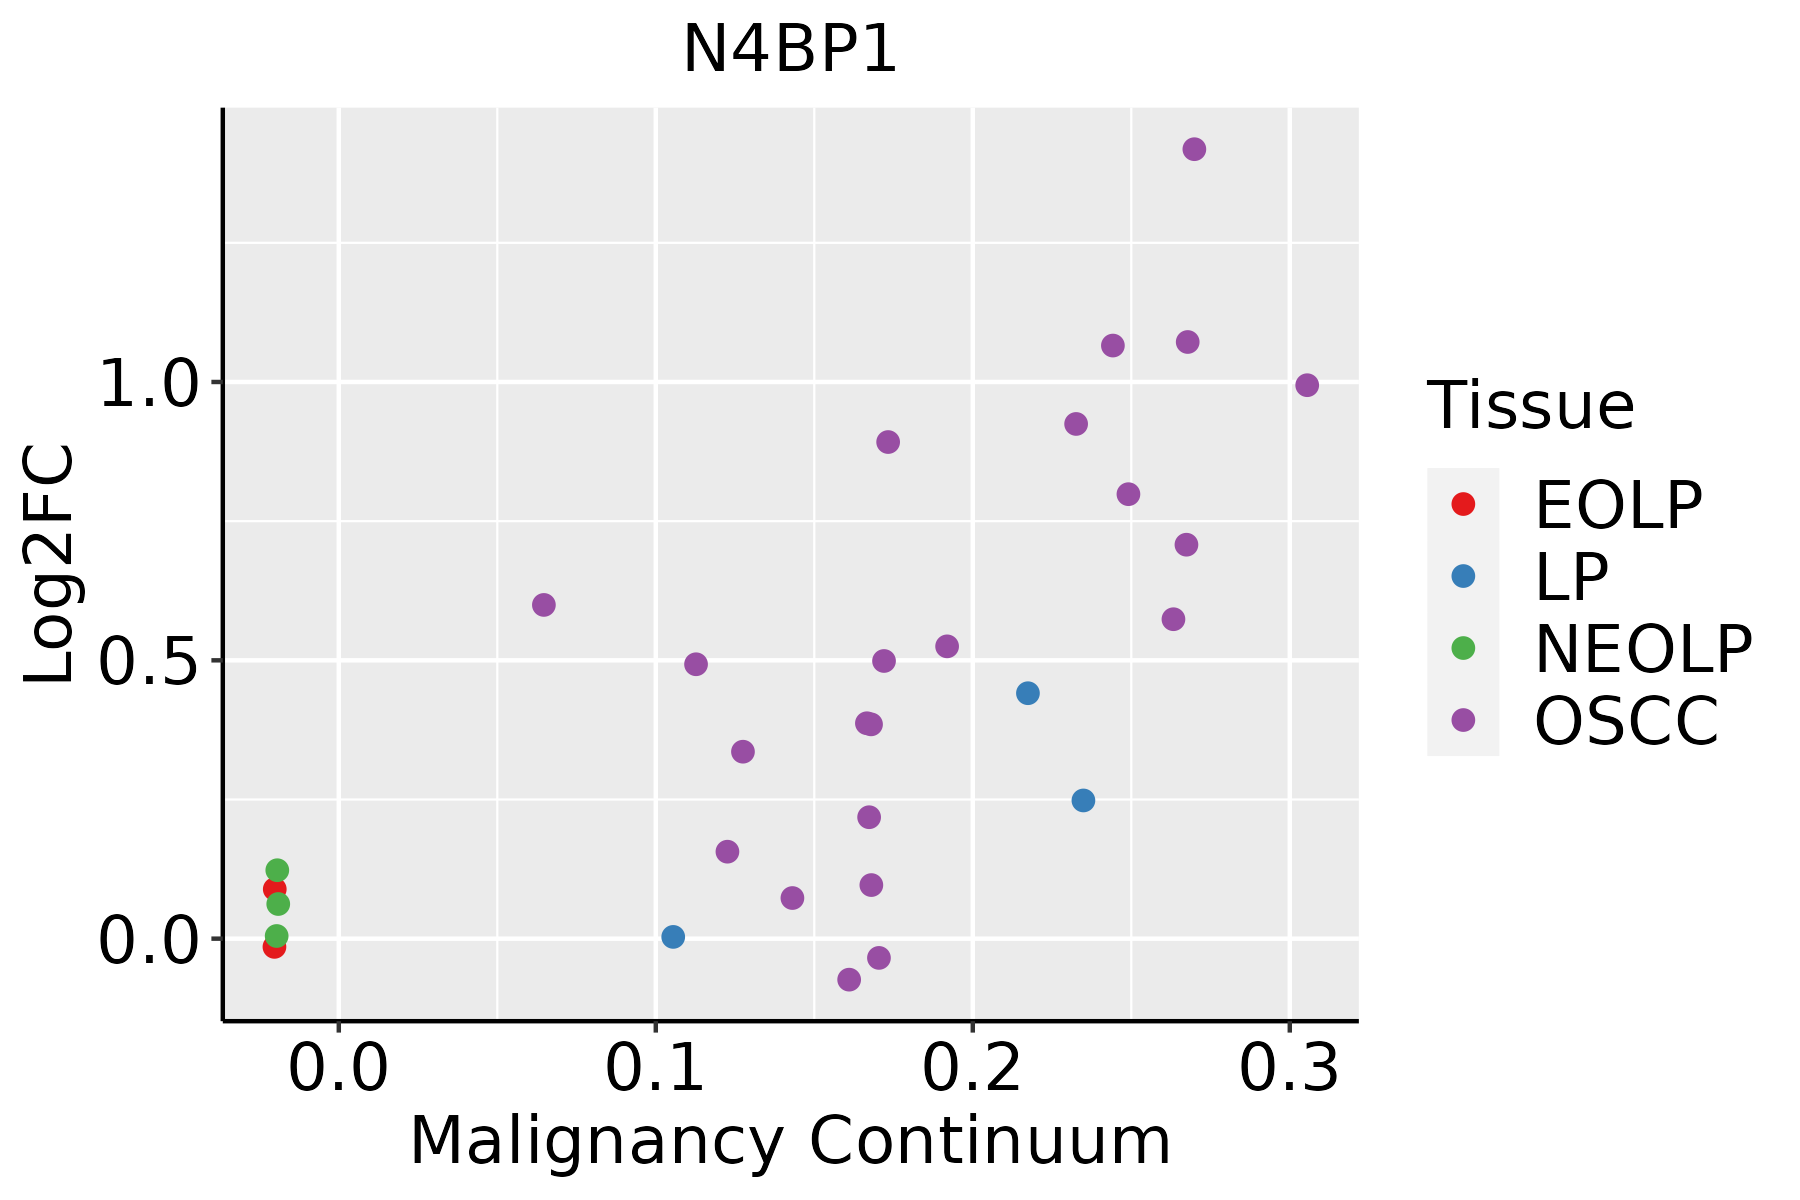 | EOLP: Erosive Oral lichen planus |
| LP: leukoplakia |
| NEOLP: Non-erosive oral lichen planus |
| OSCC: Oral squamous cell carcinoma |
| Skin | 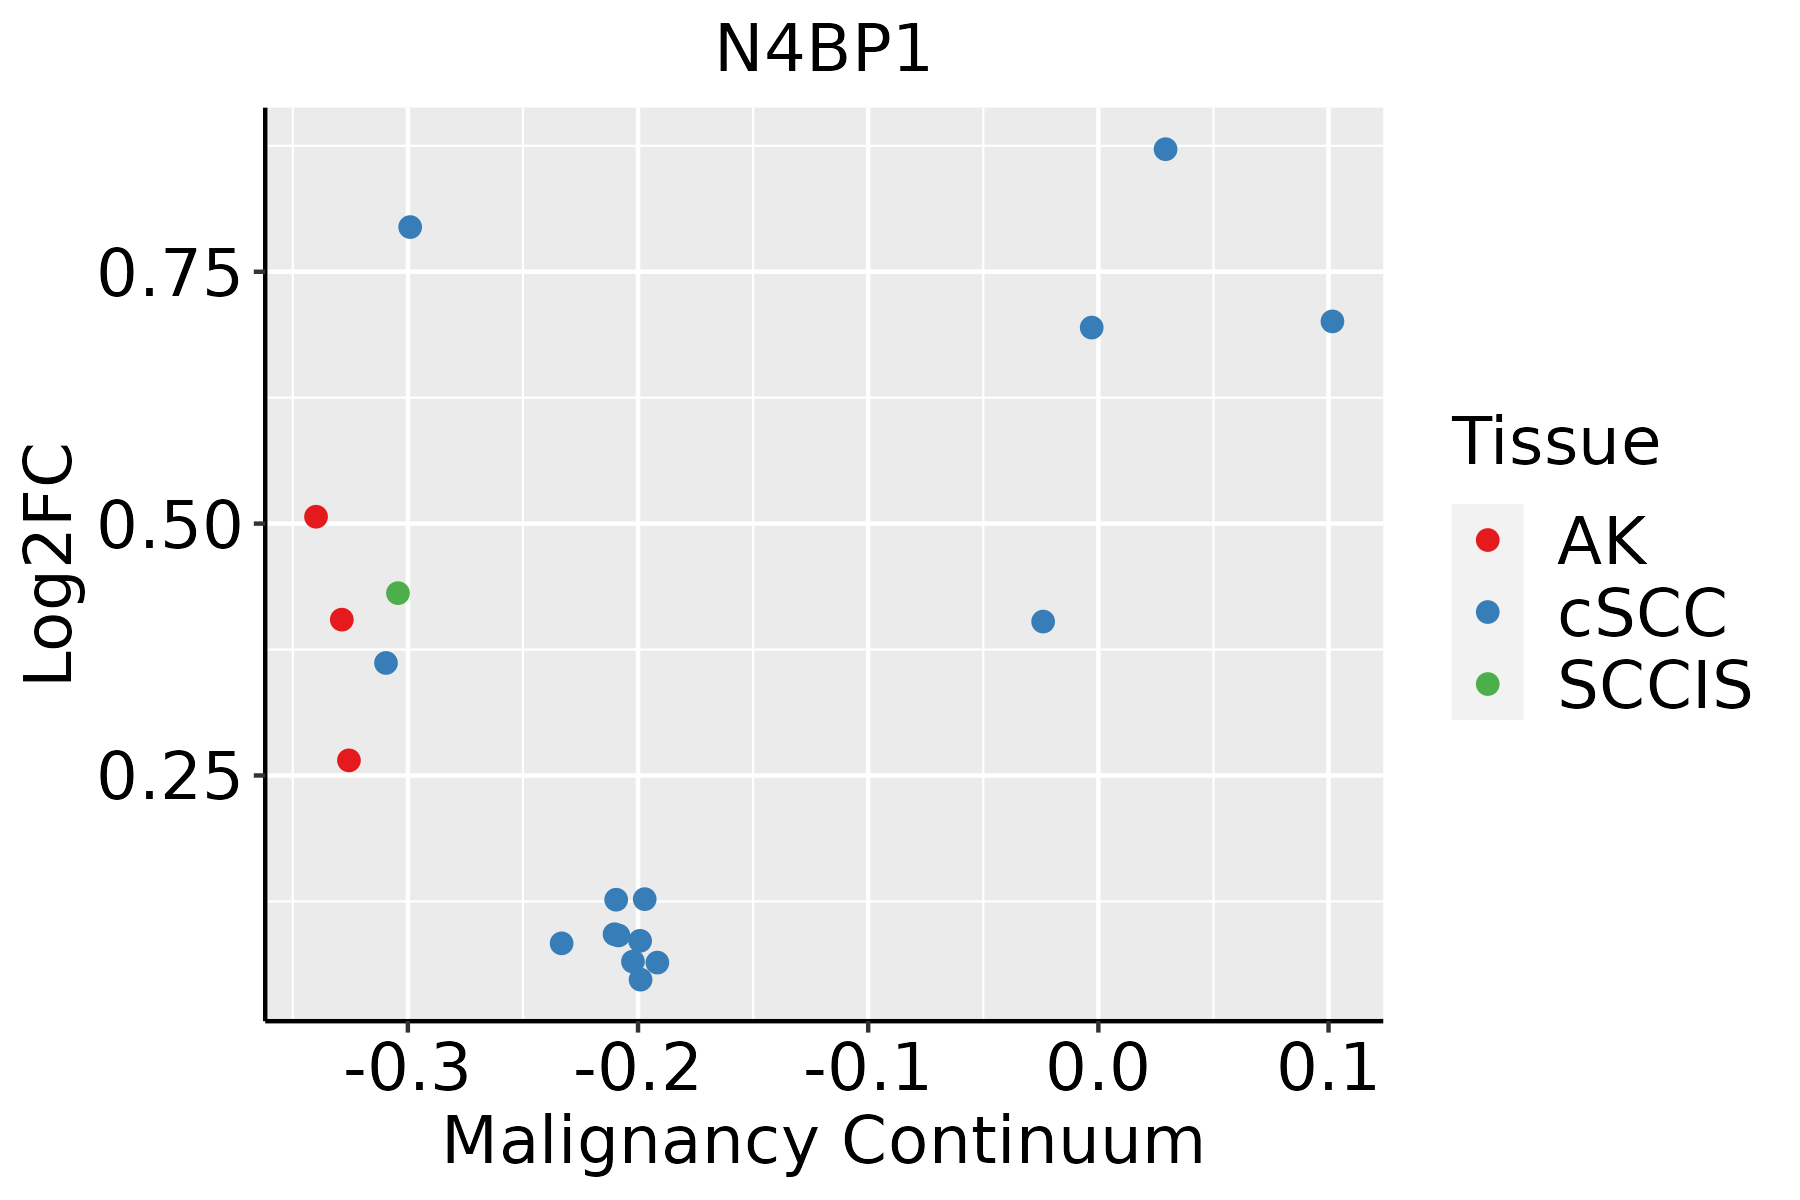 | AK: Actinic keratosis |
| cSCC: Cutaneous squamous cell carcinoma |
| SCCIS:squamous cell carcinoma in situ |
| Thyroid |  | ATC: Anaplastic thyroid cancer |
| HT: Hashimoto's thyroiditis |
| PTC: Papillary thyroid cancer |
| GO ID | Tissue | Disease Stage | Description | Gene Ratio | Bg Ratio | pvalue | p.adjust | Count |
| GO:00450887 | Thyroid | PTC | regulation of innate immune response | 89/5968 | 218/18723 | 3.16e-03 | 1.55e-02 | 89 |
| GO:0045861113 | Thyroid | PTC | negative regulation of proteolysis | 136/5968 | 351/18723 | 3.54e-03 | 1.71e-02 | 136 |
| GO:190179914 | Thyroid | PTC | negative regulation of proteasomal protein catabolic process | 25/5968 | 49/18723 | 4.09e-03 | 1.95e-02 | 25 |
| GO:00714823 | Thyroid | PTC | cellular response to light stimulus | 53/5968 | 123/18723 | 5.73e-03 | 2.59e-02 | 53 |
| GO:001049832 | Thyroid | ATC | proteasomal protein catabolic process | 309/6293 | 490/18723 | 1.78e-41 | 1.13e-37 | 309 |
| GO:0043161210 | Thyroid | ATC | proteasome-mediated ubiquitin-dependent protein catabolic process | 265/6293 | 412/18723 | 7.09e-38 | 1.49e-34 | 265 |
| GO:004217635 | Thyroid | ATC | regulation of protein catabolic process | 239/6293 | 391/18723 | 2.63e-29 | 1.85e-26 | 239 |
| GO:190336235 | Thyroid | ATC | regulation of cellular protein catabolic process | 168/6293 | 255/18723 | 3.50e-26 | 1.58e-23 | 168 |
| GO:001603234 | Thyroid | ATC | viral process | 241/6293 | 415/18723 | 5.50e-25 | 2.04e-22 | 241 |
| GO:190305035 | Thyroid | ATC | regulation of proteolysis involved in cellular protein catabolic process | 146/6293 | 221/18723 | 4.18e-23 | 1.20e-20 | 146 |
| GO:006113633 | Thyroid | ATC | regulation of proteasomal protein catabolic process | 128/6293 | 187/18723 | 1.63e-22 | 4.30e-20 | 128 |
| GO:2000058210 | Thyroid | ATC | regulation of ubiquitin-dependent protein catabolic process | 116/6293 | 164/18723 | 2.15e-22 | 5.43e-20 | 116 |
| GO:0032434210 | Thyroid | ATC | regulation of proteasomal ubiquitin-dependent protein catabolic process | 100/6293 | 134/18723 | 2.41e-22 | 5.86e-20 | 100 |
| GO:190332034 | Thyroid | ATC | regulation of protein modification by small protein conjugation or removal | 152/6293 | 242/18723 | 9.76e-21 | 1.71e-18 | 152 |
| GO:003139634 | Thyroid | ATC | regulation of protein ubiquitination | 132/6293 | 210/18723 | 3.13e-18 | 3.98e-16 | 132 |
| GO:001905835 | Thyroid | ATC | viral life cycle | 173/6293 | 317/18723 | 9.22e-15 | 5.50e-13 | 173 |
| GO:007121427 | Thyroid | ATC | cellular response to abiotic stimulus | 169/6293 | 331/18723 | 3.24e-11 | 1.08e-09 | 169 |
| GO:010400427 | Thyroid | ATC | cellular response to environmental stimulus | 169/6293 | 331/18723 | 3.24e-11 | 1.08e-09 | 169 |
| GO:003139734 | Thyroid | ATC | negative regulation of protein ubiquitination | 56/6293 | 83/18723 | 2.90e-10 | 8.20e-09 | 56 |
| GO:003133035 | Thyroid | ATC | negative regulation of cellular catabolic process | 136/6293 | 262/18723 | 6.47e-10 | 1.71e-08 | 136 |
| Hugo Symbol | Variant Class | Variant Classification | dbSNP RS | HGVSc | HGVSp | HGVSp Short | SWISSPROT | BIOTYPE | SIFT | PolyPhen | Tumor Sample Barcode | Tissue | Histology | Sex | Age | Stage | Therapy Types | Drugs | Outcome |
| N4BP1 | SNV | Missense_Mutation | rs773100602 | c.2605G>C | p.Glu869Gln | p.E869Q | O75113 | protein_coding | tolerated(0.08) | probably_damaging(0.987) | TCGA-A8-A095-01 | Breast | breast invasive carcinoma | Female | <65 | I/II | Chemotherapy | 5-fluorouracil | CR |
| N4BP1 | SNV | Missense_Mutation | | c.722G>A | p.Gly241Glu | p.G241E | O75113 | protein_coding | deleterious(0) | possibly_damaging(0.762) | TCGA-AC-A23C-01 | Breast | breast invasive carcinoma | Female | <65 | I/II | Chemotherapy | chemo | CR |
| N4BP1 | SNV | Missense_Mutation | | c.1184N>C | p.Arg395Thr | p.R395T | O75113 | protein_coding | tolerated(0.18) | benign(0.003) | TCGA-AR-A0TT-01 | Breast | breast invasive carcinoma | Female | <65 | III/IV | Chemotherapy | doxorubicin | SD |
| N4BP1 | SNV | Missense_Mutation | | c.855N>C | p.Arg285Ser | p.R285S | O75113 | protein_coding | deleterious(0) | probably_damaging(0.996) | TCGA-AR-A0TT-01 | Breast | breast invasive carcinoma | Female | <65 | III/IV | Chemotherapy | doxorubicin | SD |
| N4BP1 | SNV | Missense_Mutation | novel | c.799N>G | p.Asn267Asp | p.N267D | O75113 | protein_coding | deleterious(0.02) | possibly_damaging(0.541) | TCGA-AR-A0TU-01 | Breast | breast invasive carcinoma | Female | <65 | I/II | Unspecific | Doxorubicin | SD |
| N4BP1 | SNV | Missense_Mutation | | c.2113G>A | p.Asp705Asn | p.D705N | O75113 | protein_coding | deleterious(0) | probably_damaging(0.966) | TCGA-C8-A12Q-01 | Breast | breast invasive carcinoma | Female | >=65 | III/IV | Unknown | Unknown | PD |
| N4BP1 | insertion | Frame_Shift_Ins | novel | c.2559_2560insTGTGG | p.Thr854CysfsTer6 | p.T854Cfs*6 | O75113 | protein_coding | | | TCGA-AN-A046-01 | Breast | breast invasive carcinoma | Female | >=65 | I/II | Unknown | Unknown | SD |
| N4BP1 | insertion | Frame_Shift_Ins | novel | c.2558_2559insTGCGTCCGTGATGCCTCCTA | p.Glu853AspfsTer12 | p.E853Dfs*12 | O75113 | protein_coding | | | TCGA-AN-A046-01 | Breast | breast invasive carcinoma | Female | >=65 | I/II | Unknown | Unknown | SD |
| N4BP1 | insertion | Nonsense_Mutation | novel | c.1735_1736insATGGAGGCACCTTTAGGCCAAATTTAATTTAATTTAA | p.Ser579TyrfsTer11 | p.S579Yfs*11 | O75113 | protein_coding | | | TCGA-AO-A03T-01 | Breast | breast invasive carcinoma | Female | <65 | I/II | Chemotherapy | cyclophosphamide | SD |
| N4BP1 | insertion | Frame_Shift_Ins | novel | c.797_798insGGTTCAGT | p.Ile266MetfsTer4 | p.I266Mfs*4 | O75113 | protein_coding | | | TCGA-AR-A0TU-01 | Breast | breast invasive carcinoma | Female | <65 | I/II | Unspecific | Doxorubicin | SD |


