
|
|||||
|
 | |
| |
| |
| |
| |
| |
|
Gene: LOX |
Gene summary for LOX |
| Gene information | Species | Human | Gene symbol | LOX | Gene ID | 4015 |
| Gene name | lysyl oxidase | |
| Gene Alias | AAT10 | |
| Cytomap | 5q23.1 | |
| Gene Type | protein-coding | GO ID | GO:0001501 | UniProtAcc | B7ZAJ4 |
Top |
Malignant transformation analysis |
| Identification of the aberrant gene expression in precancerous and cancerous lesions by comparing the gene expression of stem-like cells in diseased tissues with normal stem cells |
| Entrez ID | Symbol | Replicates | Species | Organ | Tissue | Adj P-value | Log2FC | Malignancy |
| 4015 | LOX | P4T-E | Human | Esophagus | ESCC | 3.52e-03 | 3.03e-01 | 0.1323 |
| 4015 | LOX | P8T-E | Human | Esophagus | ESCC | 7.98e-04 | 2.02e-01 | 0.0889 |
| 4015 | LOX | P16T-E | Human | Esophagus | ESCC | 2.51e-10 | 3.41e-01 | 0.1153 |
| 4015 | LOX | P17T-E | Human | Esophagus | ESCC | 1.22e-04 | 5.42e-01 | 0.1278 |
| 4015 | LOX | P23T-E | Human | Esophagus | ESCC | 8.95e-05 | 2.66e-01 | 0.108 |
| 4015 | LOX | P32T-E | Human | Esophagus | ESCC | 7.80e-22 | 9.89e-01 | 0.1666 |
| 4015 | LOX | P37T-E | Human | Esophagus | ESCC | 9.32e-18 | 6.36e-01 | 0.1371 |
| 4015 | LOX | P42T-E | Human | Esophagus | ESCC | 9.84e-07 | 3.99e-01 | 0.1175 |
| 4015 | LOX | P44T-E | Human | Esophagus | ESCC | 2.72e-04 | 6.69e-01 | 0.1096 |
| 4015 | LOX | P52T-E | Human | Esophagus | ESCC | 1.68e-10 | 5.54e-01 | 0.1555 |
| 4015 | LOX | P61T-E | Human | Esophagus | ESCC | 3.95e-07 | 2.81e-01 | 0.099 |
| 4015 | LOX | P62T-E | Human | Esophagus | ESCC | 1.12e-04 | 2.69e-01 | 0.1302 |
| 4015 | LOX | P74T-E | Human | Esophagus | ESCC | 1.39e-02 | 1.59e-01 | 0.1479 |
| 4015 | LOX | P76T-E | Human | Esophagus | ESCC | 1.70e-17 | 7.18e-01 | 0.1207 |
| 4015 | LOX | P89T-E | Human | Esophagus | ESCC | 1.46e-19 | 1.93e+00 | 0.1752 |
| 4015 | LOX | P91T-E | Human | Esophagus | ESCC | 1.63e-05 | 1.14e+00 | 0.1828 |
| 4015 | LOX | P130T-E | Human | Esophagus | ESCC | 2.01e-15 | 5.56e-01 | 0.1676 |
| 4015 | LOX | C21 | Human | Oral cavity | OSCC | 1.02e-16 | 8.01e-01 | 0.2678 |
| 4015 | LOX | C30 | Human | Oral cavity | OSCC | 8.45e-06 | 6.01e-01 | 0.3055 |
| 4015 | LOX | C43 | Human | Oral cavity | OSCC | 1.19e-30 | 5.57e-01 | 0.1704 |
| Page: 1 2 |
| Tissue | Expression Dynamics | Abbreviation |
| Esophagus | 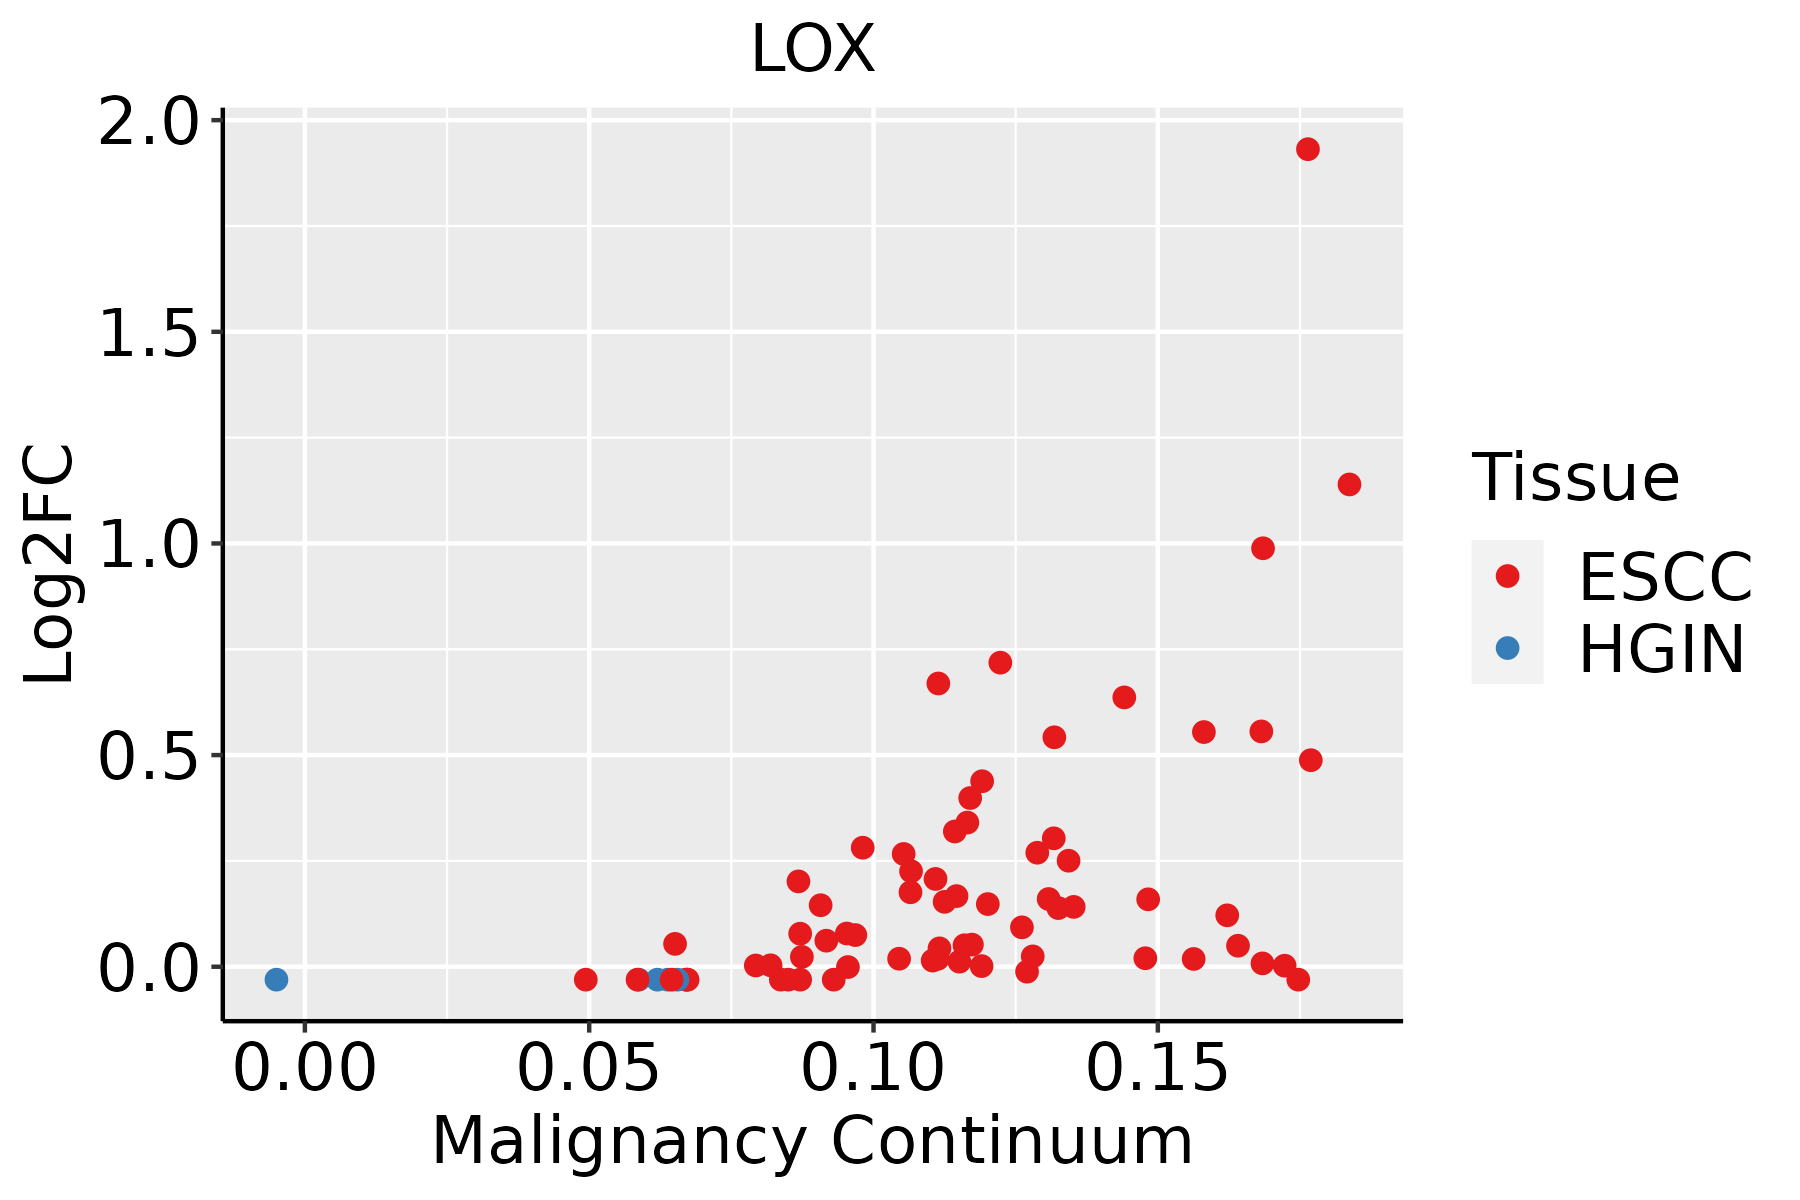 | ESCC: Esophageal squamous cell carcinoma |
| HGIN: High-grade intraepithelial neoplasias | ||
| LGIN: Low-grade intraepithelial neoplasias | ||
| Oral Cavity | 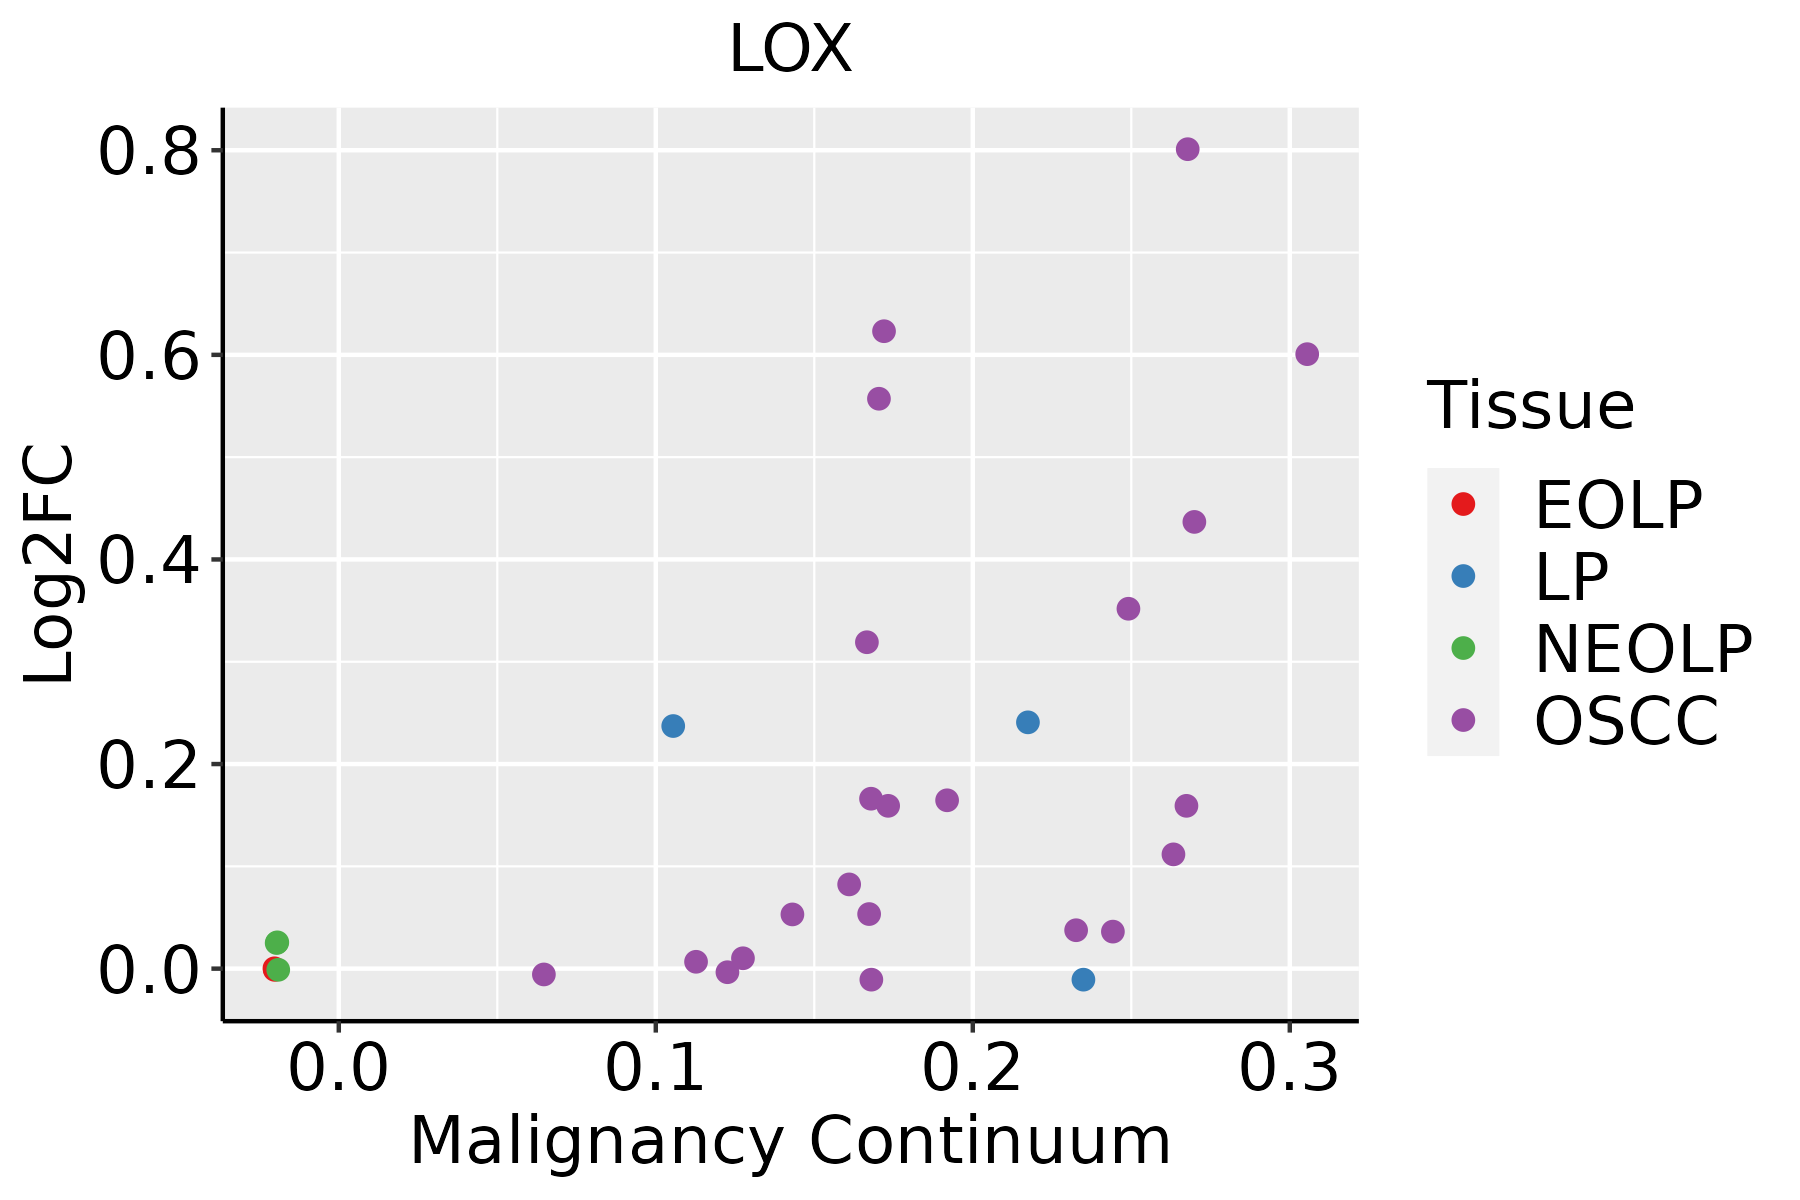 | EOLP: Erosive Oral lichen planus |
| LP: leukoplakia | ||
| NEOLP: Non-erosive oral lichen planus | ||
| OSCC: Oral squamous cell carcinoma | ||
| Thyroid | 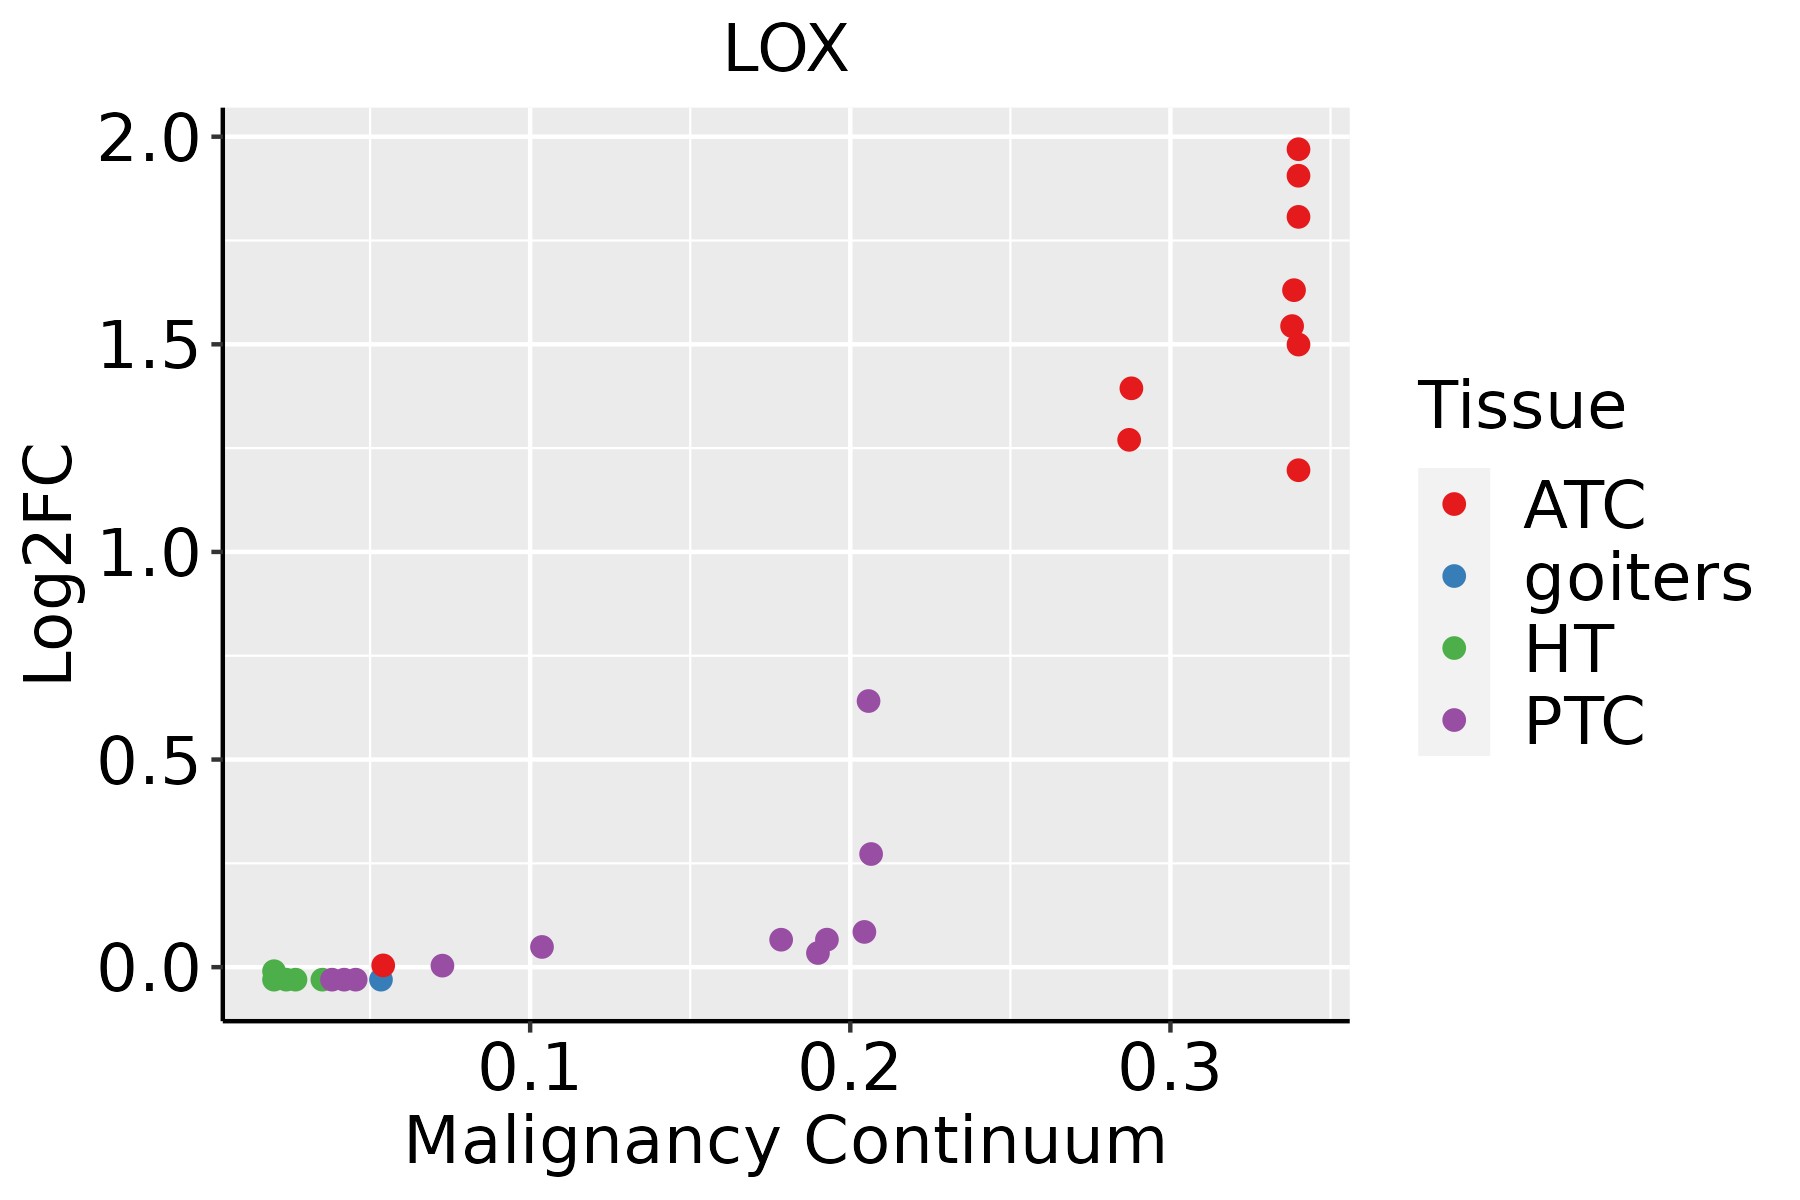 | ATC: Anaplastic thyroid cancer |
| HT: Hashimoto's thyroiditis | ||
| PTC: Papillary thyroid cancer |
| ∗log2FC in expression of this searched gene in stem-like cells from each diseased tissue sample relative to stem-like cells in normal samples in each tissue plotted against the malignancy continuum. Samples are colored based on if they are from different disease stage. |
Top |
Malignant transformation related pathway analysis |
| Find out the enriched GO biological processes and KEGG pathways involved in transition from healthy to precancer to cancer |
| Tissue | Disease Stage | Enriched GO biological Processes |
| Colorectum | AD |  |
| Colorectum | SER |  |
| Colorectum | MSS |  |
| Colorectum | MSI-H |  |
| Colorectum | FAP |  |
| ∗Top 15 enriched GO BP terms are showed in the bar plot of each disease state in each tissue. Each row represents a significant GO biological process which is colored according to the -log10(p.adjust). |
| Page: 1 2 3 4 5 6 7 8 9 |
| GO ID | Tissue | Disease Stage | Description | Gene Ratio | Bg Ratio | pvalue | p.adjust | Count |
| GO:00018377 | Oral cavity | OSCC | epithelial to mesenchymal transition | 82/7305 | 157/18723 | 5.09e-04 | 2.98e-03 | 82 |
| GO:00303248 | Oral cavity | OSCC | lung development | 91/7305 | 177/18723 | 5.18e-04 | 3.01e-03 | 91 |
| GO:00452293 | Oral cavity | OSCC | external encapsulating structure organization | 147/7305 | 304/18723 | 5.30e-04 | 3.08e-03 | 147 |
| GO:00430623 | Oral cavity | OSCC | extracellular structure organization | 146/7305 | 302/18723 | 5.59e-04 | 3.23e-03 | 146 |
| GO:199074818 | Oral cavity | OSCC | cellular detoxification | 63/7305 | 116/18723 | 5.80e-04 | 3.31e-03 | 63 |
| GO:00344406 | Oral cavity | OSCC | lipid oxidation | 59/7305 | 108/18723 | 7.01e-04 | 3.89e-03 | 59 |
| GO:00480086 | Oral cavity | OSCC | platelet-derived growth factor receptor signaling pathway | 34/7305 | 56/18723 | 8.17e-04 | 4.35e-03 | 34 |
| GO:00016558 | Oral cavity | OSCC | urogenital system development | 160/7305 | 338/18723 | 1.03e-03 | 5.31e-03 | 160 |
| GO:009886918 | Oral cavity | OSCC | cellular oxidant detoxification | 55/7305 | 101/18723 | 1.16e-03 | 5.89e-03 | 55 |
| GO:000632510 | Oral cavity | OSCC | chromatin organization | 190/7305 | 409/18723 | 1.17e-03 | 5.97e-03 | 190 |
| GO:00107173 | Oral cavity | OSCC | regulation of epithelial to mesenchymal transition | 54/7305 | 99/18723 | 1.21e-03 | 6.10e-03 | 54 |
| GO:007124115 | Oral cavity | OSCC | cellular response to inorganic substance | 111/7305 | 226/18723 | 1.22e-03 | 6.10e-03 | 111 |
| GO:009723718 | Oral cavity | OSCC | cellular response to toxic substance | 65/7305 | 124/18723 | 1.63e-03 | 7.74e-03 | 65 |
| GO:19016173 | Oral cavity | OSCC | organic hydroxy compound biosynthetic process | 115/7305 | 237/18723 | 1.73e-03 | 8.18e-03 | 115 |
| GO:00605416 | Oral cavity | OSCC | respiratory system development | 100/7305 | 203/18723 | 1.83e-03 | 8.60e-03 | 100 |
| GO:000181910 | Oral cavity | OSCC | positive regulation of cytokine production | 213/7305 | 467/18723 | 1.93e-03 | 8.96e-03 | 213 |
| GO:00603269 | Oral cavity | OSCC | cell chemotaxis | 146/7305 | 310/18723 | 2.13e-03 | 9.80e-03 | 146 |
| GO:00434916 | Oral cavity | OSCC | protein kinase B signaling | 103/7305 | 211/18723 | 2.29e-03 | 1.02e-02 | 103 |
| GO:00071789 | Oral cavity | OSCC | transmembrane receptor protein serine/threonine kinase signaling pathway | 165/7305 | 355/18723 | 2.31e-03 | 1.02e-02 | 165 |
| GO:00605378 | Oral cavity | OSCC | muscle tissue development | 185/7305 | 403/18723 | 2.60e-03 | 1.14e-02 | 185 |
| Page: 1 2 3 4 5 6 7 8 9 10 11 12 13 14 15 16 17 18 19 20 21 22 23 24 25 26 27 28 29 |
| Pathway ID | Tissue | Disease Stage | Description | Gene Ratio | Bg Ratio | pvalue | p.adjust | qvalue | Count |
| Page: 1 |
Top |
Cell-cell communication analysis |
| Identification of potential cell-cell interactions between two cell types and their ligand-receptor pairs for different disease states |
| Ligand | Receptor | LRpair | Pathway | Tissue | Disease Stage |
| Page: 1 |
Top |
Single-cell gene regulatory network inference analysis |
| Find out the significant the regulons (TFs) and the target genes of each regulon across cell types for different disease states |
| TF | Cell Type | Tissue | Disease Stage | Target Gene | RSS | Regulon Activity |
| ∗The dot plots of a searched regulon are shown for all cell subpopulations in each disease state of each tissue based on the regulon specific score inferred using pySCENIC and by calculating the average expression. |
| Page: 1 |
Top |
Somatic mutation of malignant transformation related genes |
| Annotation of somatic variants for genes involved in malignant transformation |
| Hugo Symbol | Variant Class | Variant Classification | dbSNP RS | HGVSc | HGVSp | HGVSp Short | SWISSPROT | BIOTYPE | SIFT | PolyPhen | Tumor Sample Barcode | Tissue | Histology | Sex | Age | Stage | Therapy Types | Drugs | Outcome |
| LOX | insertion | In_Frame_Ins | novel | c.899_900insAAGATATCTCTGTTTTTTCACCTGTGAAACCATTCCTTCCTTCTGTTT | p.Glu300_Phe301insArgTyrLeuCysPhePheThrCysGluThrIleProSerPheCysLeu | p.E300_F301insRYLCFFTCETIPSFCL | P28300 | protein_coding | TCGA-AR-A0TY-01 | Breast | breast invasive carcinoma | Female | <65 | I/II | Unspecific | Paclitaxel | PD | ||
| LOX | SNV | Missense_Mutation | novel | c.1202G>A | p.Arg401His | p.R401H | P28300 | protein_coding | tolerated(0.66) | benign(0.07) | TCGA-2W-A8YY-01 | Cervix | cervical & endocervical cancer | Female | <65 | I/II | Chemotherapy | cisplatin | CR |
| LOX | SNV | Missense_Mutation | c.1010N>A | p.Arg337Gln | p.R337Q | P28300 | protein_coding | deleterious(0.02) | probably_damaging(0.98) | TCGA-EA-A3HS-01 | Cervix | cervical & endocervical cancer | Female | <65 | I/II | Unknown | Unknown | SD | |
| LOX | SNV | Missense_Mutation | c.49G>A | p.Ala17Thr | p.A17T | P28300 | protein_coding | tolerated(0.37) | benign(0) | TCGA-AA-3713-01 | Colorectum | colon adenocarcinoma | Male | >=65 | III/IV | Chemotherapy | 5-fluorouracil | PR | |
| LOX | SNV | Missense_Mutation | novel | c.761N>C | p.Val254Ala | p.V254A | P28300 | protein_coding | tolerated(0.52) | benign(0.048) | TCGA-AA-3949-01 | Colorectum | colon adenocarcinoma | Female | >=65 | III/IV | Unknown | Unknown | SD |
| LOX | SNV | Missense_Mutation | c.19G>A | p.Val7Met | p.V7M | P28300 | protein_coding | tolerated(0.08) | benign(0.003) | TCGA-AA-A022-01 | Colorectum | colon adenocarcinoma | Female | >=65 | I/II | Unknown | Unknown | SD | |
| LOX | SNV | Missense_Mutation | c.842N>A | p.Arg281Gln | p.R281Q | P28300 | protein_coding | deleterious(0.02) | possibly_damaging(0.821) | TCGA-CA-6717-01 | Colorectum | colon adenocarcinoma | Male | <65 | I/II | Chemotherapy | oxaliplatin | CR | |
| LOX | SNV | Missense_Mutation | rs566461481 | c.364N>T | p.Arg122Cys | p.R122C | P28300 | protein_coding | deleterious(0.01) | benign(0.001) | TCGA-CK-5913-01 | Colorectum | colon adenocarcinoma | Female | <65 | I/II | Unknown | Unknown | SD |
| LOX | SNV | Missense_Mutation | c.76G>A | p.Ala26Thr | p.A26T | P28300 | protein_coding | tolerated(0.61) | benign(0) | TCGA-NH-A5IV-01 | Colorectum | colon adenocarcinoma | Female | >=65 | I/II | Unknown | Unknown | SD | |
| LOX | SNV | Missense_Mutation | c.842N>A | p.Arg281Gln | p.R281Q | P28300 | protein_coding | deleterious(0.02) | possibly_damaging(0.821) | TCGA-EI-6917-01 | Colorectum | rectum adenocarcinoma | Male | <65 | III/IV | Chemotherapy | 5fluorouracil+oxaciplatina+l-folinian | SD |
| Page: 1 2 3 4 5 |
Top |
Related drugs of malignant transformation related genes |
| Identification of chemicals and drugs interact with genes involved in malignant transfromation |
| (DGIdb 4.0) |
| Entrez ID | Symbol | Category | Interaction Types | Drug Claim Name | Drug Name | PMIDs |
| 4015 | LOX | ENZYME, DRUGGABLE GENOME | inhibitor | 385612244 | ||
| 4015 | LOX | ENZYME, DRUGGABLE GENOME | inhibitor | 385612245 |
| Page: 1 |

Copyright 2023-Present -The University of Texas Health Science Center at Houston |