
|
|||||
|
 | |
| |
| |
| |
| |
| |
|
Gene: LGMN |
Gene summary for LGMN |
| Gene information | Species | Human | Gene symbol | LGMN | Gene ID | 5641 |
| Gene name | legumain | |
| Gene Alias | AEP | |
| Cytomap | 14q32.12 | |
| Gene Type | protein-coding | GO ID | GO:0000278 | UniProtAcc | Q53XC6 |
Top |
Malignant transformation analysis |
| Identification of the aberrant gene expression in precancerous and cancerous lesions by comparing the gene expression of stem-like cells in diseased tissues with normal stem cells |
| Entrez ID | Symbol | Replicates | Species | Organ | Tissue | Adj P-value | Log2FC | Malignancy |
| 5641 | LGMN | HTA11_1938_2000001011 | Human | Colorectum | AD | 3.34e-12 | 8.05e-01 | -0.0811 |
| 5641 | LGMN | HTA11_347_2000001011 | Human | Colorectum | AD | 1.51e-10 | 4.67e-01 | -0.1954 |
| 5641 | LGMN | HTA11_696_2000001011 | Human | Colorectum | AD | 1.45e-05 | 3.31e-01 | -0.1464 |
| 5641 | LGMN | HTA11_1391_2000001011 | Human | Colorectum | AD | 5.10e-11 | 6.16e-01 | -0.059 |
| 5641 | LGMN | HTA11_866_3004761011 | Human | Colorectum | AD | 1.46e-08 | 4.60e-01 | 0.096 |
| 5641 | LGMN | HTA11_8622_2000001021 | Human | Colorectum | SER | 1.84e-06 | 3.89e-01 | 0.0528 |
| 5641 | LGMN | HTA11_7696_3000711011 | Human | Colorectum | AD | 8.02e-08 | 2.71e-01 | 0.0674 |
| 5641 | LGMN | HTA11_6818_2000001021 | Human | Colorectum | AD | 4.82e-10 | 5.45e-01 | 0.0588 |
| 5641 | LGMN | HTA11_99999970781_79442 | Human | Colorectum | MSS | 1.10e-30 | 1.05e+00 | 0.294 |
| 5641 | LGMN | HTA11_99999965062_69753 | Human | Colorectum | MSI-H | 6.96e-05 | 1.11e+00 | 0.3487 |
| 5641 | LGMN | HTA11_99999965104_69814 | Human | Colorectum | MSS | 8.95e-06 | 5.09e-01 | 0.281 |
| 5641 | LGMN | LZE2T | Human | Esophagus | ESCC | 7.83e-04 | 5.74e-01 | 0.082 |
| 5641 | LGMN | LZE4T | Human | Esophagus | ESCC | 1.54e-14 | 5.60e-01 | 0.0811 |
| 5641 | LGMN | LZE7T | Human | Esophagus | ESCC | 9.85e-07 | 2.20e-01 | 0.0667 |
| 5641 | LGMN | LZE8T | Human | Esophagus | ESCC | 1.92e-03 | 9.15e-02 | 0.067 |
| 5641 | LGMN | LZE20T | Human | Esophagus | ESCC | 9.50e-07 | 6.30e-01 | 0.0662 |
| 5641 | LGMN | LZE24T | Human | Esophagus | ESCC | 7.22e-23 | 9.36e-01 | 0.0596 |
| 5641 | LGMN | LZE21T | Human | Esophagus | ESCC | 1.29e-04 | 5.11e-01 | 0.0655 |
| 5641 | LGMN | LZE6T | Human | Esophagus | ESCC | 1.37e-02 | 4.40e-01 | 0.0845 |
| 5641 | LGMN | P1T-E | Human | Esophagus | ESCC | 5.77e-07 | 4.79e-01 | 0.0875 |
| Page: 1 2 3 4 5 6 7 |
| Tissue | Expression Dynamics | Abbreviation |
| Colorectum (GSE201348) |  | FAP: Familial adenomatous polyposis |
| CRC: Colorectal cancer | ||
| Colorectum (HTA11) | 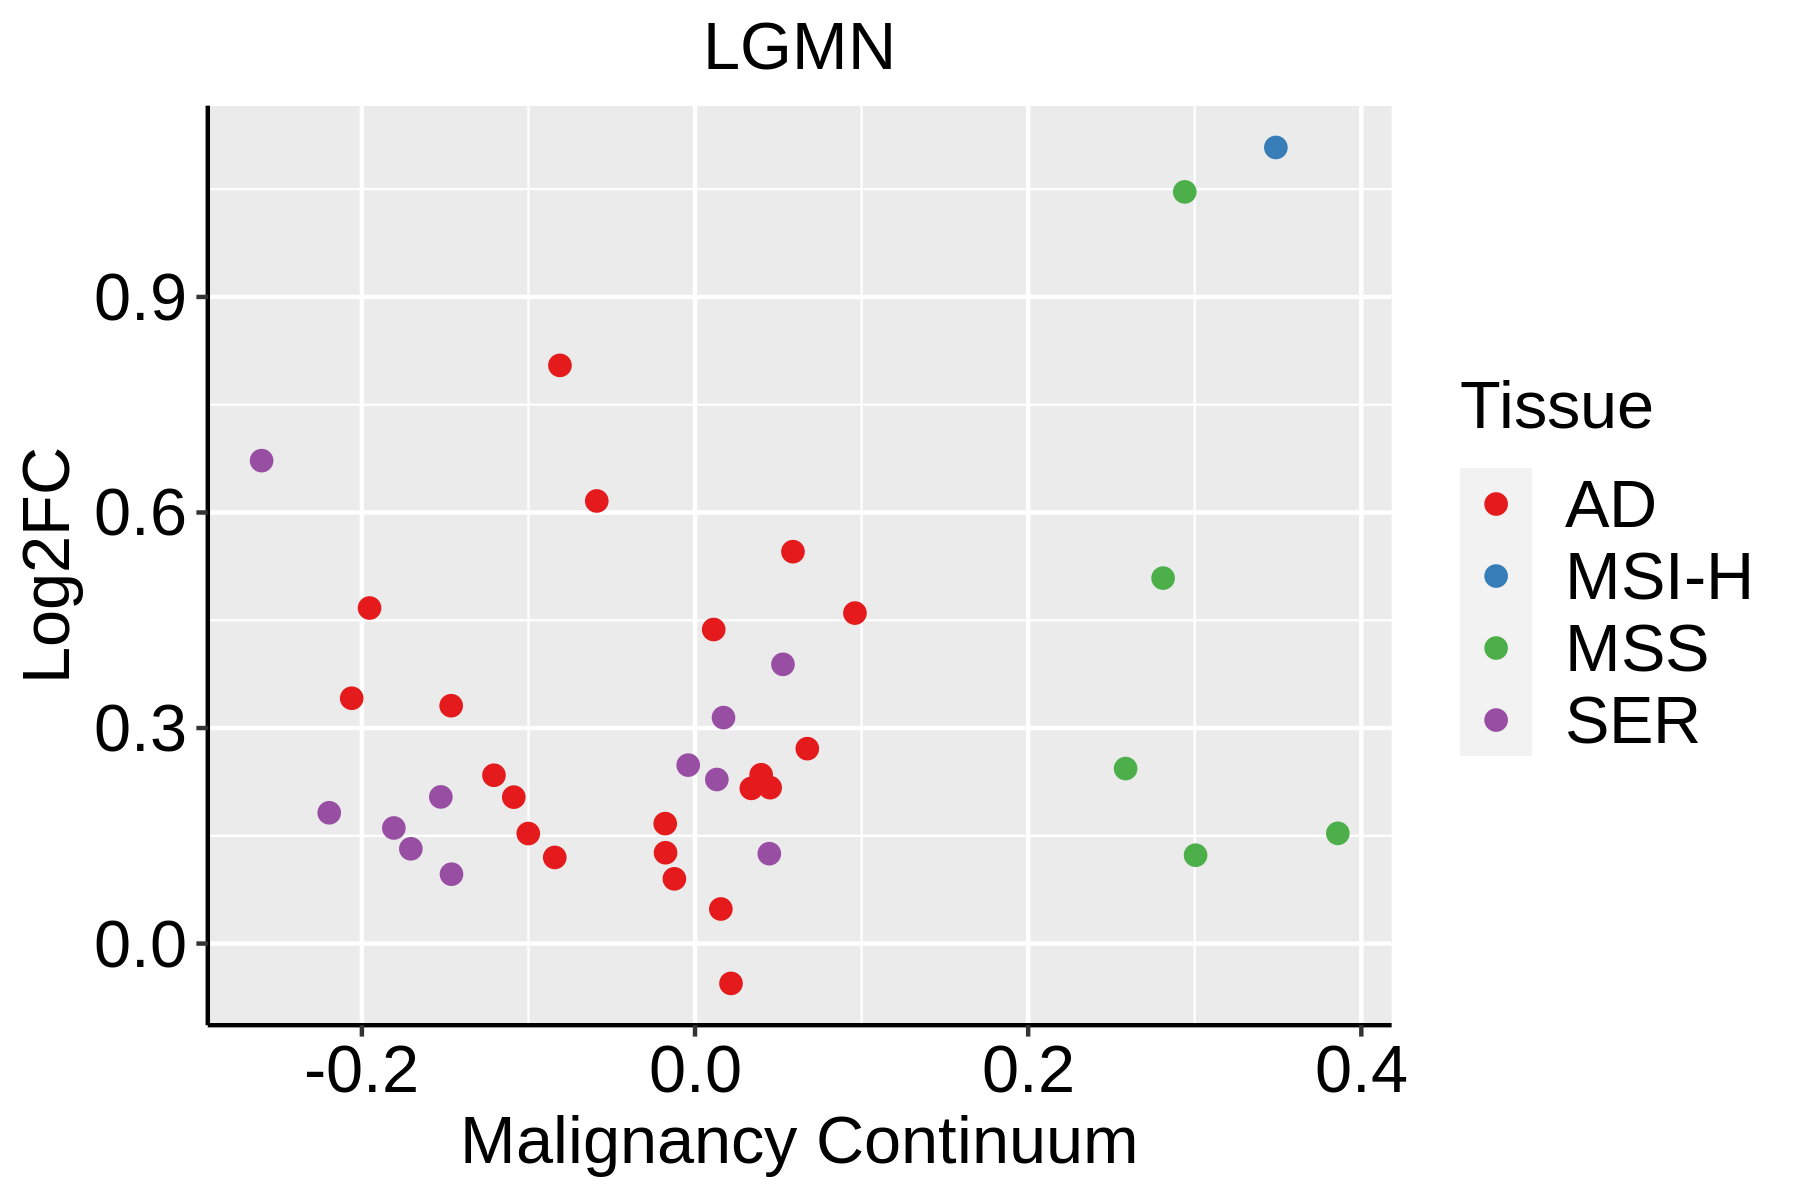 | AD: Adenomas |
| SER: Sessile serrated lesions | ||
| MSI-H: Microsatellite-high colorectal cancer | ||
| MSS: Microsatellite stable colorectal cancer | ||
| Esophagus | 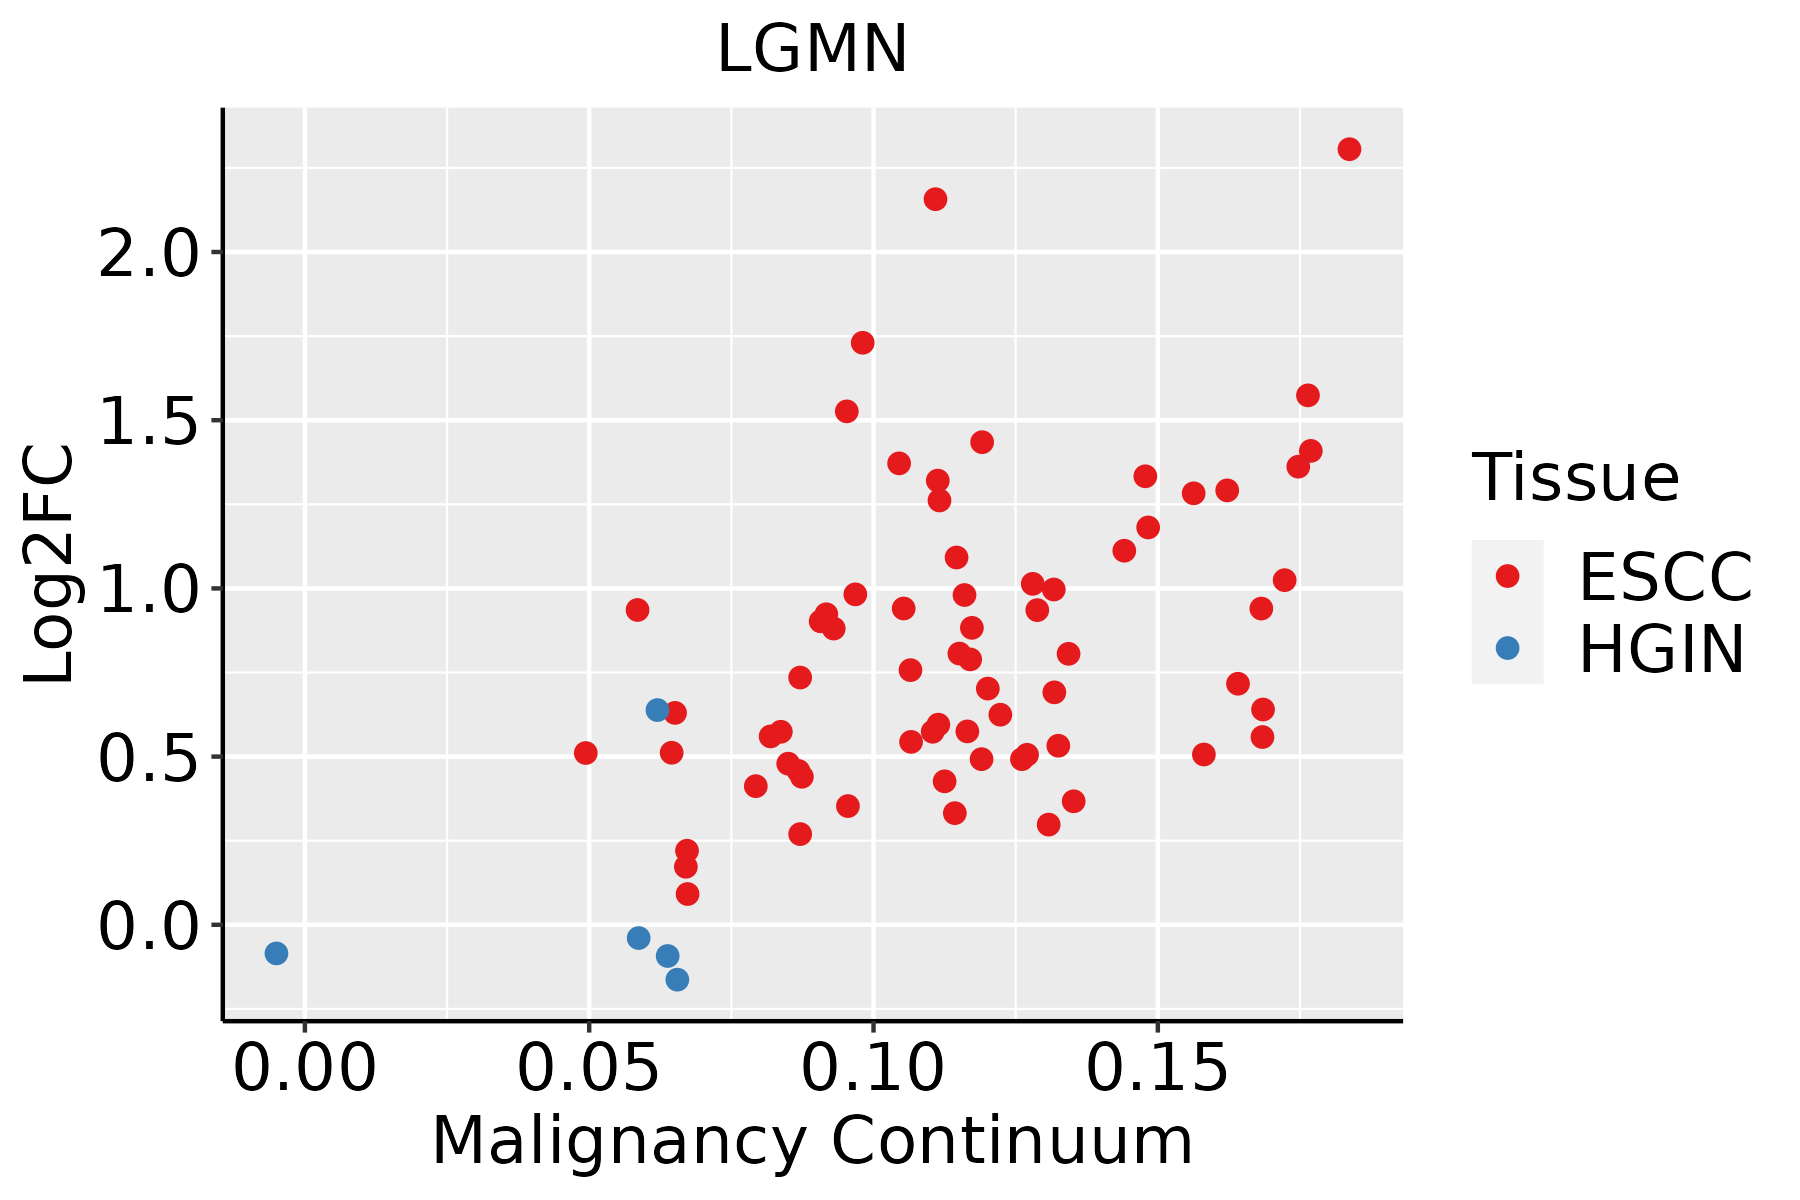 | ESCC: Esophageal squamous cell carcinoma |
| HGIN: High-grade intraepithelial neoplasias | ||
| LGIN: Low-grade intraepithelial neoplasias | ||
| Liver |  | HCC: Hepatocellular carcinoma |
| NAFLD: Non-alcoholic fatty liver disease | ||
| Oral Cavity |  | EOLP: Erosive Oral lichen planus |
| LP: leukoplakia | ||
| NEOLP: Non-erosive oral lichen planus | ||
| OSCC: Oral squamous cell carcinoma | ||
| Thyroid | 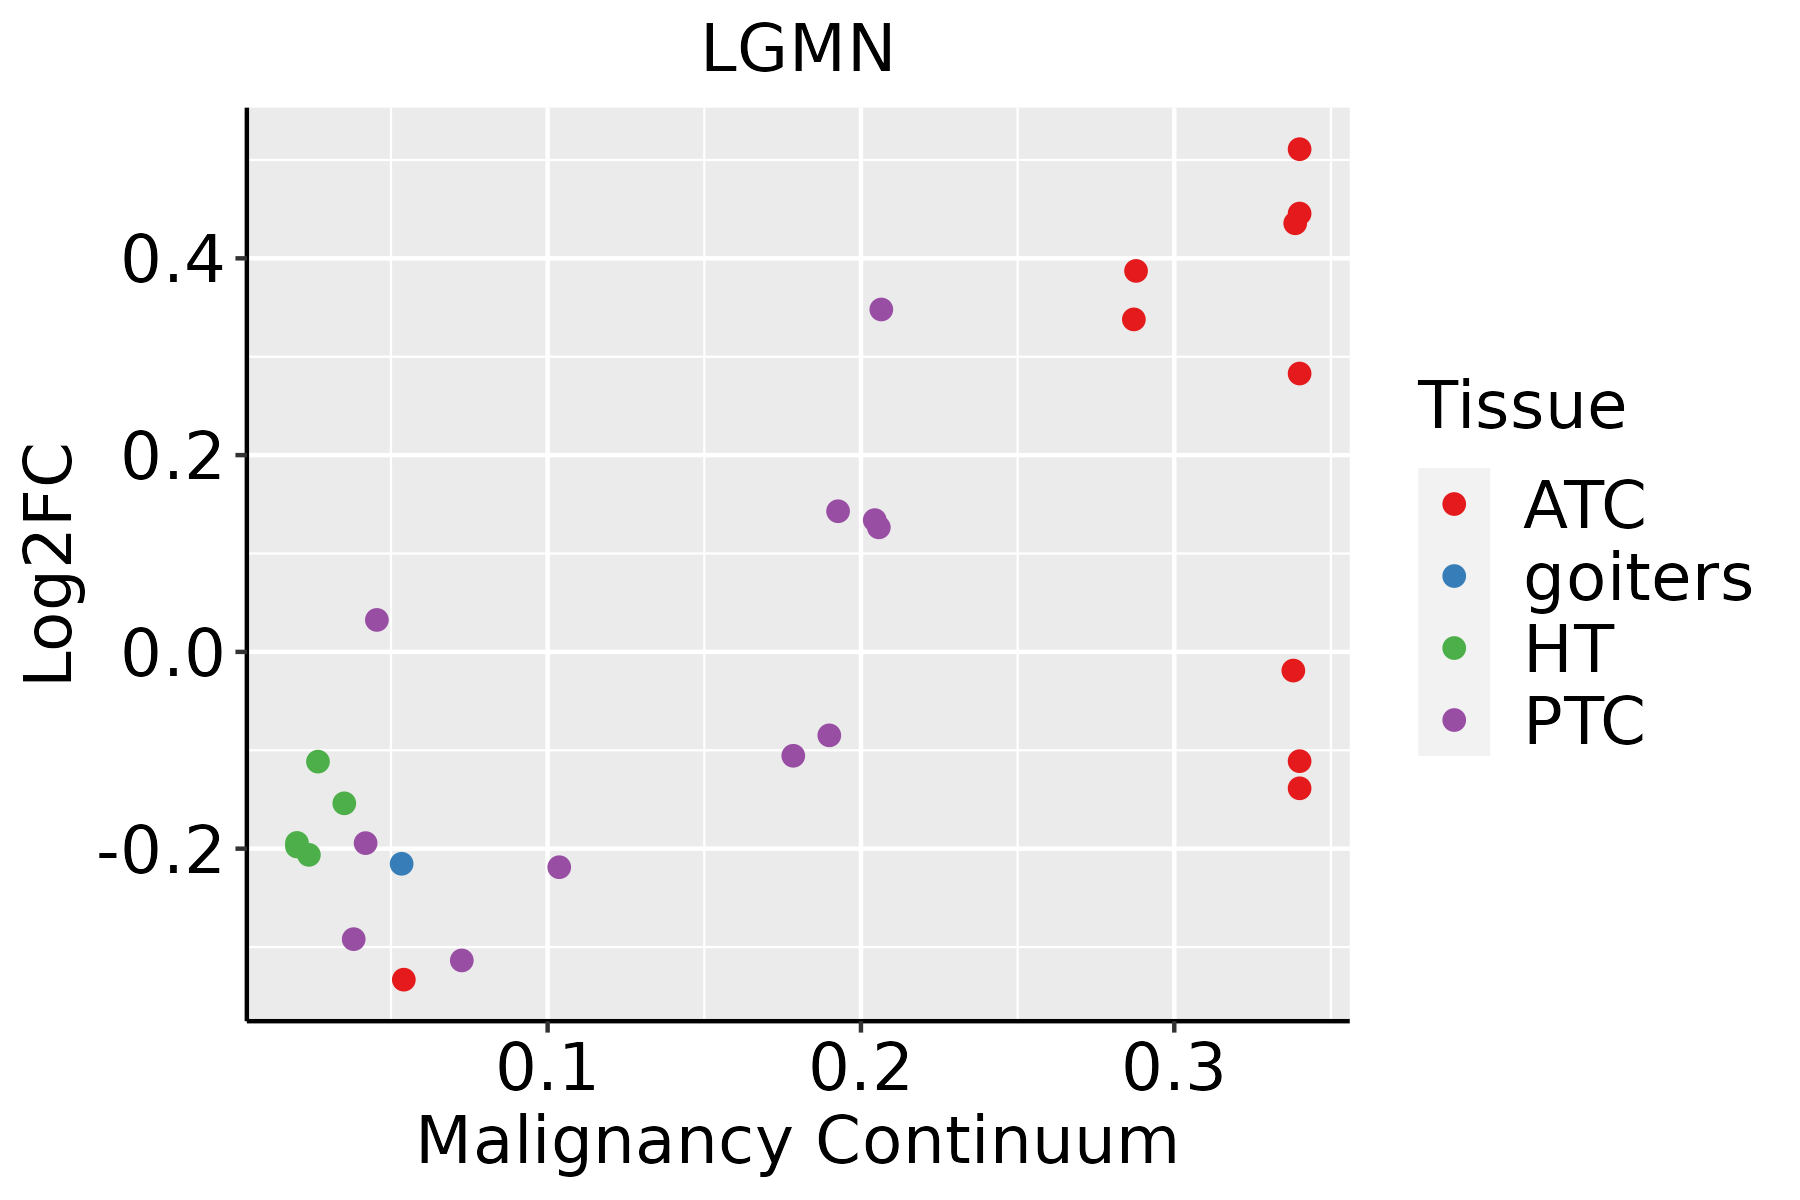 | ATC: Anaplastic thyroid cancer |
| HT: Hashimoto's thyroiditis | ||
| PTC: Papillary thyroid cancer |
| ∗log2FC in expression of this searched gene in stem-like cells from each diseased tissue sample relative to stem-like cells in normal samples in each tissue plotted against the malignancy continuum. Samples are colored based on if they are from different disease stage. |
Top |
Malignant transformation related pathway analysis |
| Find out the enriched GO biological processes and KEGG pathways involved in transition from healthy to precancer to cancer |
| Tissue | Disease Stage | Enriched GO biological Processes |
| Colorectum | AD |  |
| Colorectum | SER |  |
| Colorectum | MSS |  |
| Colorectum | MSI-H |  |
| Colorectum | FAP |  |
| ∗Top 15 enriched GO BP terms are showed in the bar plot of each disease state in each tissue. Each row represents a significant GO biological process which is colored according to the -log10(p.adjust). |
| Page: 1 2 3 4 5 6 7 8 9 |
| GO ID | Tissue | Disease Stage | Description | Gene Ratio | Bg Ratio | pvalue | p.adjust | Count |
| GO:005090010 | Oral cavity | OSCC | leukocyte migration | 176/7305 | 369/18723 | 3.80e-04 | 2.31e-03 | 176 |
| GO:00026908 | Oral cavity | OSCC | positive regulation of leukocyte chemotaxis | 53/7305 | 94/18723 | 4.71e-04 | 2.79e-03 | 53 |
| GO:001988419 | Oral cavity | OSCC | antigen processing and presentation of exogenous antigen | 30/7305 | 47/18723 | 4.96e-04 | 2.92e-03 | 30 |
| GO:19012159 | Oral cavity | OSCC | negative regulation of neuron death | 104/7305 | 208/18723 | 7.90e-04 | 4.27e-03 | 104 |
| GO:007124115 | Oral cavity | OSCC | cellular response to inorganic substance | 111/7305 | 226/18723 | 1.22e-03 | 6.10e-03 | 111 |
| GO:00328014 | Oral cavity | OSCC | receptor catabolic process | 19/7305 | 28/18723 | 1.88e-03 | 8.84e-03 | 19 |
| GO:001063418 | Oral cavity | OSCC | positive regulation of epithelial cell migration | 88/7305 | 176/18723 | 1.91e-03 | 8.94e-03 | 88 |
| GO:00603269 | Oral cavity | OSCC | cell chemotaxis | 146/7305 | 310/18723 | 2.13e-03 | 9.80e-03 | 146 |
| GO:000250410 | Oral cavity | OSCC | antigen processing and presentation of peptide or polysaccharide antigen via MHC class II | 23/7305 | 36/18723 | 2.19e-03 | 9.95e-03 | 23 |
| GO:00716758 | Oral cavity | OSCC | regulation of mononuclear cell migration | 60/7305 | 115/18723 | 2.78e-03 | 1.21e-02 | 60 |
| GO:00972023 | Oral cavity | OSCC | activation of cysteine-type endopeptidase activity | 12/7305 | 16/18723 | 3.83e-03 | 1.57e-02 | 12 |
| GO:00305959 | Oral cavity | OSCC | leukocyte chemotaxis | 110/7305 | 230/18723 | 3.86e-03 | 1.58e-02 | 110 |
| GO:001063218 | Oral cavity | OSCC | regulation of epithelial cell migration | 136/7305 | 292/18723 | 4.82e-03 | 1.92e-02 | 136 |
| GO:000268810 | Oral cavity | OSCC | regulation of leukocyte chemotaxis | 62/7305 | 122/18723 | 5.22e-03 | 2.03e-02 | 62 |
| GO:000249510 | Oral cavity | OSCC | antigen processing and presentation of peptide antigen via MHC class II | 21/7305 | 34/18723 | 6.02e-03 | 2.28e-02 | 21 |
| GO:001988616 | Oral cavity | OSCC | antigen processing and presentation of exogenous peptide antigen via MHC class II | 19/7305 | 30/18723 | 6.03e-03 | 2.28e-02 | 19 |
| GO:00082024 | Oral cavity | OSCC | steroid metabolic process | 146/7305 | 319/18723 | 7.78e-03 | 2.85e-02 | 146 |
| GO:00509204 | Oral cavity | OSCC | regulation of chemotaxis | 105/7305 | 223/18723 | 8.27e-03 | 3.01e-02 | 105 |
| GO:00352646 | Oral cavity | OSCC | multicellular organism growth | 65/7305 | 132/18723 | 1.06e-02 | 3.60e-02 | 65 |
| GO:007124816 | Oral cavity | OSCC | cellular response to metal ion | 93/7305 | 197/18723 | 1.14e-02 | 3.85e-02 | 93 |
| Page: 1 2 3 4 5 6 7 8 9 10 11 12 13 14 15 16 17 18 19 20 21 22 23 24 25 26 27 28 29 |
| Pathway ID | Tissue | Disease Stage | Description | Gene Ratio | Bg Ratio | pvalue | p.adjust | qvalue | Count |
| hsa04142 | Colorectum | SER | Lysosome | 38/1580 | 132/8465 | 2.87e-03 | 2.03e-02 | 1.47e-02 | 38 |
| hsa04612 | Colorectum | SER | Antigen processing and presentation | 25/1580 | 78/8465 | 3.11e-03 | 2.11e-02 | 1.53e-02 | 25 |
| hsa041421 | Colorectum | SER | Lysosome | 38/1580 | 132/8465 | 2.87e-03 | 2.03e-02 | 1.47e-02 | 38 |
| hsa046121 | Colorectum | SER | Antigen processing and presentation | 25/1580 | 78/8465 | 3.11e-03 | 2.11e-02 | 1.53e-02 | 25 |
| hsa046122 | Colorectum | MSS | Antigen processing and presentation | 27/1875 | 78/8465 | 7.72e-03 | 2.91e-02 | 1.78e-02 | 27 |
| hsa046123 | Colorectum | MSS | Antigen processing and presentation | 27/1875 | 78/8465 | 7.72e-03 | 2.91e-02 | 1.78e-02 | 27 |
| hsa046124 | Colorectum | MSI-H | Antigen processing and presentation | 23/797 | 78/8465 | 4.15e-07 | 7.91e-06 | 6.63e-06 | 23 |
| hsa046125 | Colorectum | MSI-H | Antigen processing and presentation | 23/797 | 78/8465 | 4.15e-07 | 7.91e-06 | 6.63e-06 | 23 |
| hsa0414222 | Esophagus | ESCC | Lysosome | 102/4205 | 132/8465 | 5.11e-11 | 7.13e-10 | 3.65e-10 | 102 |
| hsa0461230 | Esophagus | ESCC | Antigen processing and presentation | 51/4205 | 78/8465 | 3.57e-03 | 9.34e-03 | 4.78e-03 | 51 |
| hsa0414232 | Esophagus | ESCC | Lysosome | 102/4205 | 132/8465 | 5.11e-11 | 7.13e-10 | 3.65e-10 | 102 |
| hsa04612114 | Esophagus | ESCC | Antigen processing and presentation | 51/4205 | 78/8465 | 3.57e-03 | 9.34e-03 | 4.78e-03 | 51 |
| hsa041424 | Liver | Cirrhotic | Lysosome | 68/2530 | 132/8465 | 1.34e-07 | 1.97e-06 | 1.21e-06 | 68 |
| hsa0461214 | Liver | Cirrhotic | Antigen processing and presentation | 36/2530 | 78/8465 | 1.69e-03 | 8.01e-03 | 4.94e-03 | 36 |
| hsa0414211 | Liver | Cirrhotic | Lysosome | 68/2530 | 132/8465 | 1.34e-07 | 1.97e-06 | 1.21e-06 | 68 |
| hsa0461215 | Liver | Cirrhotic | Antigen processing and presentation | 36/2530 | 78/8465 | 1.69e-03 | 8.01e-03 | 4.94e-03 | 36 |
| hsa041422 | Liver | HCC | Lysosome | 100/4020 | 132/8465 | 2.32e-11 | 4.31e-10 | 2.40e-10 | 100 |
| hsa041423 | Liver | HCC | Lysosome | 100/4020 | 132/8465 | 2.32e-11 | 4.31e-10 | 2.40e-10 | 100 |
| hsa041425 | Oral cavity | OSCC | Lysosome | 87/3704 | 132/8465 | 1.97e-07 | 1.35e-06 | 6.86e-07 | 87 |
| hsa0461229 | Oral cavity | OSCC | Antigen processing and presentation | 47/3704 | 78/8465 | 2.37e-03 | 6.35e-03 | 3.23e-03 | 47 |
| Page: 1 2 |
Top |
Cell-cell communication analysis |
| Identification of potential cell-cell interactions between two cell types and their ligand-receptor pairs for different disease states |
| Ligand | Receptor | LRpair | Pathway | Tissue | Disease Stage |
| Page: 1 |
Top |
Single-cell gene regulatory network inference analysis |
| Find out the significant the regulons (TFs) and the target genes of each regulon across cell types for different disease states |
| TF | Cell Type | Tissue | Disease Stage | Target Gene | RSS | Regulon Activity |
| ∗The dot plots of a searched regulon are shown for all cell subpopulations in each disease state of each tissue based on the regulon specific score inferred using pySCENIC and by calculating the average expression. |
| Page: 1 |
Top |
Somatic mutation of malignant transformation related genes |
| Annotation of somatic variants for genes involved in malignant transformation |
| Hugo Symbol | Variant Class | Variant Classification | dbSNP RS | HGVSc | HGVSp | HGVSp Short | SWISSPROT | BIOTYPE | SIFT | PolyPhen | Tumor Sample Barcode | Tissue | Histology | Sex | Age | Stage | Therapy Types | Drugs | Outcome |
| LGMN | SNV | Missense_Mutation | novel | c.104N>T | p.Ala35Val | p.A35V | Q99538 | protein_coding | deleterious(0) | probably_damaging(1) | TCGA-D8-A1XQ-01 | Breast | breast invasive carcinoma | Female | >=65 | I/II | Unknown | Unknown | SD |
| LGMN | SNV | Missense_Mutation | rs762702370 | c.421G>A | p.Val141Met | p.V141M | Q99538 | protein_coding | deleterious(0) | probably_damaging(0.993) | TCGA-E2-A150-01 | Breast | breast invasive carcinoma | Female | <65 | I/II | Chemotherapy | doxorubicin | SD |
| LGMN | SNV | Missense_Mutation | rs771834504 | c.779C>T | p.Ser260Leu | p.S260L | Q99538 | protein_coding | tolerated(0.06) | benign(0.08) | TCGA-GM-A2DA-01 | Breast | breast invasive carcinoma | Female | <65 | I/II | Chemotherapy | fluorouracil | PD |
| LGMN | insertion | Nonsense_Mutation | novel | c.730_731insTGTAAATCATATAGGACTTCTTTGGTATCTGCTGCAA | p.Glu244ValfsTer2 | p.E244Vfs*2 | Q99538 | protein_coding | TCGA-AO-A0JB-01 | Breast | breast invasive carcinoma | Female | <65 | III/IV | Chemotherapy | cyclophosphamide | SD | ||
| LGMN | SNV | Missense_Mutation | novel | c.131N>T | p.Arg44Met | p.R44M | Q99538 | protein_coding | deleterious(0) | probably_damaging(1) | TCGA-2W-A8YY-01 | Cervix | cervical & endocervical cancer | Female | <65 | I/II | Chemotherapy | cisplatin | CR |
| LGMN | SNV | Missense_Mutation | novel | c.945G>A | p.Met315Ile | p.M315I | Q99538 | protein_coding | deleterious(0.01) | benign(0.033) | TCGA-VS-A958-01 | Cervix | cervical & endocervical cancer | Female | <65 | I/II | Chemotherapy | cisplatin | CR |
| LGMN | SNV | Missense_Mutation | novel | c.536A>G | p.Tyr179Cys | p.Y179C | Q99538 | protein_coding | deleterious(0) | probably_damaging(0.998) | TCGA-AA-3947-01 | Colorectum | colon adenocarcinoma | Female | <65 | I/II | Unknown | Unknown | SD |
| LGMN | SNV | Missense_Mutation | novel | c.478N>A | p.Asp160Asn | p.D160N | Q99538 | protein_coding | tolerated(0.12) | benign(0.127) | TCGA-AA-3984-01 | Colorectum | colon adenocarcinoma | Female | <65 | I/II | Unknown | Unknown | SD |
| LGMN | SNV | Missense_Mutation | c.591C>A | p.His197Gln | p.H197Q | Q99538 | protein_coding | tolerated(0.52) | possibly_damaging(0.449) | TCGA-AA-3989-01 | Colorectum | colon adenocarcinoma | Male | >=65 | III/IV | Unknown | Unknown | PD | |
| LGMN | SNV | Missense_Mutation | c.1264A>C | p.Lys422Gln | p.K422Q | Q99538 | protein_coding | tolerated(0.44) | benign(0.005) | TCGA-AG-A002-01 | Colorectum | rectum adenocarcinoma | Male | <65 | I/II | Unknown | Unknown | SD |
| Page: 1 2 3 4 5 6 |
Top |
Related drugs of malignant transformation related genes |
| Identification of chemicals and drugs interact with genes involved in malignant transfromation |
| (DGIdb 4.0) |
| Entrez ID | Symbol | Category | Interaction Types | Drug Claim Name | Drug Name | PMIDs |
| 5641 | LGMN | ENZYME, DRUGGABLE GENOME, PROTEASE | inhibitor | 252166833 | ||
| 5641 | LGMN | ENZYME, DRUGGABLE GENOME, PROTEASE | Legumain-cleavable doxorubicin prodrugs |
| Page: 1 |

Copyright 2023-Present -The University of Texas Health Science Center at Houston |