
|
|||||
|
 | |
| |
| |
| |
| |
| |
|
Gene: IFNG |
Gene summary for IFNG |
| Gene information | Species | Human | Gene symbol | IFNG | Gene ID | 3458 |
| Gene name | interferon gamma | |
| Gene Alias | IFG | |
| Cytomap | 12q15 | |
| Gene Type | protein-coding | GO ID | GO:0000041 | UniProtAcc | P01579 |
Top |
Malignant transformation analysis |
| Identification of the aberrant gene expression in precancerous and cancerous lesions by comparing the gene expression of stem-like cells in diseased tissues with normal stem cells |
| Entrez ID | Symbol | Replicates | Species | Organ | Tissue | Adj P-value | Log2FC | Malignancy |
| 3458 | IFNG | LZE4T | Human | Esophagus | ESCC | 1.47e-07 | 7.07e-01 | 0.0811 |
| 3458 | IFNG | LZE6T | Human | Esophagus | ESCC | 1.87e-12 | 1.66e+00 | 0.0845 |
| Page: 1 |
| Tissue | Expression Dynamics | Abbreviation |
| Esophagus | 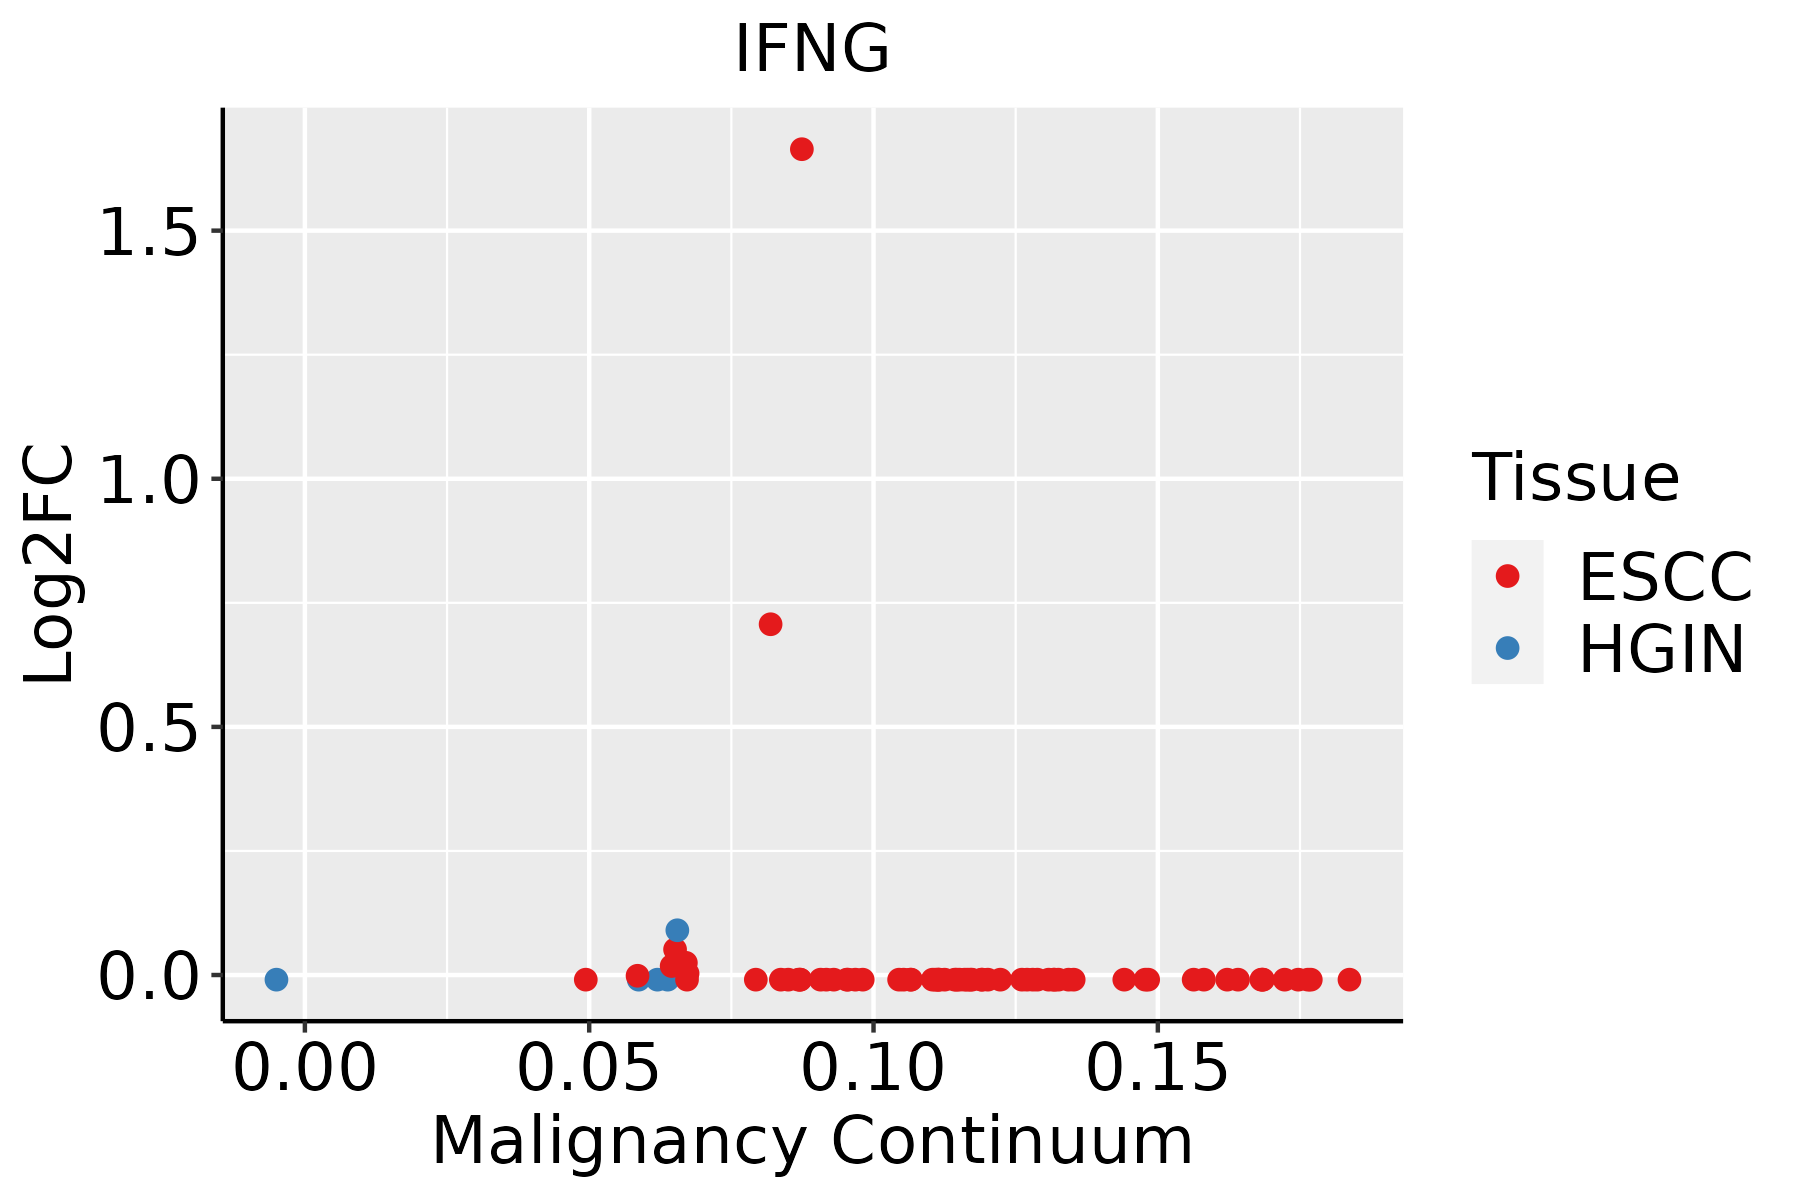 | ESCC: Esophageal squamous cell carcinoma |
| HGIN: High-grade intraepithelial neoplasias | ||
| LGIN: Low-grade intraepithelial neoplasias |
| ∗log2FC in expression of this searched gene in stem-like cells from each diseased tissue sample relative to stem-like cells in normal samples in each tissue plotted against the malignancy continuum. Samples are colored based on if they are from different disease stage. |
Top |
Malignant transformation related pathway analysis |
| Find out the enriched GO biological processes and KEGG pathways involved in transition from healthy to precancer to cancer |
| Tissue | Disease Stage | Enriched GO biological Processes |
| Colorectum | AD |  |
| Colorectum | SER |  |
| Colorectum | MSS |  |
| Colorectum | MSI-H |  |
| Colorectum | FAP |  |
| ∗Top 15 enriched GO BP terms are showed in the bar plot of each disease state in each tissue. Each row represents a significant GO biological process which is colored according to the -log10(p.adjust). |
| Page: 1 2 3 4 5 6 7 8 9 |
| GO ID | Tissue | Disease Stage | Description | Gene Ratio | Bg Ratio | pvalue | p.adjust | Count |
| GO:003425026 | Skin | cSCC | positive regulation of cellular amide metabolic process | 89/4864 | 162/18723 | 3.95e-15 | 3.06e-13 | 89 |
| GO:000961522 | Skin | cSCC | response to virus | 152/4864 | 367/18723 | 5.88e-11 | 2.75e-09 | 152 |
| GO:00516076 | Skin | cSCC | defense response to virus | 107/4864 | 265/18723 | 1.84e-07 | 4.02e-06 | 107 |
| GO:01405466 | Skin | cSCC | defense response to symbiont | 107/4864 | 265/18723 | 1.84e-07 | 4.02e-06 | 107 |
| GO:003434115 | Skin | cSCC | response to interferon-gamma | 57/4864 | 141/18723 | 1.20e-04 | 1.11e-03 | 57 |
| GO:007134613 | Skin | cSCC | cellular response to interferon-gamma | 47/4864 | 118/18723 | 6.71e-04 | 4.79e-03 | 47 |
| GO:004206322 | Skin | cSCC | gliogenesis | 103/4864 | 301/18723 | 8.48e-04 | 5.85e-03 | 103 |
| GO:00603337 | Skin | cSCC | interferon-gamma-mediated signaling pathway | 15/4864 | 27/18723 | 1.03e-03 | 6.94e-03 | 15 |
| GO:001000122 | Skin | cSCC | glial cell differentiation | 78/4864 | 225/18723 | 2.27e-03 | 1.33e-02 | 78 |
| GO:004298713 | Skin | cSCC | amyloid precursor protein catabolic process | 27/4864 | 68/18723 | 9.07e-03 | 4.16e-02 | 27 |
| GO:0034250113 | Thyroid | PTC | positive regulation of cellular amide metabolic process | 98/5968 | 162/18723 | 5.26e-14 | 3.04e-12 | 98 |
| GO:000961520 | Thyroid | PTC | response to virus | 162/5968 | 367/18723 | 4.52e-07 | 7.41e-06 | 162 |
| GO:00603338 | Thyroid | PTC | interferon-gamma-mediated signaling pathway | 17/5968 | 27/18723 | 8.67e-04 | 5.30e-03 | 17 |
| GO:004206315 | Thyroid | PTC | gliogenesis | 121/5968 | 301/18723 | 1.30e-03 | 7.41e-03 | 121 |
| GO:00516077 | Thyroid | PTC | defense response to virus | 108/5968 | 265/18723 | 1.34e-03 | 7.55e-03 | 108 |
| GO:01405467 | Thyroid | PTC | defense response to symbiont | 108/5968 | 265/18723 | 1.34e-03 | 7.55e-03 | 108 |
| GO:003420511 | Thyroid | PTC | amyloid-beta formation | 29/5968 | 57/18723 | 2.18e-03 | 1.15e-02 | 29 |
| GO:009724213 | Thyroid | PTC | amyloid-beta clearance | 21/5968 | 38/18723 | 2.38e-03 | 1.25e-02 | 21 |
| GO:005043511 | Thyroid | PTC | amyloid-beta metabolic process | 32/5968 | 67/18723 | 4.75e-03 | 2.22e-02 | 32 |
| GO:003434110 | Thyroid | PTC | response to interferon-gamma | 59/5968 | 141/18723 | 7.88e-03 | 3.33e-02 | 59 |
| Page: 1 2 3 4 5 6 7 8 9 10 11 12 13 14 15 16 17 |
| Pathway ID | Tissue | Disease Stage | Description | Gene Ratio | Bg Ratio | pvalue | p.adjust | qvalue | Count |
| hsa05418211 | Esophagus | ESCC | Fluid shear stress and atherosclerosis | 109/4205 | 139/8465 | 2.00e-12 | 3.72e-11 | 1.90e-11 | 109 |
| hsa0305028 | Esophagus | ESCC | Proteasome | 44/4205 | 46/8465 | 1.05e-11 | 1.60e-10 | 8.21e-11 | 44 |
| hsa0516425 | Esophagus | ESCC | Influenza A | 122/4205 | 171/8465 | 5.01e-09 | 4.79e-08 | 2.45e-08 | 122 |
| hsa051609 | Esophagus | ESCC | Hepatitis C | 107/4205 | 157/8465 | 1.75e-06 | 1.08e-05 | 5.55e-06 | 107 |
| hsa0406629 | Esophagus | ESCC | HIF-1 signaling pathway | 75/4205 | 109/8465 | 3.66e-05 | 1.68e-04 | 8.60e-05 | 75 |
| hsa0465727 | Esophagus | ESCC | IL-17 signaling pathway | 66/4205 | 94/8465 | 3.93e-05 | 1.75e-04 | 8.99e-05 | 66 |
| hsa0514525 | Esophagus | ESCC | Toxoplasmosis | 76/4205 | 112/8465 | 6.83e-05 | 2.90e-04 | 1.48e-04 | 76 |
| hsa051527 | Esophagus | ESCC | Tuberculosis | 111/4205 | 180/8465 | 7.14e-04 | 2.32e-03 | 1.19e-03 | 111 |
| hsa043507 | Esophagus | ESCC | TGF-beta signaling pathway | 69/4205 | 108/8465 | 1.92e-03 | 5.54e-03 | 2.84e-03 | 69 |
| hsa052356 | Esophagus | ESCC | PD-L1 expression and PD-1 checkpoint pathway in cancer | 58/4205 | 89/8465 | 2.19e-03 | 6.16e-03 | 3.16e-03 | 58 |
| hsa051425 | Esophagus | ESCC | Chagas disease | 65/4205 | 102/8465 | 2.81e-03 | 7.59e-03 | 3.89e-03 | 65 |
| hsa046599 | Esophagus | ESCC | Th17 cell differentiation | 68/4205 | 108/8465 | 3.53e-03 | 9.30e-03 | 4.76e-03 | 68 |
| hsa0461230 | Esophagus | ESCC | Antigen processing and presentation | 51/4205 | 78/8465 | 3.57e-03 | 9.34e-03 | 4.78e-03 | 51 |
| hsa0532320 | Esophagus | ESCC | Rheumatoid arthritis | 59/4205 | 93/8465 | 4.98e-03 | 1.27e-02 | 6.52e-03 | 59 |
| hsa046585 | Esophagus | ESCC | Th1 and Th2 cell differentiation | 58/4205 | 92/8465 | 6.49e-03 | 1.60e-02 | 8.19e-03 | 58 |
| hsa046607 | Esophagus | ESCC | T cell receptor signaling pathway | 63/4205 | 104/8465 | 1.60e-02 | 3.60e-02 | 1.84e-02 | 63 |
| hsa05418310 | Esophagus | ESCC | Fluid shear stress and atherosclerosis | 109/4205 | 139/8465 | 2.00e-12 | 3.72e-11 | 1.90e-11 | 109 |
| hsa0305037 | Esophagus | ESCC | Proteasome | 44/4205 | 46/8465 | 1.05e-11 | 1.60e-10 | 8.21e-11 | 44 |
| hsa0516435 | Esophagus | ESCC | Influenza A | 122/4205 | 171/8465 | 5.01e-09 | 4.79e-08 | 2.45e-08 | 122 |
| hsa0516016 | Esophagus | ESCC | Hepatitis C | 107/4205 | 157/8465 | 1.75e-06 | 1.08e-05 | 5.55e-06 | 107 |
| Page: 1 2 |
Top |
Cell-cell communication analysis |
| Identification of potential cell-cell interactions between two cell types and their ligand-receptor pairs for different disease states |
| Ligand | Receptor | LRpair | Pathway | Tissue | Disease Stage |
| IFNG | IFNGR1_IFNGR2 | IFNG_IFNGR1_IFNGR2 | IFN-II | Breast | DCIS |
| IFNG | IFNGR1_IFNGR2 | IFNG_IFNGR1_IFNGR2 | IFN-II | Breast | Healthy |
| IFNG | IFNGR1_IFNGR2 | IFNG_IFNGR1_IFNGR2 | IFN-II | Breast | IDC |
| IFNG | IFNGR1_IFNGR2 | IFNG_IFNGR1_IFNGR2 | IFN-II | Cervix | ADJ |
| IFNG | IFNGR1_IFNGR2 | IFNG_IFNGR1_IFNGR2 | IFN-II | Cervix | CC |
| IFNG | IFNGR1_IFNGR2 | IFNG_IFNGR1_IFNGR2 | IFN-II | Cervix | Healthy |
| IFNG | IFNGR1_IFNGR2 | IFNG_IFNGR1_IFNGR2 | IFN-II | Cervix | Precancer |
| IFNG | IFNGR1_IFNGR2 | IFNG_IFNGR1_IFNGR2 | IFN-II | Endometrium | ADJ |
| IFNG | IFNGR1_IFNGR2 | IFNG_IFNGR1_IFNGR2 | IFN-II | Endometrium | AEH |
| IFNG | IFNGR1_IFNGR2 | IFNG_IFNGR1_IFNGR2 | IFN-II | Endometrium | EEC |
| IFNG | IFNGR1_IFNGR2 | IFNG_IFNGR1_IFNGR2 | IFN-II | Endometrium | Healthy |
| IFNG | IFNGR1_IFNGR2 | IFNG_IFNGR1_IFNGR2 | IFN-II | GC | ADJ |
| IFNG | IFNGR1_IFNGR2 | IFNG_IFNGR1_IFNGR2 | IFN-II | GC | GC |
| IFNG | IFNGR1_IFNGR2 | IFNG_IFNGR1_IFNGR2 | IFN-II | HNSCC | ADJ |
| IFNG | IFNGR1_IFNGR2 | IFNG_IFNGR1_IFNGR2 | IFN-II | HNSCC | Healthy |
| IFNG | IFNGR1_IFNGR2 | IFNG_IFNGR1_IFNGR2 | IFN-II | HNSCC | OSCC |
| IFNG | IFNGR1_IFNGR2 | IFNG_IFNGR1_IFNGR2 | IFN-II | HNSCC | Precancer |
| IFNG | IFNGR1_IFNGR2 | IFNG_IFNGR1_IFNGR2 | IFN-II | Liver | Healthy |
| IFNG | IFNGR1_IFNGR2 | IFNG_IFNGR1_IFNGR2 | IFN-II | Liver | Precancer |
| IFNG | IFNGR1_IFNGR2 | IFNG_IFNGR1_IFNGR2 | IFN-II | Lung | AAH |
| Page: 1 2 |
Top |
Single-cell gene regulatory network inference analysis |
| Find out the significant the regulons (TFs) and the target genes of each regulon across cell types for different disease states |
| TF | Cell Type | Tissue | Disease Stage | Target Gene | RSS | Regulon Activity |
| ∗The dot plots of a searched regulon are shown for all cell subpopulations in each disease state of each tissue based on the regulon specific score inferred using pySCENIC and by calculating the average expression. |
| Page: 1 |
Top |
Somatic mutation of malignant transformation related genes |
| Annotation of somatic variants for genes involved in malignant transformation |
| Hugo Symbol | Variant Class | Variant Classification | dbSNP RS | HGVSc | HGVSp | HGVSp Short | SWISSPROT | BIOTYPE | SIFT | PolyPhen | Tumor Sample Barcode | Tissue | Histology | Sex | Age | Stage | Therapy Types | Drugs | Outcome |
| IFNG | SNV | Missense_Mutation | c.324C>G | p.Asn108Lys | p.N108K | P01579 | protein_coding | deleterious(0.02) | benign(0.342) | TCGA-A7-A26F-01 | Breast | breast invasive carcinoma | Female | <65 | I/II | Chemotherapy | taxotere | SD | |
| IFNG | SNV | Missense_Mutation | rs755519988 | c.388N>T | p.Arg130Cys | p.R130C | P01579 | protein_coding | deleterious(0) | probably_damaging(0.995) | TCGA-E2-A1LH-01 | Breast | breast invasive carcinoma | Female | <65 | I/II | Chemotherapy | adriamycin | SD |
| IFNG | SNV | Missense_Mutation | c.31N>G | p.Gln11Glu | p.Q11E | P01579 | protein_coding | deleterious(0.02) | possibly_damaging(0.732) | TCGA-C5-A2LS-01 | Cervix | cervical & endocervical cancer | Female | <65 | I/II | Unknown | Unknown | SD | |
| IFNG | SNV | Missense_Mutation | c.365C>T | p.Ser122Leu | p.S122L | P01579 | protein_coding | deleterious(0.01) | possibly_damaging(0.617) | TCGA-A6-6654-01 | Colorectum | colon adenocarcinoma | Female | >=65 | III/IV | Chemotherapy | oxaliplatin | SD | |
| IFNG | SNV | Missense_Mutation | c.105N>T | p.Lys35Asn | p.K35N | P01579 | protein_coding | deleterious(0.04) | possibly_damaging(0.843) | TCGA-AA-3977-01 | Colorectum | colon adenocarcinoma | Male | >=65 | I/II | Unknown | Unknown | SD | |
| IFNG | SNV | Missense_Mutation | c.256N>T | p.Asp86Tyr | p.D86Y | P01579 | protein_coding | deleterious(0) | benign(0.187) | TCGA-D5-5539-01 | Colorectum | colon adenocarcinoma | Male | <65 | III/IV | Chemotherapy | 5-fu | PD | |
| IFNG | SNV | Missense_Mutation | rs201359065 | c.479G>A | p.Arg160Gln | p.R160Q | P01579 | protein_coding | tolerated(0.23) | benign(0.015) | TCGA-A5-A0G2-01 | Endometrium | uterine corpus endometrioid carcinoma | Female | <65 | III/IV | Unknown | Unknown | SD |
| IFNG | SNV | Missense_Mutation | novel | c.121G>T | p.Gly41Cys | p.G41C | P01579 | protein_coding | deleterious(0) | benign(0.238) | TCGA-A5-A0G2-01 | Endometrium | uterine corpus endometrioid carcinoma | Female | <65 | III/IV | Unknown | Unknown | SD |
| IFNG | SNV | Missense_Mutation | c.263G>A | p.Ser88Asn | p.S88N | P01579 | protein_coding | tolerated(0.5) | benign(0) | TCGA-A5-A0GP-01 | Endometrium | uterine corpus endometrioid carcinoma | Female | <65 | I/II | Unknown | Unknown | SD | |
| IFNG | SNV | Missense_Mutation | novel | c.291N>T | p.Lys97Asn | p.K97N | P01579 | protein_coding | tolerated(0.06) | probably_damaging(0.91) | TCGA-AJ-A3EL-01 | Endometrium | uterine corpus endometrioid carcinoma | Female | <65 | I/II | Unknown | Unknown | SD |
| Page: 1 2 3 4 |
Top |
Related drugs of malignant transformation related genes |
| Identification of chemicals and drugs interact with genes involved in malignant transfromation |
| (DGIdb 4.0) |
| Entrez ID | Symbol | Category | Interaction Types | Drug Claim Name | Drug Name | PMIDs |
| 3458 | IFNG | DRUGGABLE GENOME | CYCLOPHOSPHAMIDE | CYCLOPHOSPHAMIDE | 10823419 | |
| 3458 | IFNG | DRUGGABLE GENOME | CIGB-128 | |||
| 3458 | IFNG | DRUGGABLE GENOME | Emapalumab | EMAPALUMAB | ||
| 3458 | IFNG | DRUGGABLE GENOME | METHYLPREDNISOLONE | METHYLPREDNISOLONE | 9396353 | |
| 3458 | IFNG | DRUGGABLE GENOME | PEFLOXACIN | PEFLOXACIN | 8673851 | |
| 3458 | IFNG | DRUGGABLE GENOME | SURAMIN | SURAMIN | 1899122 | |
| 3458 | IFNG | DRUGGABLE GENOME | MONOCLONAL ANTIBODY 17-1A | 2121912 | ||
| 3458 | IFNG | DRUGGABLE GENOME | BLEOMYCIN | BLEOMYCIN | 8556994 | |
| 3458 | IFNG | DRUGGABLE GENOME | CISPLATIN | CISPLATIN | 8044830 | |
| 3458 | IFNG | DRUGGABLE GENOME | MELATONIN | MELATONIN | 7722866 |
| Page: 1 2 3 4 |

Copyright 2023-Present -The University of Texas Health Science Center at Houston |