
|
|||||
|
 | |
| |
| |
| |
| |
| |
|
Gene: EXOSC4 |
Gene summary for EXOSC4 |
| Gene information | Species | Human | Gene symbol | EXOSC4 | Gene ID | 54512 |
| Gene name | exosome component 4 | |
| Gene Alias | RRP41 | |
| Cytomap | 8q24.3 | |
| Gene Type | protein-coding | GO ID | GO:0000291 | UniProtAcc | Q9NPD3 |
Top |
Malignant transformation analysis |
| Identification of the aberrant gene expression in precancerous and cancerous lesions by comparing the gene expression of stem-like cells in diseased tissues with normal stem cells |
| Entrez ID | Symbol | Replicates | Species | Organ | Tissue | Adj P-value | Log2FC | Malignancy |
| 54512 | EXOSC4 | LZE4T | Human | Esophagus | ESCC | 4.27e-14 | 3.56e-01 | 0.0811 |
| 54512 | EXOSC4 | LZE5T | Human | Esophagus | ESCC | 3.40e-04 | 3.24e-01 | 0.0514 |
| 54512 | EXOSC4 | LZE7T | Human | Esophagus | ESCC | 1.25e-12 | 7.36e-01 | 0.0667 |
| 54512 | EXOSC4 | LZE8T | Human | Esophagus | ESCC | 1.59e-06 | 3.58e-01 | 0.067 |
| 54512 | EXOSC4 | LZE20T | Human | Esophagus | ESCC | 6.56e-14 | 5.07e-01 | 0.0662 |
| 54512 | EXOSC4 | LZE22D1 | Human | Esophagus | HGIN | 3.10e-02 | -2.32e-02 | 0.0595 |
| 54512 | EXOSC4 | LZE22T | Human | Esophagus | ESCC | 2.76e-07 | 2.99e-01 | 0.068 |
| 54512 | EXOSC4 | LZE24T | Human | Esophagus | ESCC | 7.70e-24 | 8.53e-01 | 0.0596 |
| 54512 | EXOSC4 | LZE21T | Human | Esophagus | ESCC | 8.25e-07 | 5.92e-01 | 0.0655 |
| 54512 | EXOSC4 | LZE6T | Human | Esophagus | ESCC | 1.55e-02 | 4.84e-01 | 0.0845 |
| 54512 | EXOSC4 | P1T-E | Human | Esophagus | ESCC | 9.88e-12 | 5.03e-01 | 0.0875 |
| 54512 | EXOSC4 | P2T-E | Human | Esophagus | ESCC | 7.33e-48 | 9.44e-01 | 0.1177 |
| 54512 | EXOSC4 | P4T-E | Human | Esophagus | ESCC | 1.19e-47 | 1.30e+00 | 0.1323 |
| 54512 | EXOSC4 | P5T-E | Human | Esophagus | ESCC | 5.32e-49 | 1.14e+00 | 0.1327 |
| 54512 | EXOSC4 | P8T-E | Human | Esophagus | ESCC | 2.06e-14 | 3.26e-01 | 0.0889 |
| 54512 | EXOSC4 | P9T-E | Human | Esophagus | ESCC | 6.17e-42 | 1.19e+00 | 0.1131 |
| 54512 | EXOSC4 | P10T-E | Human | Esophagus | ESCC | 4.48e-29 | 5.34e-01 | 0.116 |
| 54512 | EXOSC4 | P11T-E | Human | Esophagus | ESCC | 3.32e-14 | 8.25e-01 | 0.1426 |
| 54512 | EXOSC4 | P12T-E | Human | Esophagus | ESCC | 8.59e-57 | 1.30e+00 | 0.1122 |
| 54512 | EXOSC4 | P15T-E | Human | Esophagus | ESCC | 8.46e-40 | 9.20e-01 | 0.1149 |
| Page: 1 2 3 4 5 6 7 |
| Tissue | Expression Dynamics | Abbreviation |
| Esophagus | 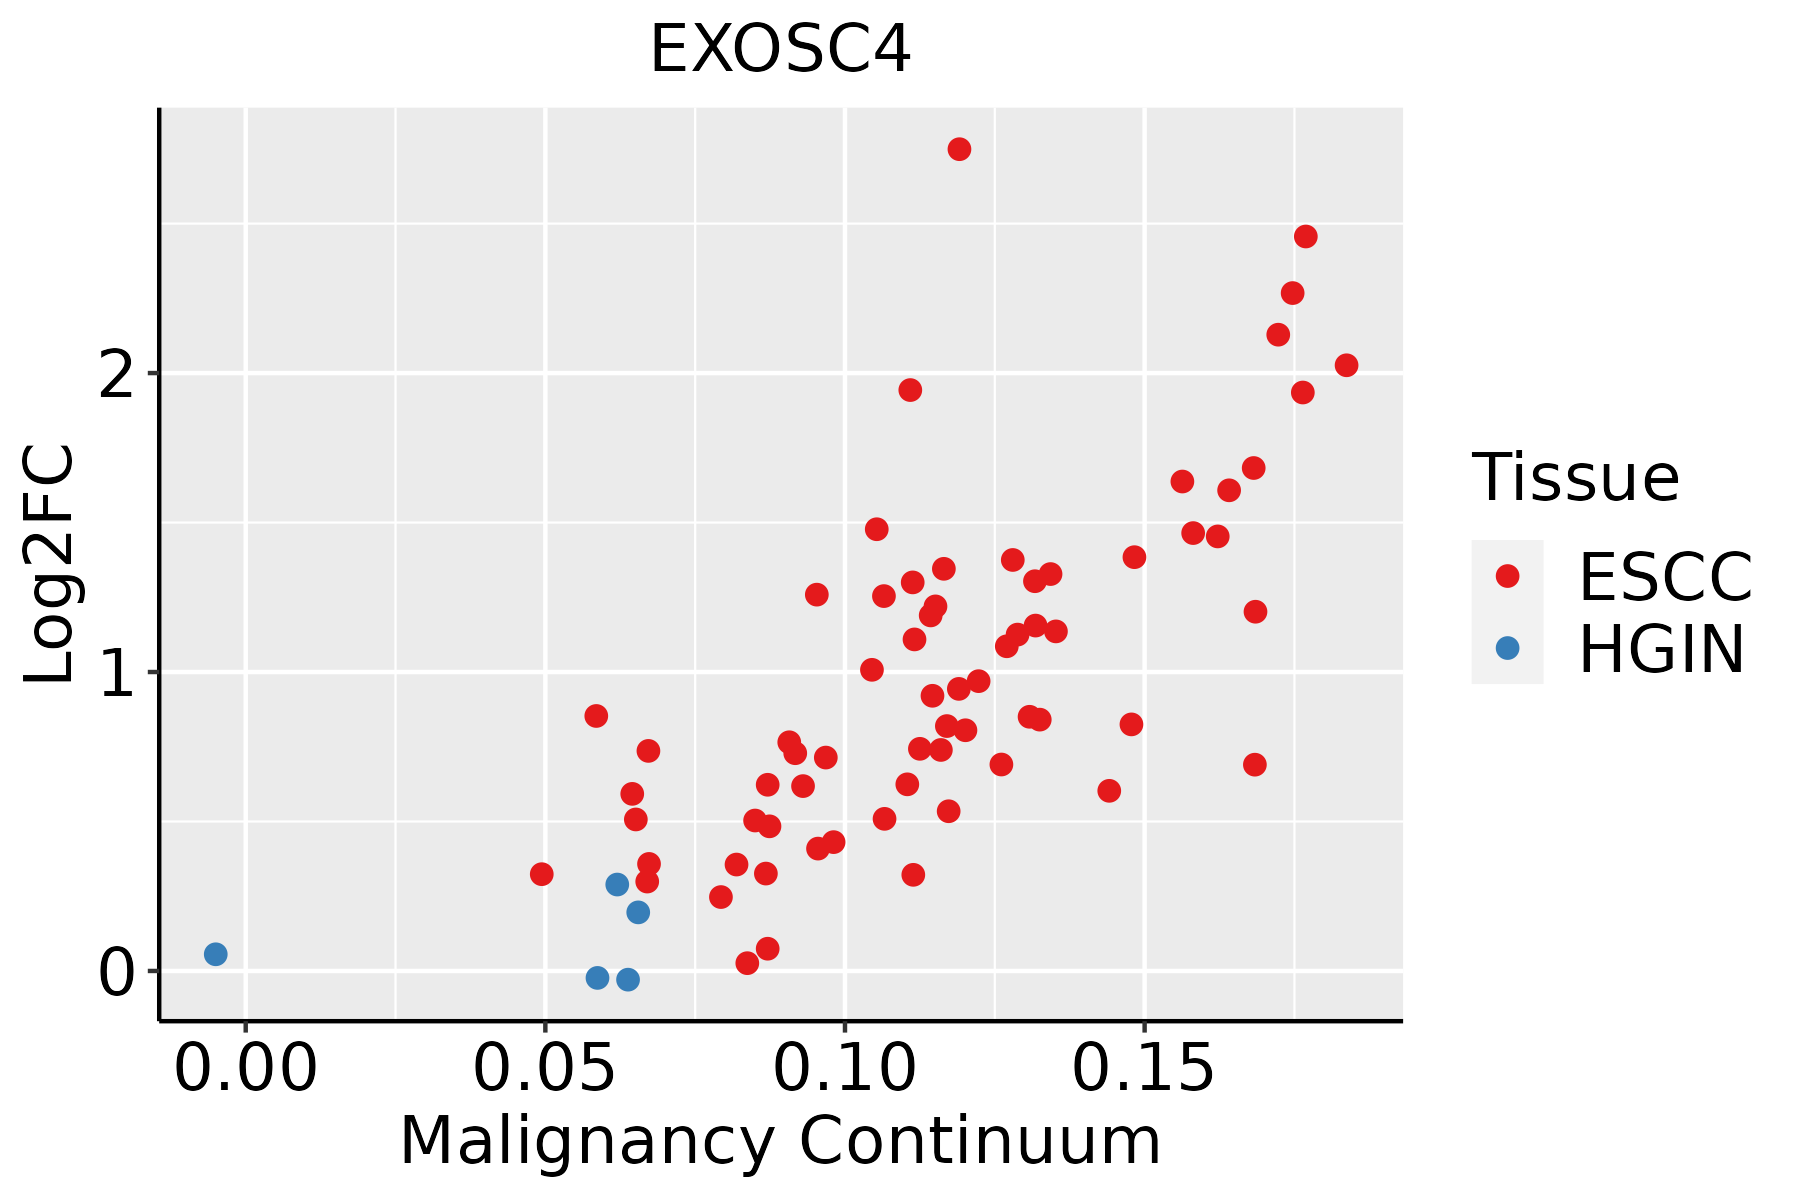 | ESCC: Esophageal squamous cell carcinoma |
| HGIN: High-grade intraepithelial neoplasias | ||
| LGIN: Low-grade intraepithelial neoplasias | ||
| Liver | 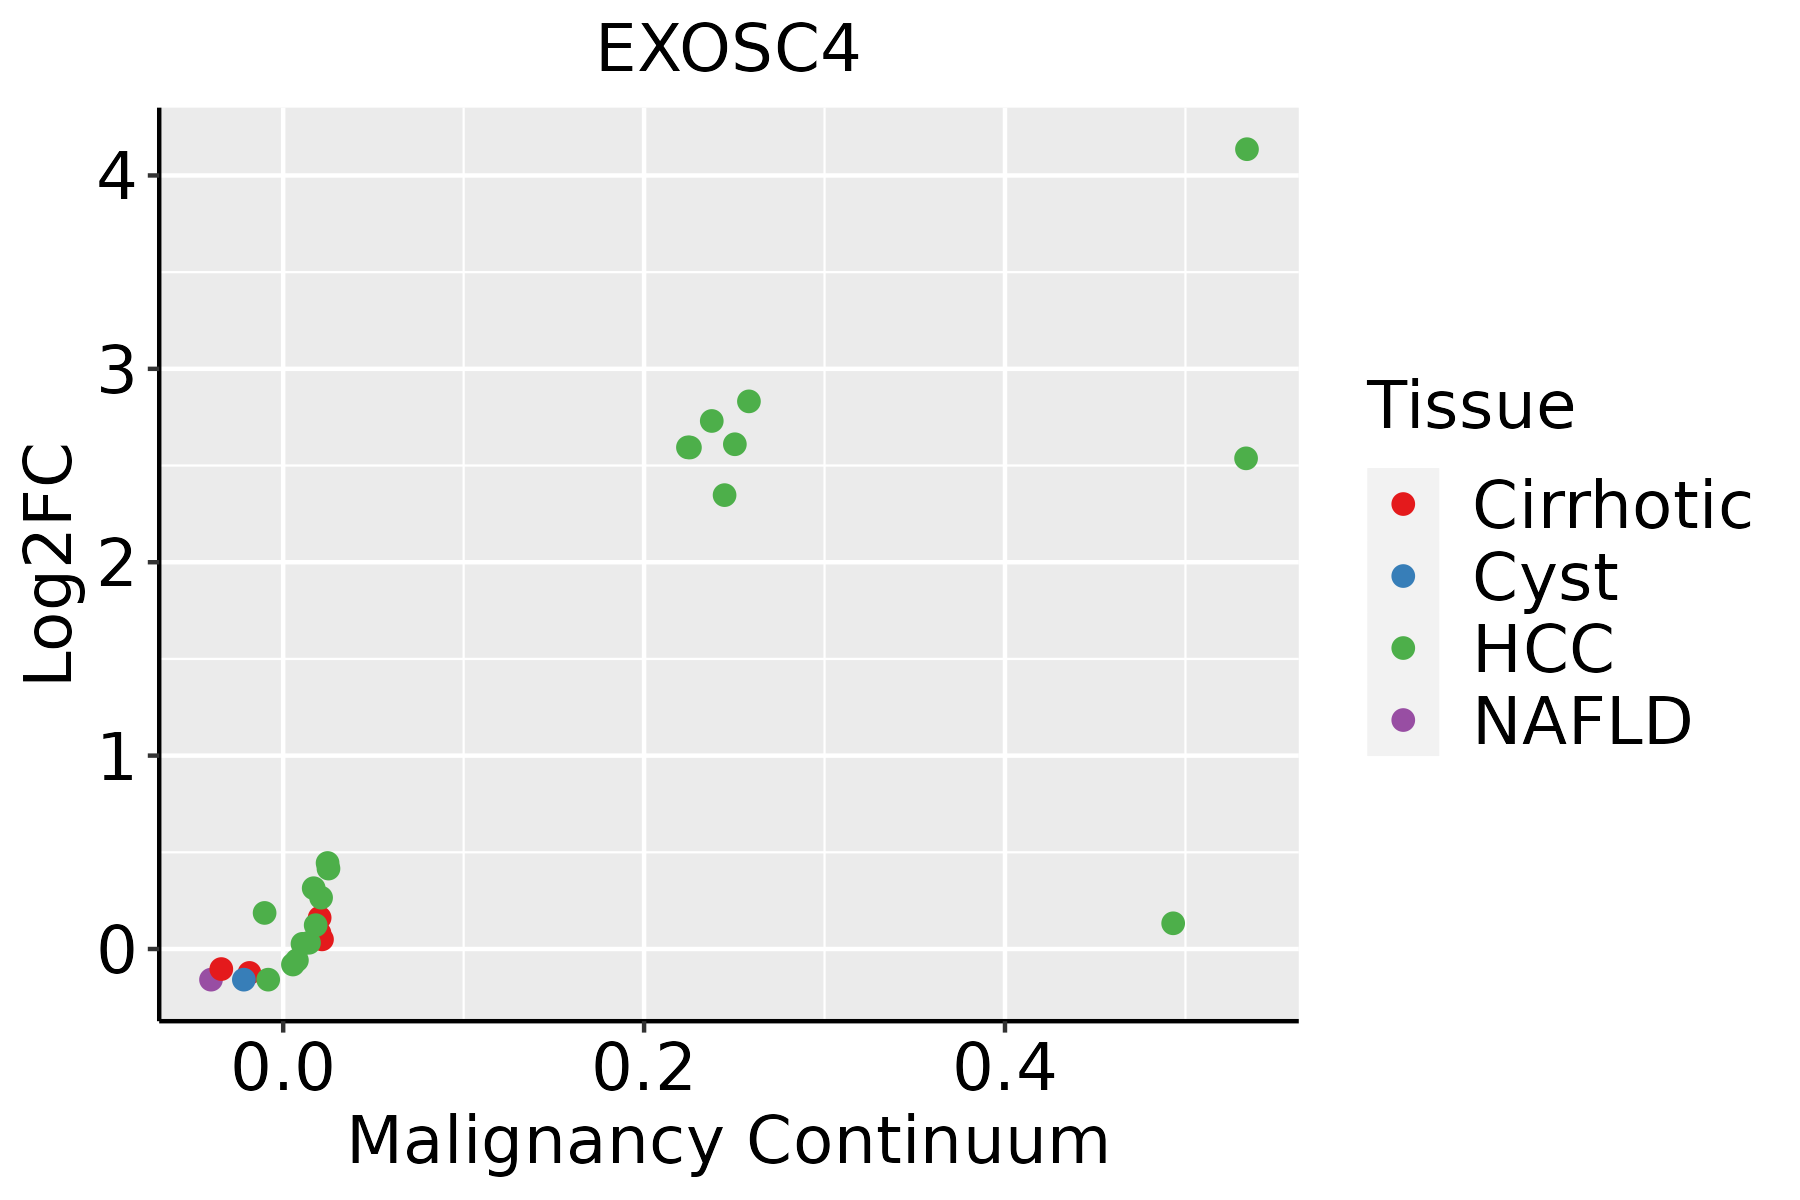 | HCC: Hepatocellular carcinoma |
| NAFLD: Non-alcoholic fatty liver disease | ||
| Oral Cavity | 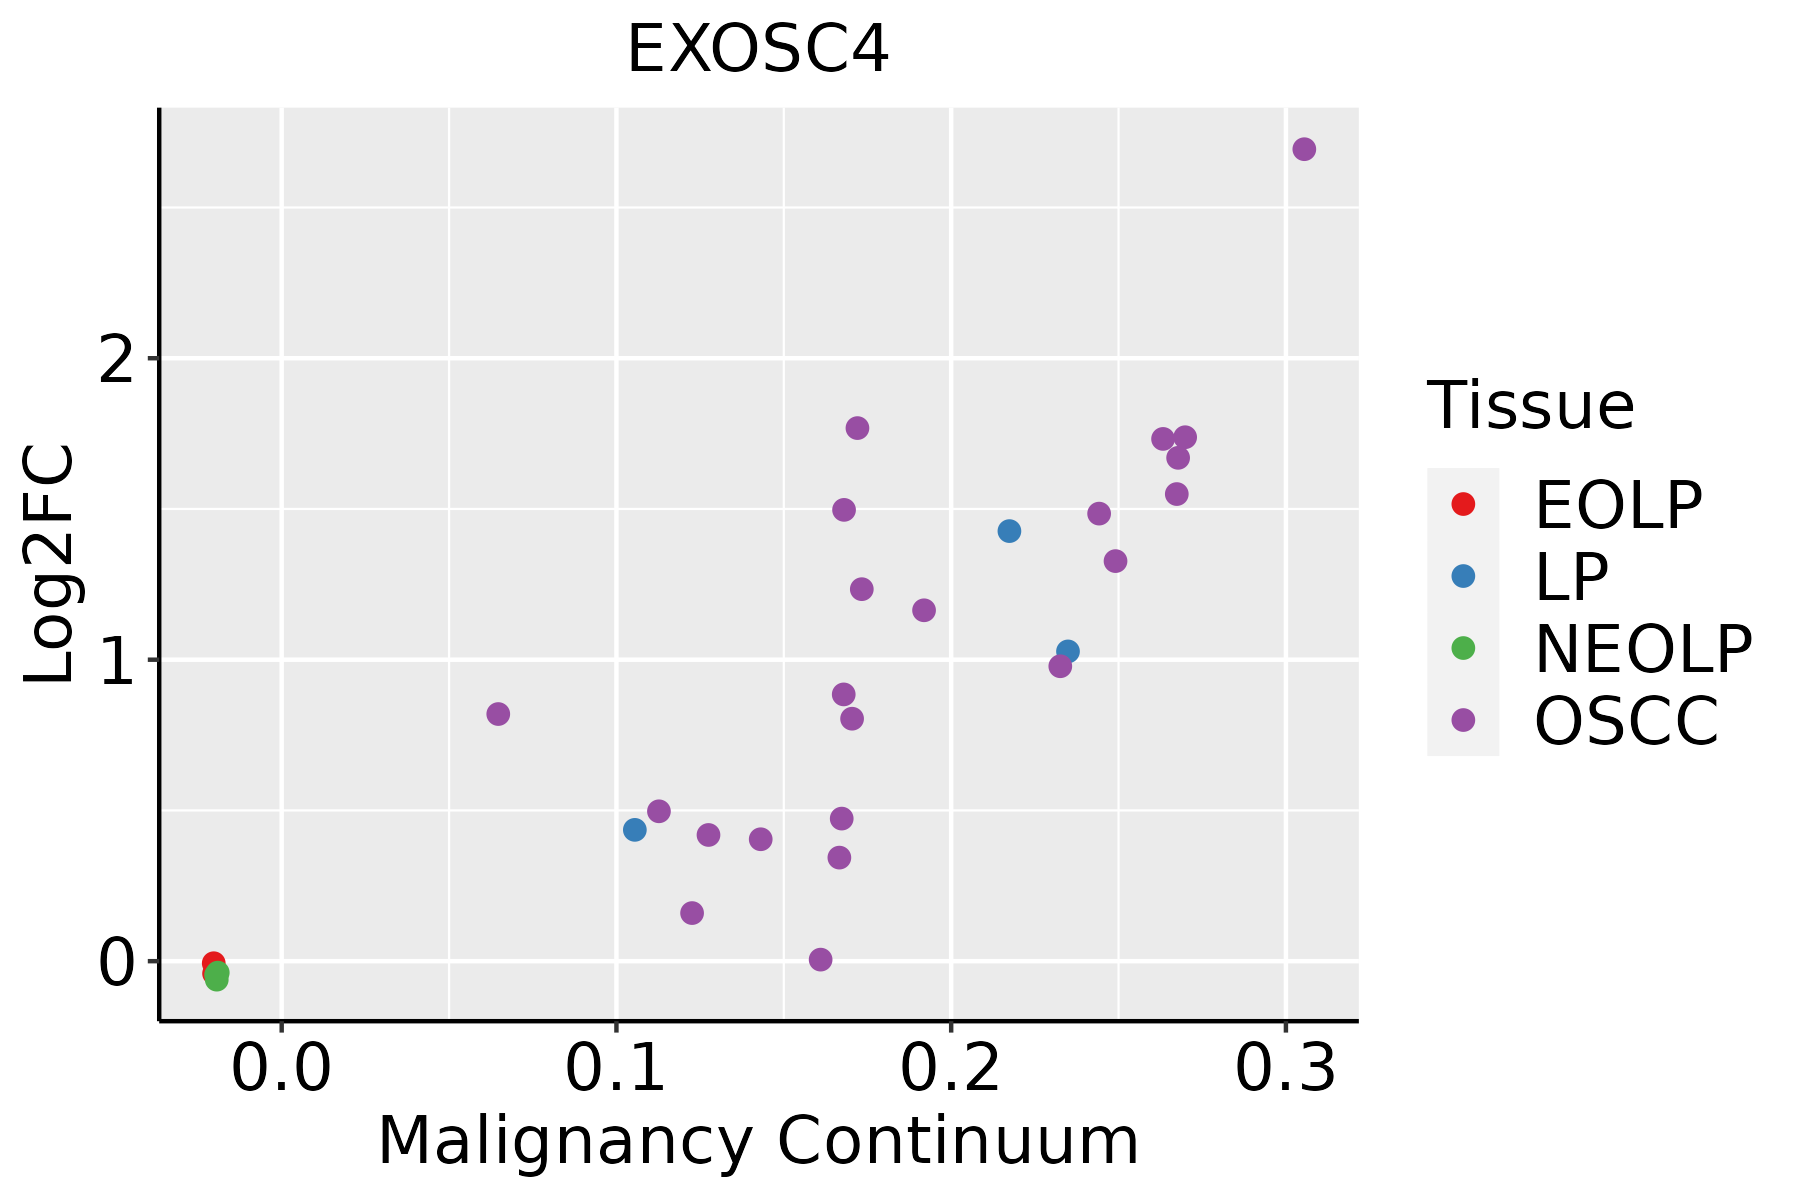 | EOLP: Erosive Oral lichen planus |
| LP: leukoplakia | ||
| NEOLP: Non-erosive oral lichen planus | ||
| OSCC: Oral squamous cell carcinoma | ||
| Prostate |  | BPH: Benign Prostatic Hyperplasia |
| Skin |  | AK: Actinic keratosis |
| cSCC: Cutaneous squamous cell carcinoma | ||
| SCCIS:squamous cell carcinoma in situ | ||
| Thyroid |  | ATC: Anaplastic thyroid cancer |
| HT: Hashimoto's thyroiditis | ||
| PTC: Papillary thyroid cancer |
| ∗log2FC in expression of this searched gene in stem-like cells from each diseased tissue sample relative to stem-like cells in normal samples in each tissue plotted against the malignancy continuum. Samples are colored based on if they are from different disease stage. |
Top |
Malignant transformation related pathway analysis |
| Find out the enriched GO biological processes and KEGG pathways involved in transition from healthy to precancer to cancer |
| Tissue | Disease Stage | Enriched GO biological Processes |
| Colorectum | AD |  |
| Colorectum | SER |  |
| Colorectum | MSS |  |
| Colorectum | MSI-H |  |
| Colorectum | FAP |  |
| ∗Top 15 enriched GO BP terms are showed in the bar plot of each disease state in each tissue. Each row represents a significant GO biological process which is colored according to the -log10(p.adjust). |
| Page: 1 2 3 4 5 6 7 8 9 |
| GO ID | Tissue | Disease Stage | Description | Gene Ratio | Bg Ratio | pvalue | p.adjust | Count |
| GO:000095624 | Thyroid | ATC | nuclear-transcribed mRNA catabolic process | 78/6293 | 112/18723 | 6.44e-15 | 4.07e-13 | 78 |
| GO:004670024 | Thyroid | ATC | heterocycle catabolic process | 228/6293 | 445/18723 | 7.26e-15 | 4.50e-13 | 228 |
| GO:004427025 | Thyroid | ATC | cellular nitrogen compound catabolic process | 229/6293 | 451/18723 | 2.25e-14 | 1.27e-12 | 229 |
| GO:001604927 | Thyroid | ATC | cell growth | 241/6293 | 482/18723 | 4.27e-14 | 2.35e-12 | 241 |
| GO:003466021 | Thyroid | ATC | ncRNA metabolic process | 240/6293 | 485/18723 | 2.03e-13 | 9.91e-12 | 240 |
| GO:001943924 | Thyroid | ATC | aromatic compound catabolic process | 232/6293 | 467/18723 | 3.05e-13 | 1.44e-11 | 232 |
| GO:190136124 | Thyroid | ATC | organic cyclic compound catabolic process | 238/6293 | 495/18723 | 1.12e-11 | 4.12e-10 | 238 |
| GO:000155826 | Thyroid | ATC | regulation of cell growth | 201/6293 | 414/18723 | 1.57e-10 | 4.76e-09 | 201 |
| GO:0009615111 | Thyroid | ATC | response to virus | 173/6293 | 367/18723 | 4.23e-08 | 7.71e-07 | 173 |
| GO:003112312 | Thyroid | ATC | RNA 3'-end processing | 65/6293 | 116/18723 | 5.58e-07 | 7.93e-06 | 65 |
| GO:000029112 | Thyroid | ATC | nuclear-transcribed mRNA catabolic process, exonucleolytic | 17/6293 | 19/18723 | 7.02e-07 | 9.42e-06 | 17 |
| GO:009050112 | Thyroid | ATC | RNA phosphodiester bond hydrolysis | 76/6293 | 152/18723 | 2.07e-05 | 1.86e-04 | 76 |
| GO:000046012 | Thyroid | ATC | maturation of 5.8S rRNA | 24/6293 | 35/18723 | 2.49e-05 | 2.16e-04 | 24 |
| GO:009050312 | Thyroid | ATC | RNA phosphodiester bond hydrolysis, exonucleolytic | 27/6293 | 42/18723 | 4.62e-05 | 3.70e-04 | 27 |
| GO:003466111 | Thyroid | ATC | ncRNA catabolic process | 27/6293 | 43/18723 | 8.44e-05 | 6.30e-04 | 27 |
| GO:007104411 | Thyroid | ATC | histone mRNA catabolic process | 10/6293 | 11/18723 | 1.40e-04 | 9.75e-04 | 10 |
| GO:007102711 | Thyroid | ATC | nuclear RNA surveillance | 11/6293 | 13/18723 | 2.30e-04 | 1.49e-03 | 11 |
| GO:007102811 | Thyroid | ATC | nuclear mRNA surveillance | 11/6293 | 13/18723 | 2.30e-04 | 1.49e-03 | 11 |
| GO:000833411 | Thyroid | ATC | histone mRNA metabolic process | 13/6293 | 17/18723 | 3.73e-04 | 2.28e-03 | 13 |
| GO:005160712 | Thyroid | ATC | defense response to virus | 115/6293 | 265/18723 | 5.31e-04 | 3.09e-03 | 115 |
| Page: 1 2 3 4 5 6 7 8 9 10 11 12 13 14 15 16 17 |
| Pathway ID | Tissue | Disease Stage | Description | Gene Ratio | Bg Ratio | pvalue | p.adjust | qvalue | Count |
| hsa0301810 | Esophagus | HGIN | RNA degradation | 27/1383 | 79/8465 | 7.73e-05 | 9.00e-04 | 7.15e-04 | 27 |
| hsa0301815 | Esophagus | HGIN | RNA degradation | 27/1383 | 79/8465 | 7.73e-05 | 9.00e-04 | 7.15e-04 | 27 |
| hsa0301824 | Esophagus | ESCC | RNA degradation | 62/4205 | 79/8465 | 1.18e-07 | 9.39e-07 | 4.81e-07 | 62 |
| hsa0301834 | Esophagus | ESCC | RNA degradation | 62/4205 | 79/8465 | 1.18e-07 | 9.39e-07 | 4.81e-07 | 62 |
| hsa03018 | Liver | Cirrhotic | RNA degradation | 44/2530 | 79/8465 | 1.43e-06 | 1.65e-05 | 1.02e-05 | 44 |
| hsa030181 | Liver | Cirrhotic | RNA degradation | 44/2530 | 79/8465 | 1.43e-06 | 1.65e-05 | 1.02e-05 | 44 |
| hsa030182 | Liver | HCC | RNA degradation | 58/4020 | 79/8465 | 2.29e-06 | 2.19e-05 | 1.22e-05 | 58 |
| hsa030183 | Liver | HCC | RNA degradation | 58/4020 | 79/8465 | 2.29e-06 | 2.19e-05 | 1.22e-05 | 58 |
| hsa030189 | Oral cavity | OSCC | RNA degradation | 59/3704 | 79/8465 | 2.05e-08 | 1.91e-07 | 9.70e-08 | 59 |
| hsa0301814 | Oral cavity | OSCC | RNA degradation | 59/3704 | 79/8465 | 2.05e-08 | 1.91e-07 | 9.70e-08 | 59 |
| hsa0301823 | Oral cavity | LP | RNA degradation | 39/2418 | 79/8465 | 6.98e-05 | 4.38e-04 | 2.83e-04 | 39 |
| hsa0301833 | Oral cavity | LP | RNA degradation | 39/2418 | 79/8465 | 6.98e-05 | 4.38e-04 | 2.83e-04 | 39 |
| hsa030188 | Prostate | BPH | RNA degradation | 29/1718 | 79/8465 | 5.17e-04 | 2.67e-03 | 1.65e-03 | 29 |
| hsa0301813 | Prostate | BPH | RNA degradation | 29/1718 | 79/8465 | 5.17e-04 | 2.67e-03 | 1.65e-03 | 29 |
| hsa0301822 | Prostate | Tumor | RNA degradation | 30/1791 | 79/8465 | 4.48e-04 | 2.35e-03 | 1.46e-03 | 30 |
| hsa0301832 | Prostate | Tumor | RNA degradation | 30/1791 | 79/8465 | 4.48e-04 | 2.35e-03 | 1.46e-03 | 30 |
| Page: 1 |
Top |
Cell-cell communication analysis |
| Identification of potential cell-cell interactions between two cell types and their ligand-receptor pairs for different disease states |
| Ligand | Receptor | LRpair | Pathway | Tissue | Disease Stage |
| Page: 1 |
Top |
Single-cell gene regulatory network inference analysis |
| Find out the significant the regulons (TFs) and the target genes of each regulon across cell types for different disease states |
| TF | Cell Type | Tissue | Disease Stage | Target Gene | RSS | Regulon Activity |
| ∗The dot plots of a searched regulon are shown for all cell subpopulations in each disease state of each tissue based on the regulon specific score inferred using pySCENIC and by calculating the average expression. |
| Page: 1 |
Top |
Somatic mutation of malignant transformation related genes |
| Annotation of somatic variants for genes involved in malignant transformation |
| Hugo Symbol | Variant Class | Variant Classification | dbSNP RS | HGVSc | HGVSp | HGVSp Short | SWISSPROT | BIOTYPE | SIFT | PolyPhen | Tumor Sample Barcode | Tissue | Histology | Sex | Age | Stage | Therapy Types | Drugs | Outcome |
| EXOSC4 | SNV | Missense_Mutation | c.7G>A | p.Gly3Arg | p.G3R | Q9NPD3 | protein_coding | tolerated(0.13) | benign(0.117) | TCGA-A1-A0SI-01 | Breast | breast invasive carcinoma | Female | <65 | I/II | Unknown | Unknown | SD | |
| EXOSC4 | deletion | In_Frame_Del | novel | c.77_139delNNNNNNNNNNNNNNNNNNNNNNNNNNNNNNNNNNNNNNNNNNNNNNNNNNNNNNNNNNNNNNN | p.Arg28_Ala48del | p.R28_A48del | Q9NPD3 | protein_coding | TCGA-BH-A5IZ-01 | Breast | breast invasive carcinoma | Female | <65 | I/II | Chemotherapy | adriamycin | CR | ||
| EXOSC4 | SNV | Missense_Mutation | c.369N>G | p.Ile123Met | p.I123M | Q9NPD3 | protein_coding | deleterious(0) | probably_damaging(0.997) | TCGA-C5-A1BL-01 | Cervix | cervical & endocervical cancer | Female | <65 | I/II | Unknown | Unknown | SD | |
| EXOSC4 | SNV | Missense_Mutation | rs376508817 | c.590N>T | p.Ala197Val | p.A197V | Q9NPD3 | protein_coding | tolerated(1) | benign(0.011) | TCGA-AZ-6598-01 | Colorectum | colon adenocarcinoma | Female | >=65 | I/II | Unknown | Unknown | SD |
| EXOSC4 | SNV | Missense_Mutation | rs373942429 | c.611N>A | p.Arg204Gln | p.R204Q | Q9NPD3 | protein_coding | deleterious(0.01) | probably_damaging(0.985) | TCGA-D5-5538-01 | Colorectum | colon adenocarcinoma | Female | <65 | III/IV | Chemotherapy | calcium | PD |
| EXOSC4 | SNV | Missense_Mutation | rs201630396 | c.311G>A | p.Arg104His | p.R104H | Q9NPD3 | protein_coding | deleterious(0.04) | possibly_damaging(0.856) | TCGA-DC-6158-01 | Colorectum | rectum adenocarcinoma | Male | >=65 | I/II | Unknown | Unknown | SD |
| EXOSC4 | SNV | Missense_Mutation | rs373942429 | c.611N>A | p.Arg204Gln | p.R204Q | Q9NPD3 | protein_coding | deleterious(0.01) | probably_damaging(0.985) | TCGA-A5-A0G1-01 | Endometrium | uterine corpus endometrioid carcinoma | Female | >=65 | I/II | Unknown | Unknown | SD |
| EXOSC4 | SNV | Missense_Mutation | novel | c.467N>A | p.Phe156Tyr | p.F156Y | Q9NPD3 | protein_coding | tolerated(1) | benign(0.031) | TCGA-AJ-A3EK-01 | Endometrium | uterine corpus endometrioid carcinoma | Female | <65 | I/II | Chemotherapy | carboplatin | CR |
| EXOSC4 | SNV | Missense_Mutation | novel | c.199C>T | p.Pro67Ser | p.P67S | Q9NPD3 | protein_coding | tolerated(0.62) | benign(0) | TCGA-AP-A1DK-01 | Endometrium | uterine corpus endometrioid carcinoma | Female | <65 | I/II | Unknown | Unknown | SD |
| EXOSC4 | SNV | Missense_Mutation | rs782220917 | c.697N>T | p.Arg233Trp | p.R233W | Q9NPD3 | protein_coding | deleterious(0) | probably_damaging(0.952) | TCGA-AX-A06D-01 | Endometrium | uterine corpus endometrioid carcinoma | Female | >=65 | III/IV | Chemotherapy | carboplatin | PD |
| Page: 1 2 3 |
Top |
Related drugs of malignant transformation related genes |
| Identification of chemicals and drugs interact with genes involved in malignant transfromation |
| (DGIdb 4.0) |
| Entrez ID | Symbol | Category | Interaction Types | Drug Claim Name | Drug Name | PMIDs |
| Page: 1 |

Copyright 2023-Present -The University of Texas Health Science Center at Houston |