Schematic overview of the cellular and molecular mechanisms involved in the cancer progression, including the proposed cellular and molecular mechanisms in cancer cells trajectory. AT1: alveolar type 1 cells; AT2: alveolar type 2 cells; AAH: atypical adenomatous hyperplasia; AIS: adenocarcinoma in situ; MIA: minimally invasive adenocarcinoma; IA: invasive adenocarcinoma; EMT: epithelial-mesenchymal transition

Home

Download

Statistics

Help

Contact

Center for Computational Systems Medicine
leaf

Gene summary

leaf

Malignant transformation analysis

leaf

Malignant transformation related pathway analysis

leaf

Cell-cell communication analysis

leaf

Single-cell gene regulatory network inference analysis

leaf

Somatic mutation of malignant transformation related genes

leaf

Related drugs of malignant transformation related genes

Gene: EPB41

Gene summary for EPB41

check button Gene summary.

Gene informationSpeciesHuman
Gene symbol

EPB41

Gene ID

2035

Gene nameerythrocyte membrane protein band 4.1
Gene Alias4.1R
Cytomap1p35.3
Gene Typeprotein-coding
GO ID

GO:0000902

UniProtAcc

P11171


Top

Malignant transformation analysis

check button Identification of the aberrant gene expression in precancerous and cancerous lesions by comparing the gene expression of stem-like cells in diseased tissues with normal stem cells
check button Malignant transformation involving gene list.
Entrez IDSymbolReplicatesSpeciesOrganTissueAdj P-valueLog2FCMalignancy
2035EPB41CCI_1HumanCervixCC6.89e-077.71e-010.528
2035EPB41CCI_2HumanCervixCC2.53e-025.81e-010.5249
2035EPB41CCI_3HumanCervixCC3.01e-087.06e-010.516
2035EPB41HTA11_3410_2000001011HumanColorectumAD3.98e-13-5.53e-010.0155
2035EPB41HTA11_347_2000001011HumanColorectumAD1.05e-023.71e-01-0.1954
2035EPB41HTA11_9408_2000001011HumanColorectumAD5.05e-03-3.42e-010.0451
2035EPB41HTA11_99999965062_69753HumanColorectumMSI-H2.66e-027.23e-010.3487
2035EPB41HTA11_99999974143_84620HumanColorectumMSS2.80e-02-2.03e-010.3005
2035EPB41F007HumanColorectumFAP7.07e-04-5.02e-010.1176
2035EPB41A002-C-010HumanColorectumFAP1.20e-04-3.53e-010.242
2035EPB41A001-C-207HumanColorectumFAP8.23e-04-4.23e-010.1278
2035EPB41A015-C-203HumanColorectumFAP6.10e-39-4.26e-01-0.1294
2035EPB41A015-C-204HumanColorectumFAP3.07e-05-2.82e-01-0.0228
2035EPB41A014-C-040HumanColorectumFAP2.84e-09-7.47e-01-0.1184
2035EPB41A002-C-201HumanColorectumFAP6.18e-23-6.21e-010.0324
2035EPB41A002-C-203HumanColorectumFAP8.52e-18-4.23e-010.2786
2035EPB41A001-C-119HumanColorectumFAP6.99e-07-2.48e-01-0.1557
2035EPB41A001-C-108HumanColorectumFAP6.79e-29-3.54e-01-0.0272
2035EPB41A002-C-205HumanColorectumFAP1.60e-24-4.78e-01-0.1236
2035EPB41A001-C-104HumanColorectumFAP3.05e-08-2.77e-010.0184
Page: 1 2 3 4 5 

check button Transcriptomic changes along malignancy continuum.
TissueExpression DynamicsAbbreviation
CervixThe image shows the transcriptomic changes along malignancy continuum.log2FC in expression of this searched gene in stem-like cells from each diseased tissue sample relative to stem-like cells in normal samples in each tissue plotted against the malignancy continuum. Samples are colored based on if they are from different disease stage.CC: Cervix cancer
HSIL_HPV: HPV-infected high-grade squamous intraepithelial lesions
N_HPV: HPV-infected normal cervix
Colorectum (GSE201348)The image shows the transcriptomic changes along malignancy continuum.log2FC in expression of this searched gene in stem-like cells from each diseased tissue sample relative to stem-like cells in normal samples in each tissue plotted against the malignancy continuum. Samples are colored based on if they are from different disease stage.
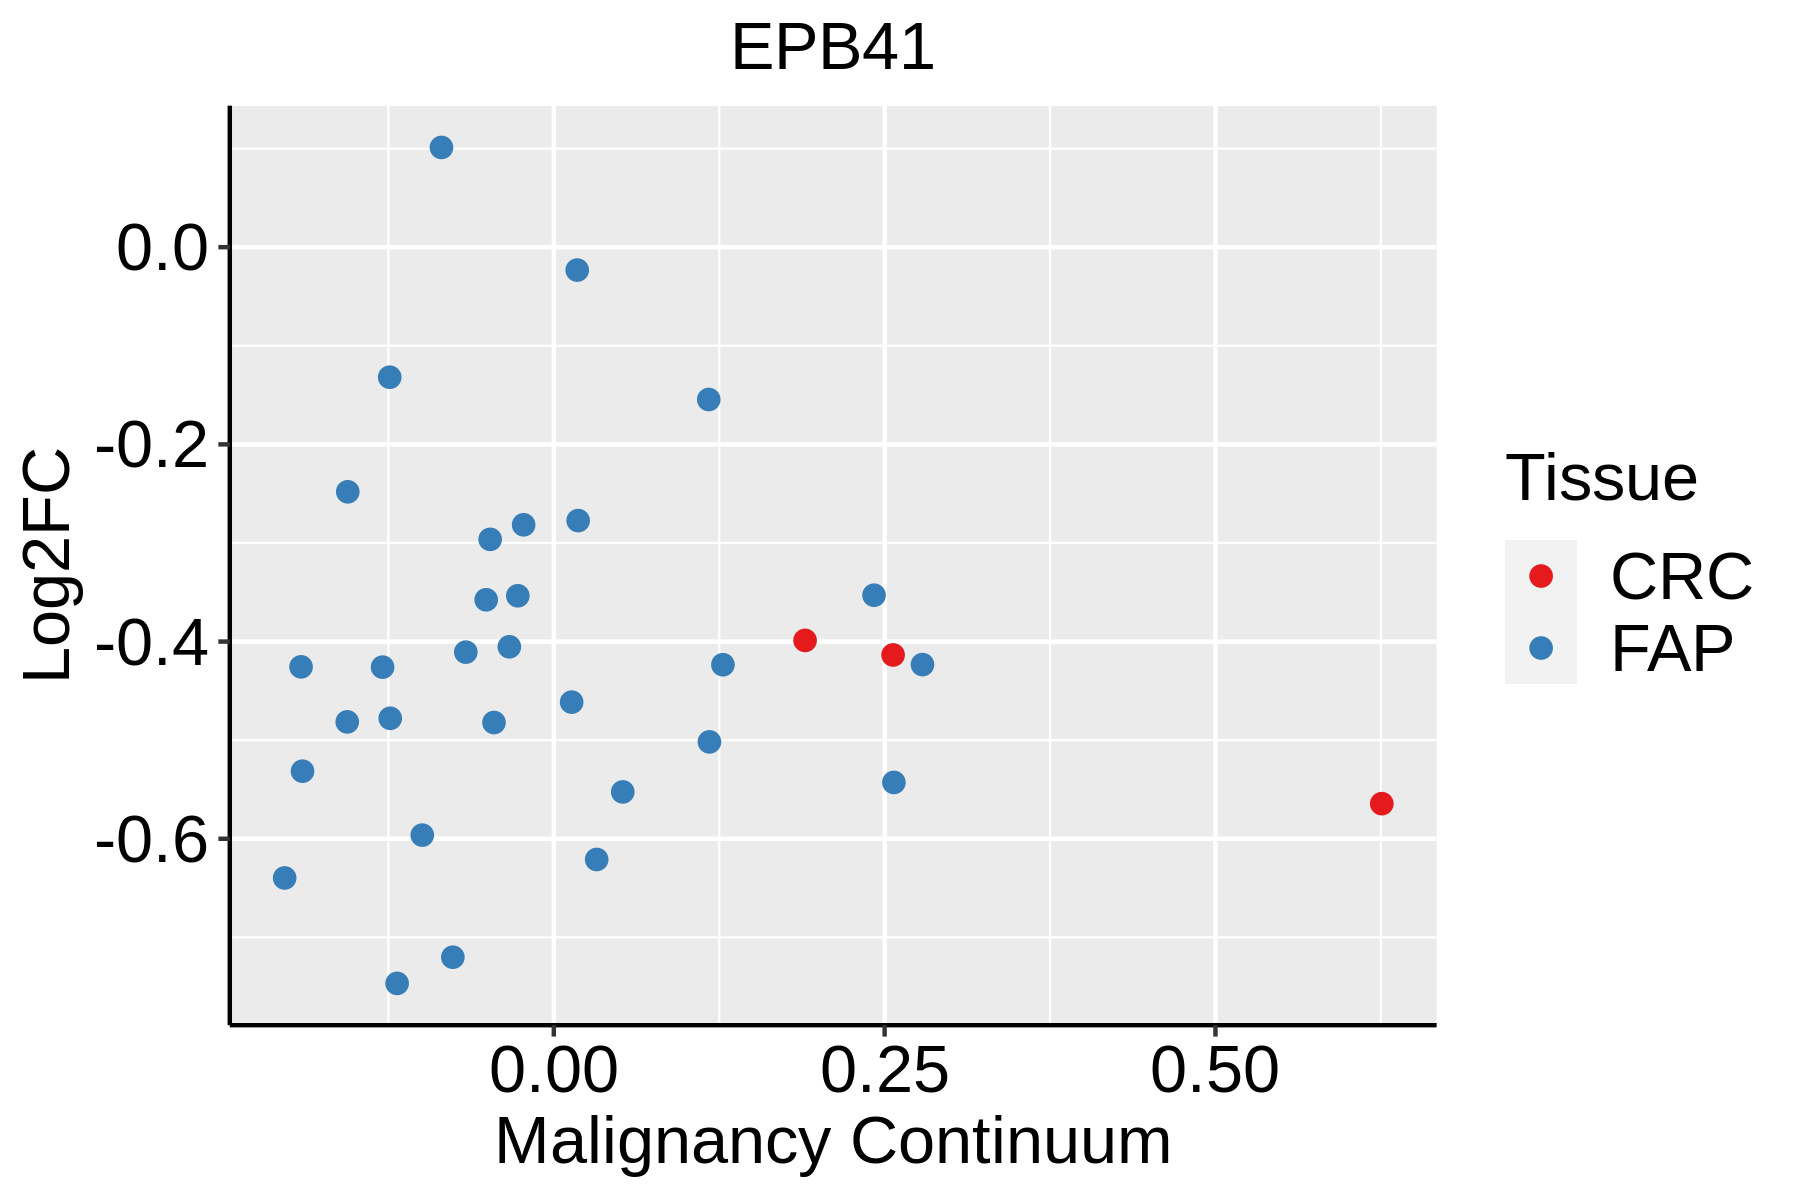
FAP: Familial adenomatous polyposis
CRC: Colorectal cancer
Colorectum (HTA11)The image shows the transcriptomic changes along malignancy continuum.log2FC in expression of this searched gene in stem-like cells from each diseased tissue sample relative to stem-like cells in normal samples in each tissue plotted against the malignancy continuum. Samples are colored based on if they are from different disease stage.AD: Adenomas
SER: Sessile serrated lesions
MSI-H: Microsatellite-high colorectal cancer
MSS: Microsatellite stable colorectal cancer
EndometriumThe image shows the transcriptomic changes along malignancy continuum.log2FC in expression of this searched gene in stem-like cells from each diseased tissue sample relative to stem-like cells in normal samples in each tissue plotted against the malignancy continuum. Samples are colored based on if they are from different disease stage.
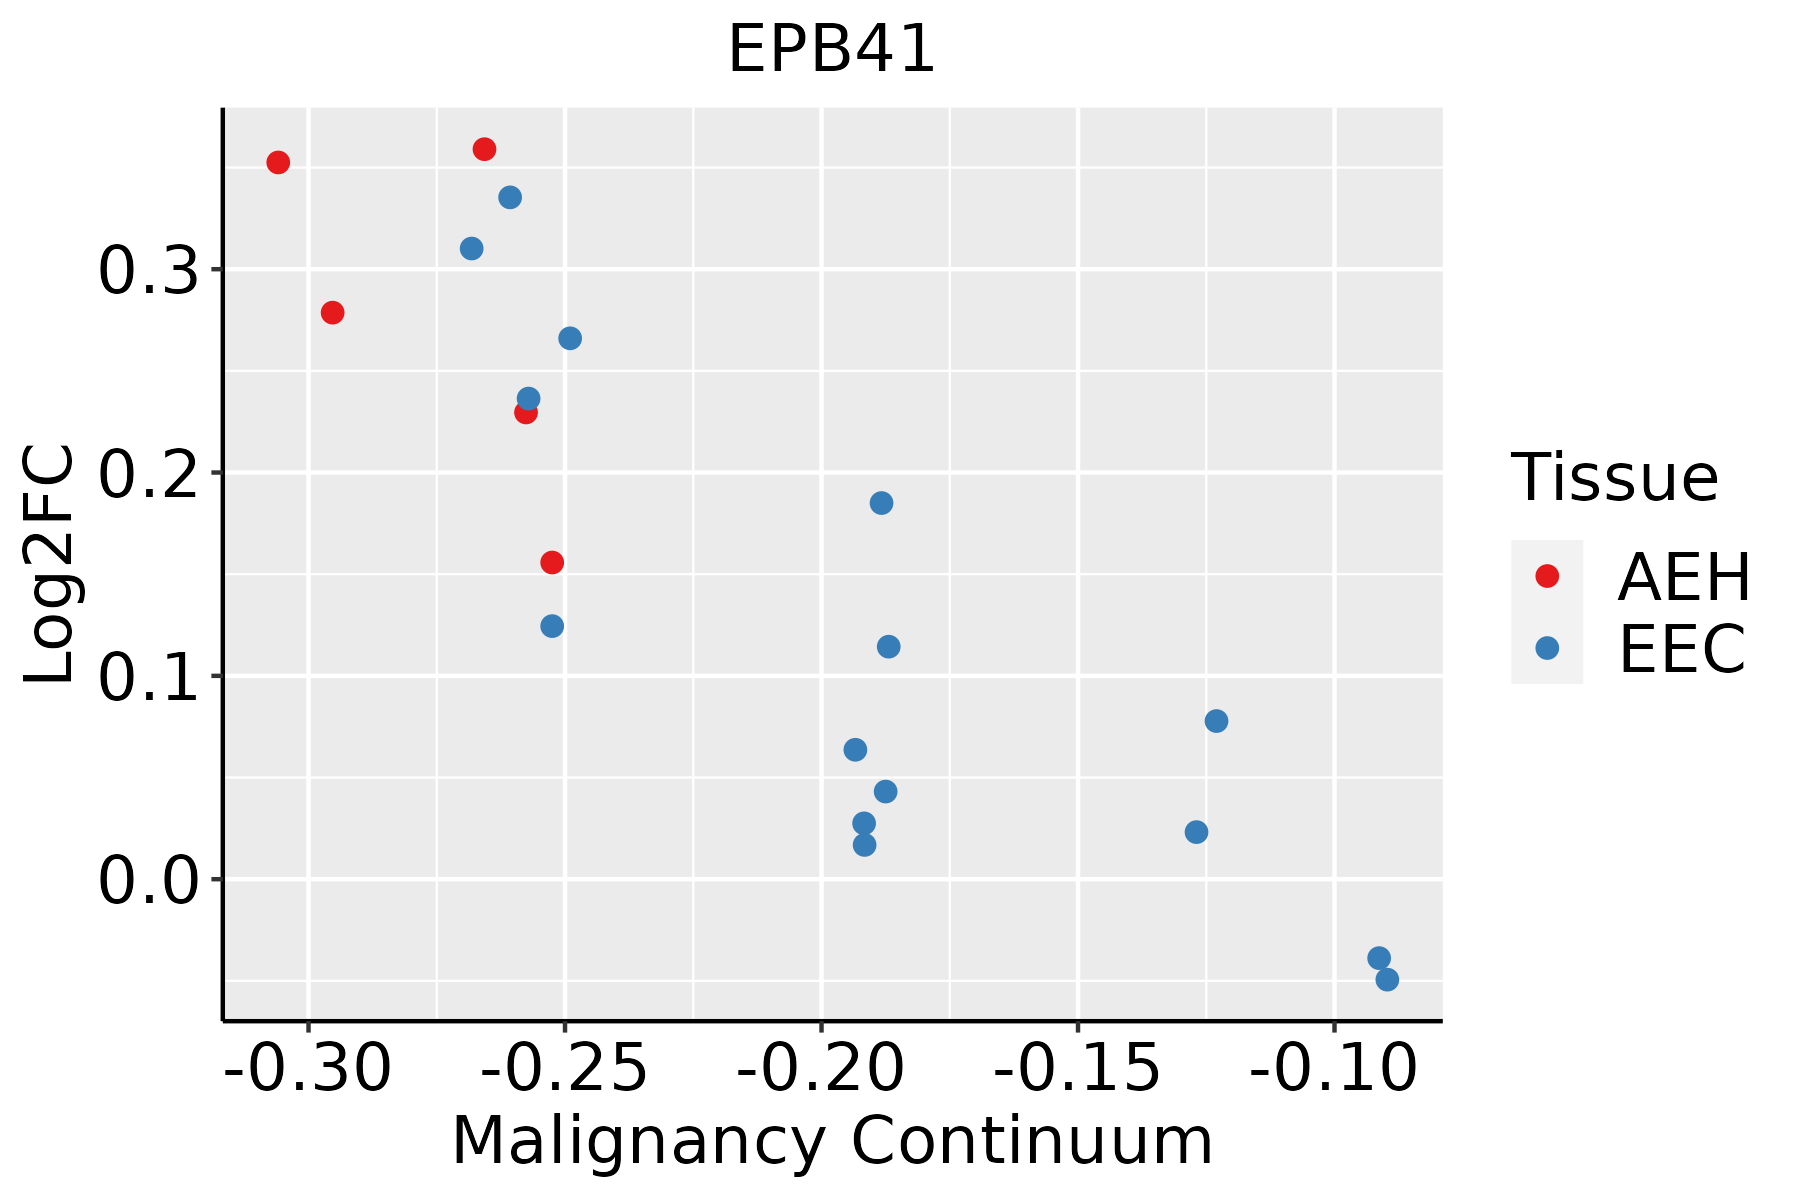
AEH: Atypical endometrial hyperplasia
EEC: Endometrioid Cancer
LiverThe image shows the transcriptomic changes along malignancy continuum.log2FC in expression of this searched gene in stem-like cells from each diseased tissue sample relative to stem-like cells in normal samples in each tissue plotted against the malignancy continuum. Samples are colored based on if they are from different disease stage.HCC: Hepatocellular carcinoma
NAFLD: Non-alcoholic fatty liver disease
LungThe image shows the transcriptomic changes along malignancy continuum.log2FC in expression of this searched gene in stem-like cells from each diseased tissue sample relative to stem-like cells in normal samples in each tissue plotted against the malignancy continuum. Samples are colored based on if they are from different disease stage.
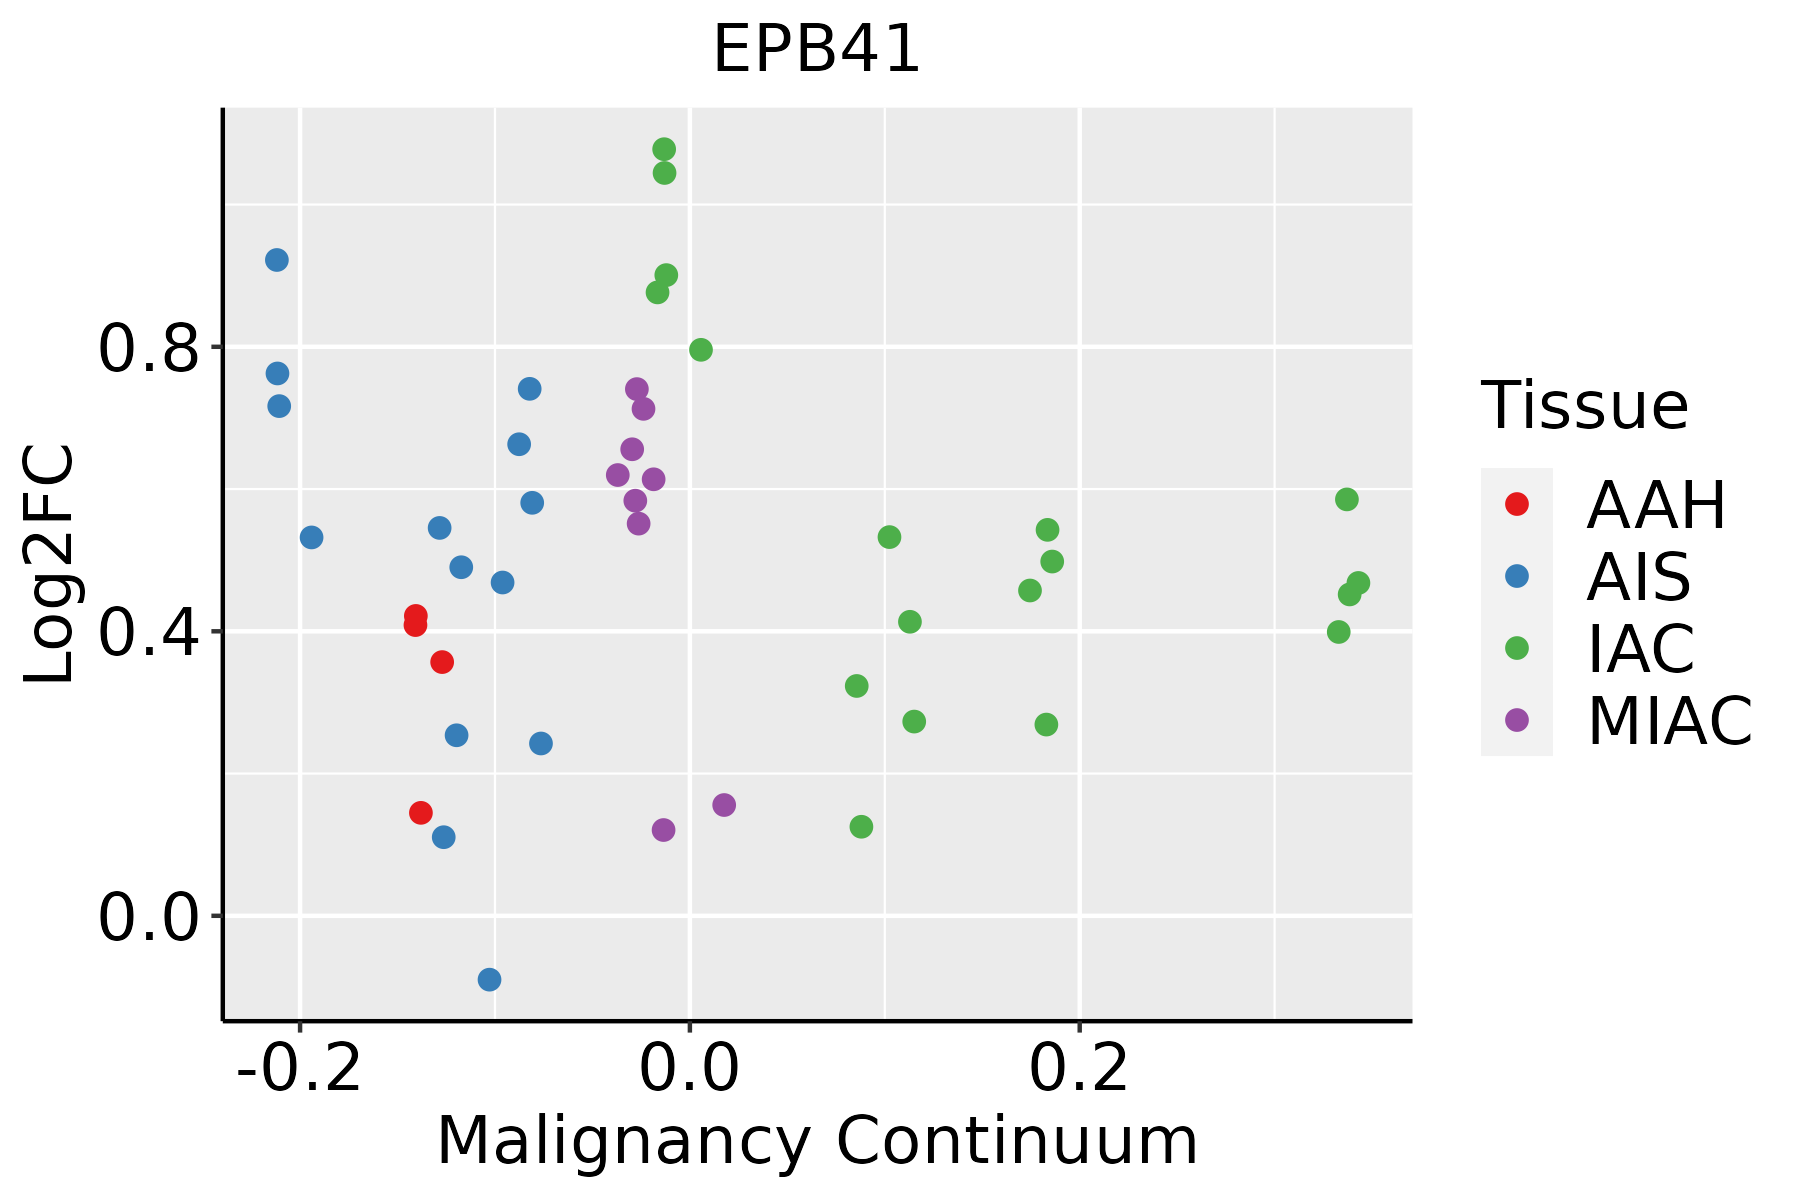
AAH: Atypical adenomatous hyperplasia
AIS: Adenocarcinoma in situ
IAC: Invasive lung adenocarcinoma
MIA: Minimally invasive adenocarcinoma
ThyroidThe image shows the transcriptomic changes along malignancy continuum.log2FC in expression of this searched gene in stem-like cells from each diseased tissue sample relative to stem-like cells in normal samples in each tissue plotted against the malignancy continuum. Samples are colored based on if they are from different disease stage.ATC: Anaplastic thyroid cancer
HT: Hashimoto's thyroiditis
PTC: Papillary thyroid cancer
∗log2FC in expression of this searched gene in stem-like cells from each diseased tissue sample relative to stem-like cells in normal samples in each tissue plotted against the malignancy continuum. Samples are colored based on if they are from different disease stage.

Top

Malignant transformation related pathway analysis

check buttonFind out the enriched GO biological processes and KEGG pathways involved in transition from healthy to precancer to cancer
check button Figure of enriched GO biological processes.
TissueDisease StageEnriched GO biological Processes
ColorectumADGO analysis - Figure of enriched GO biological processes: Top 15 enriched GO BP terms are showed in the bar plot of each disease state in each tissue. Each row represents a significant GO biological process which is colored according to the -log10(p.adjust).
ColorectumSERGO analysis - Figure of enriched GO biological processes: Top 15 enriched GO BP terms are showed in the bar plot of each disease state in each tissue. Each row represents a significant GO biological process which is colored according to the -log10(p.adjust).
ColorectumMSSGO analysis - Figure of enriched GO biological processes: Top 15 enriched GO BP terms are showed in the bar plot of each disease state in each tissue. Each row represents a significant GO biological process which is colored according to the -log10(p.adjust).
ColorectumMSI-HGO analysis - Figure of enriched GO biological processes: Top 15 enriched GO BP terms are showed in the bar plot of each disease state in each tissue. Each row represents a significant GO biological process which is colored according to the -log10(p.adjust).
ColorectumFAPGO analysis - Figure of enriched GO biological processes: Top 15 enriched GO BP terms are showed in the bar plot of each disease state in each tissue. Each row represents a significant GO biological process which is colored according to the -log10(p.adjust).
∗Top 15 enriched GO BP terms are showed in the bar plot of each disease state in each tissue. Each row represents a significant GO biological process which is colored according to the -log10(p.adjust).
Page: 1 2 3 4 5 6 7 8 9 

check button Enriched GO biological processes.
GO IDTissueDisease StageDescriptionGene RatioBg Ratiopvaluep.adjustCount
GO:00715609EsophagusESCCcellular response to transforming growth factor beta stimulus151/8552250/187231.78e-062.10e-05151
GO:003209216EsophagusESCCpositive regulation of protein binding60/855285/187232.83e-063.22e-0560
GO:000716018EsophagusESCCcell-matrix adhesion141/8552233/187233.33e-063.71e-05141
GO:003209116EsophagusESCCnegative regulation of protein binding65/855294/187233.46e-063.82e-0565
GO:00073698EsophagusESCCgastrulation115/8552185/187234.35e-064.64e-05115
GO:015011619EsophagusESCCregulation of cell-substrate junction organization51/855271/187236.99e-067.04e-0551
GO:00074926EsophagusESCCendoderm development54/855277/187231.20e-051.12e-0454
GO:005189318EsophagusESCCregulation of focal adhesion assembly47/855266/187232.31e-051.98e-0447
GO:009010918EsophagusESCCregulation of cell-substrate junction assembly47/855266/187232.31e-051.98e-0447
GO:003086517EsophagusESCCcortical cytoskeleton organization44/855261/187232.50e-052.13e-0444
GO:00018378EsophagusESCCepithelial to mesenchymal transition95/8552157/187231.25e-048.56e-0495
GO:190437719EsophagusESCCpositive regulation of protein localization to cell periphery47/855269/187231.37e-049.27e-0447
GO:00017044EsophagusESCCformation of primary germ layer75/8552121/187232.17e-041.36e-0375
GO:000195418EsophagusESCCpositive regulation of cell-matrix adhesion40/855258/187232.83e-041.71e-0340
GO:003432918EsophagusESCCcell junction assembly227/8552420/187233.06e-041.83e-03227
GO:002240720EsophagusESCCregulation of cell-cell adhesion239/8552448/187235.88e-043.19e-03239
GO:00487628EsophagusESCCmesenchymal cell differentiation133/8552236/187235.94e-043.22e-03133
GO:006056010EsophagusESCCdevelopmental growth involved in morphogenesis131/8552234/187239.28e-044.73e-03131
GO:000166720EsophagusESCCameboidal-type cell migration250/8552475/187231.22e-035.97e-03250
GO:003086610EsophagusESCCcortical actin cytoskeleton organization28/855240/187231.61e-037.50e-0328
Page: 1 2 3 4 5 6 7 8 9 10 11 12 13 14 15 16 17 18 19 20 21 22 23 24 25 26 27 28 29 30 31 32 33 34 35 36 37 38 39 40 41 

check button Enriched KEGG pathways.
Pathway IDTissueDisease StageDescriptionGene RatioBg Ratiopvaluep.adjustqvalueCount
Page: 1 

Top

Cell-cell communication analysis

check buttonIdentification of potential cell-cell interactions between two cell types and their ligand-receptor pairs for different disease states
LigandReceptorLRpairPathwayTissueDisease Stage
Page: 1 

Top

Single-cell gene regulatory network inference analysis

check buttonFind out the significant the regulons (TFs) and the target genes of each regulon across cell types for different disease states
TFCell TypeTissueDisease StageTarget GeneRSSRegulon Activity
∗The dot plots of a searched regulon are shown for all cell subpopulations in each disease state of each tissue based on the regulon specific score inferred using pySCENIC and by calculating the average expression.
Page: 1 

Top

Somatic mutation of malignant transformation related genes

check buttonAnnotation of somatic variants for genes involved in malignant transformation
Hugo SymbolVariant ClassVariant ClassificationdbSNP RSHGVScHGVSpHGVSp ShortSWISSPROTBIOTYPESIFTPolyPhenTumor Sample BarcodeTissueHistologySexAgeStageTherapy TypesDrugsOutcome
EPB41SNVMissense_Mutationrs202197419c.1070N>Gp.Pro357Argp.P357RP11171protein_codingdeleterious(0)probably_damaging(0.999)TCGA-A2-A04W-01Breastbreast invasive carcinomaFemale<65I/IIChemotherapycytoxanSD
EPB41SNVMissense_Mutationc.1412G>Ap.Arg471Glnp.R471QP11171protein_codingdeleterious(0)probably_damaging(0.948)TCGA-AN-A046-01Breastbreast invasive carcinomaFemale>=65I/IIUnknownUnknownSD
EPB41SNVMissense_Mutationc.223N>Cp.Glu75Glnp.E75QP11171protein_codingtolerated(0.06)benign(0.077)TCGA-EW-A1J5-01Breastbreast invasive carcinomaFemale<65I/IIChemotherapyadriamycinSD
EPB41SNVMissense_Mutationc.118N>Gp.Gln40Glup.Q40EP11171protein_codingtolerated_low_confidence(0.34)benign(0.013)TCGA-GM-A2D9-01Breastbreast invasive carcinomaFemale>=65I/IIHormone TherapyarimidexSD
EPB41deletionFrame_Shift_Delc.1056delNp.Phe353LeufsTer25p.F353Lfs*25P11171protein_codingTCGA-B6-A1KI-01Breastbreast invasive carcinomaFemale<65I/IIUnknownUnknownSD
EPB41SNVMissense_Mutationnovelc.1597C>Tp.Arg533Cysp.R533CP11171protein_codingdeleterious(0)probably_damaging(1)TCGA-2W-A8YY-01Cervixcervical & endocervical cancerFemale<65I/IIChemotherapycisplatinCR
EPB41SNVMissense_Mutationc.868N>Gp.Pro290Alap.P290AP11171protein_codingdeleterious(0)probably_damaging(0.996)TCGA-DR-A0ZM-01Cervixcervical & endocervical cancerFemale<65III/IVUnspecificCisplatinSD
EPB41SNVMissense_Mutationnovelc.1828C>Ap.Pro610Thrp.P610TP11171protein_codingdeleterious(0.03)benign(0.001)TCGA-DS-A1OC-01Cervixcervical & endocervical cancerFemale<65I/IIChemotherapygemcitabineSD
EPB41SNVMissense_Mutationc.1402N>Gp.Pro468Alap.P468AP11171protein_codingdeleterious(0.01)possibly_damaging(0.453)TCGA-EK-A2PM-01Cervixcervical & endocervical cancerFemale>=65I/IIUnknownUnknownSD
EPB41SNVMissense_Mutationc.1969N>Ap.Glu657Lysp.E657KP11171protein_codingdeleterious(0.01)benign(0.097)TCGA-LP-A5U2-01Cervixcervical & endocervical cancerFemale<65III/IVUnknownUnknownSD
Page: 1 2 3 4 5 6 7 

Top

Related drugs of malignant transformation related genes

check buttonIdentification of chemicals and drugs interact with genes involved in malignant transfromation
(DGIdb 4.0)
Entrez IDSymbolCategoryInteraction TypesDrug Claim NameDrug NamePMIDs
2035EPB41TRANSPORTERbupropionBUPROPION
2035EPB41TRANSPORTERnicotineNICOTINE
Page: 1