
|
|||||
|
 | |
| |
| |
| |
| |
| |
|
Gene: COA1 |
Gene summary for COA1 |
| Gene information | Species | Human | Gene symbol | COA1 | Gene ID | 55744 |
| Gene name | cytochrome c oxidase assembly factor 1 | |
| Gene Alias | C7orf44 | |
| Cytomap | 7p13 | |
| Gene Type | protein-coding | GO ID | GO:0006996 | UniProtAcc | A0A024RA60 |
Top |
Malignant transformation analysis |
| Identification of the aberrant gene expression in precancerous and cancerous lesions by comparing the gene expression of stem-like cells in diseased tissues with normal stem cells |
| Entrez ID | Symbol | Replicates | Species | Organ | Tissue | Adj P-value | Log2FC | Malignancy |
| 55744 | COA1 | LZE2D | Human | Esophagus | HGIN | 3.80e-02 | 1.97e-01 | 0.0642 |
| 55744 | COA1 | LZE4T | Human | Esophagus | ESCC | 1.84e-16 | 4.21e-01 | 0.0811 |
| 55744 | COA1 | LZE7T | Human | Esophagus | ESCC | 6.06e-07 | 5.99e-01 | 0.0667 |
| 55744 | COA1 | LZE8T | Human | Esophagus | ESCC | 9.79e-08 | 3.55e-01 | 0.067 |
| 55744 | COA1 | LZE22D1 | Human | Esophagus | HGIN | 1.12e-05 | 1.49e-01 | 0.0595 |
| 55744 | COA1 | LZE24T | Human | Esophagus | ESCC | 7.63e-16 | 4.78e-01 | 0.0596 |
| 55744 | COA1 | LZE6T | Human | Esophagus | ESCC | 8.90e-09 | 5.25e-01 | 0.0845 |
| 55744 | COA1 | P1T-E | Human | Esophagus | ESCC | 5.94e-08 | 5.72e-01 | 0.0875 |
| 55744 | COA1 | P2T-E | Human | Esophagus | ESCC | 2.59e-44 | 8.85e-01 | 0.1177 |
| 55744 | COA1 | P4T-E | Human | Esophagus | ESCC | 1.06e-29 | 8.48e-01 | 0.1323 |
| 55744 | COA1 | P5T-E | Human | Esophagus | ESCC | 1.58e-14 | 2.51e-01 | 0.1327 |
| 55744 | COA1 | P8T-E | Human | Esophagus | ESCC | 4.19e-22 | 4.45e-01 | 0.0889 |
| 55744 | COA1 | P9T-E | Human | Esophagus | ESCC | 4.15e-19 | 4.52e-01 | 0.1131 |
| 55744 | COA1 | P10T-E | Human | Esophagus | ESCC | 1.28e-30 | 6.38e-01 | 0.116 |
| 55744 | COA1 | P11T-E | Human | Esophagus | ESCC | 2.97e-18 | 9.66e-01 | 0.1426 |
| 55744 | COA1 | P12T-E | Human | Esophagus | ESCC | 4.73e-46 | 8.62e-01 | 0.1122 |
| 55744 | COA1 | P15T-E | Human | Esophagus | ESCC | 2.19e-40 | 1.02e+00 | 0.1149 |
| 55744 | COA1 | P16T-E | Human | Esophagus | ESCC | 1.96e-28 | 6.14e-01 | 0.1153 |
| 55744 | COA1 | P17T-E | Human | Esophagus | ESCC | 4.46e-09 | 5.08e-01 | 0.1278 |
| 55744 | COA1 | P19T-E | Human | Esophagus | ESCC | 5.42e-06 | 7.74e-01 | 0.1662 |
| Page: 1 2 3 4 5 6 7 |
| Tissue | Expression Dynamics | Abbreviation |
| Esophagus | 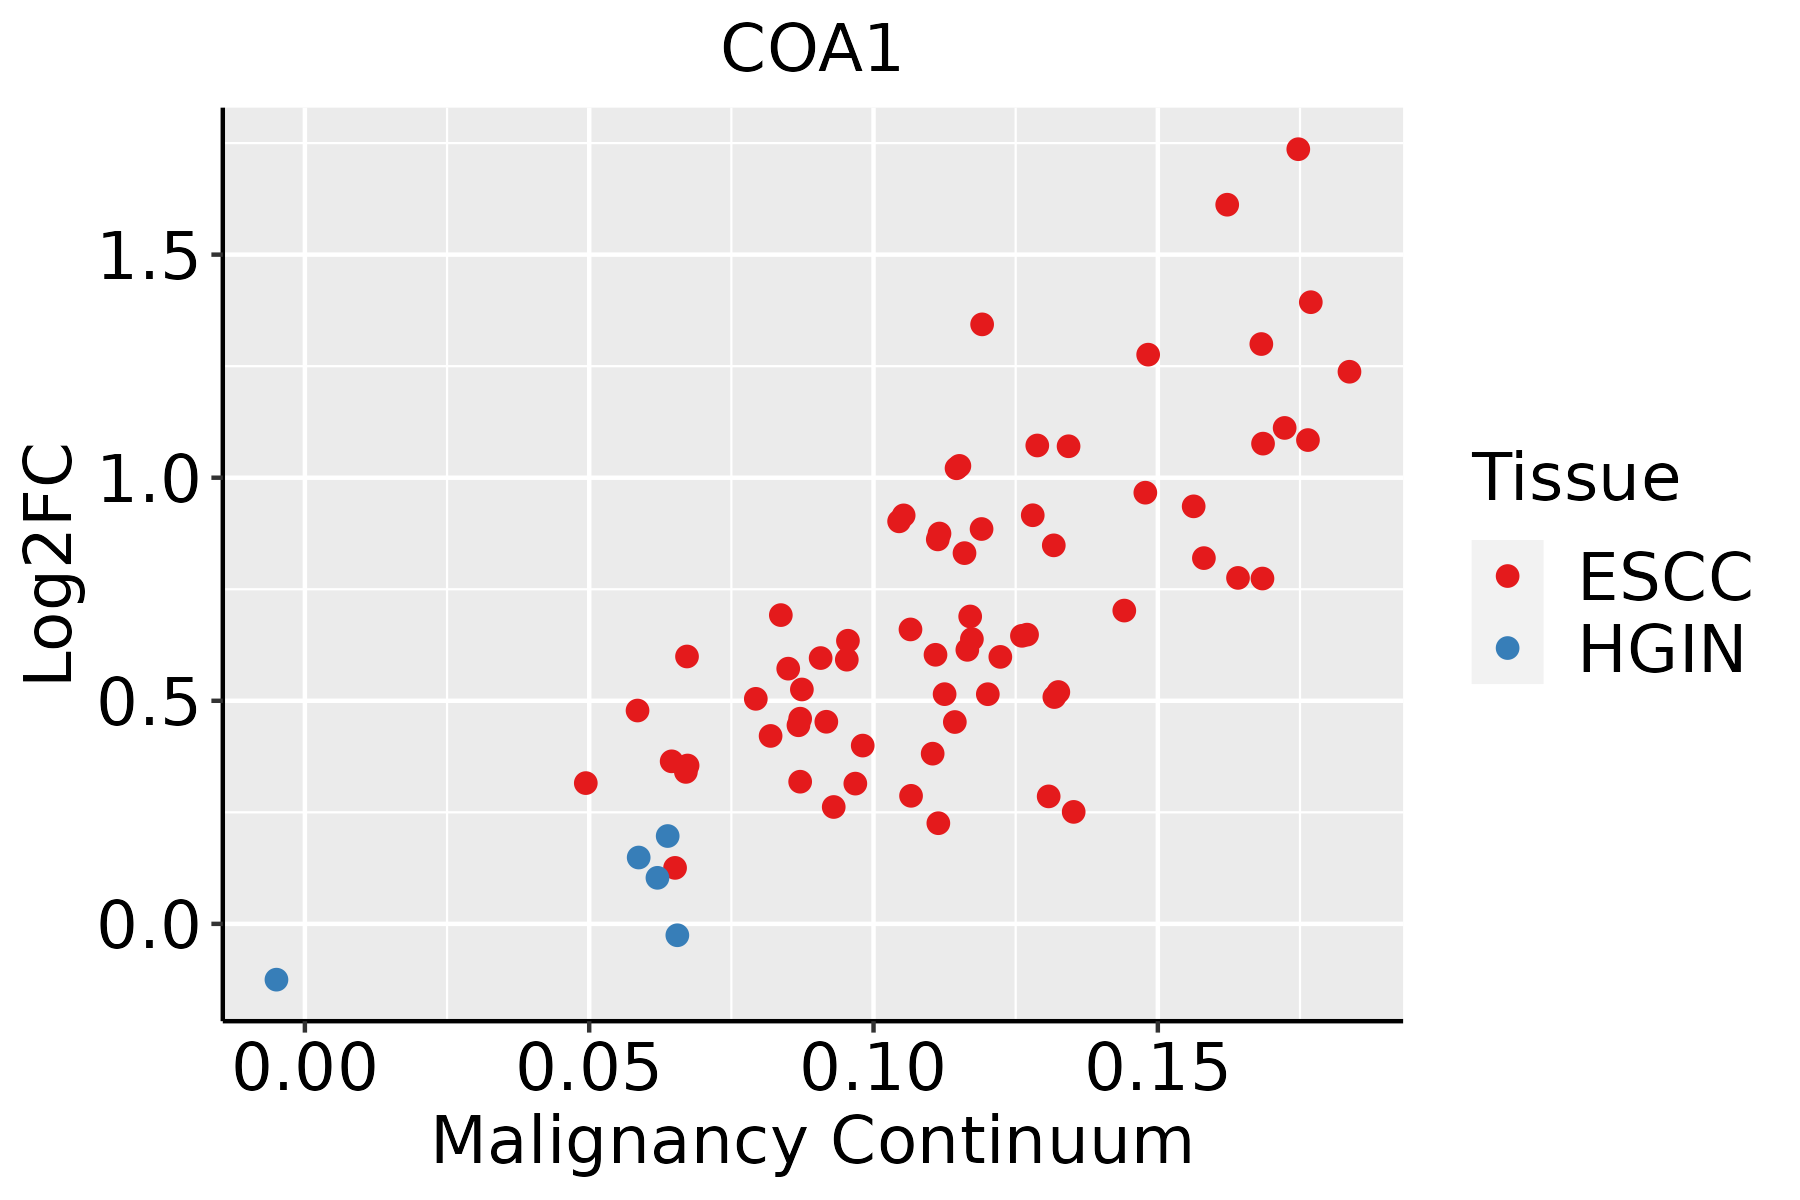 | ESCC: Esophageal squamous cell carcinoma |
| HGIN: High-grade intraepithelial neoplasias | ||
| LGIN: Low-grade intraepithelial neoplasias | ||
| Liver |  | HCC: Hepatocellular carcinoma |
| NAFLD: Non-alcoholic fatty liver disease | ||
| Lung |  | AAH: Atypical adenomatous hyperplasia |
| AIS: Adenocarcinoma in situ | ||
| IAC: Invasive lung adenocarcinoma | ||
| MIA: Minimally invasive adenocarcinoma | ||
| Oral Cavity | 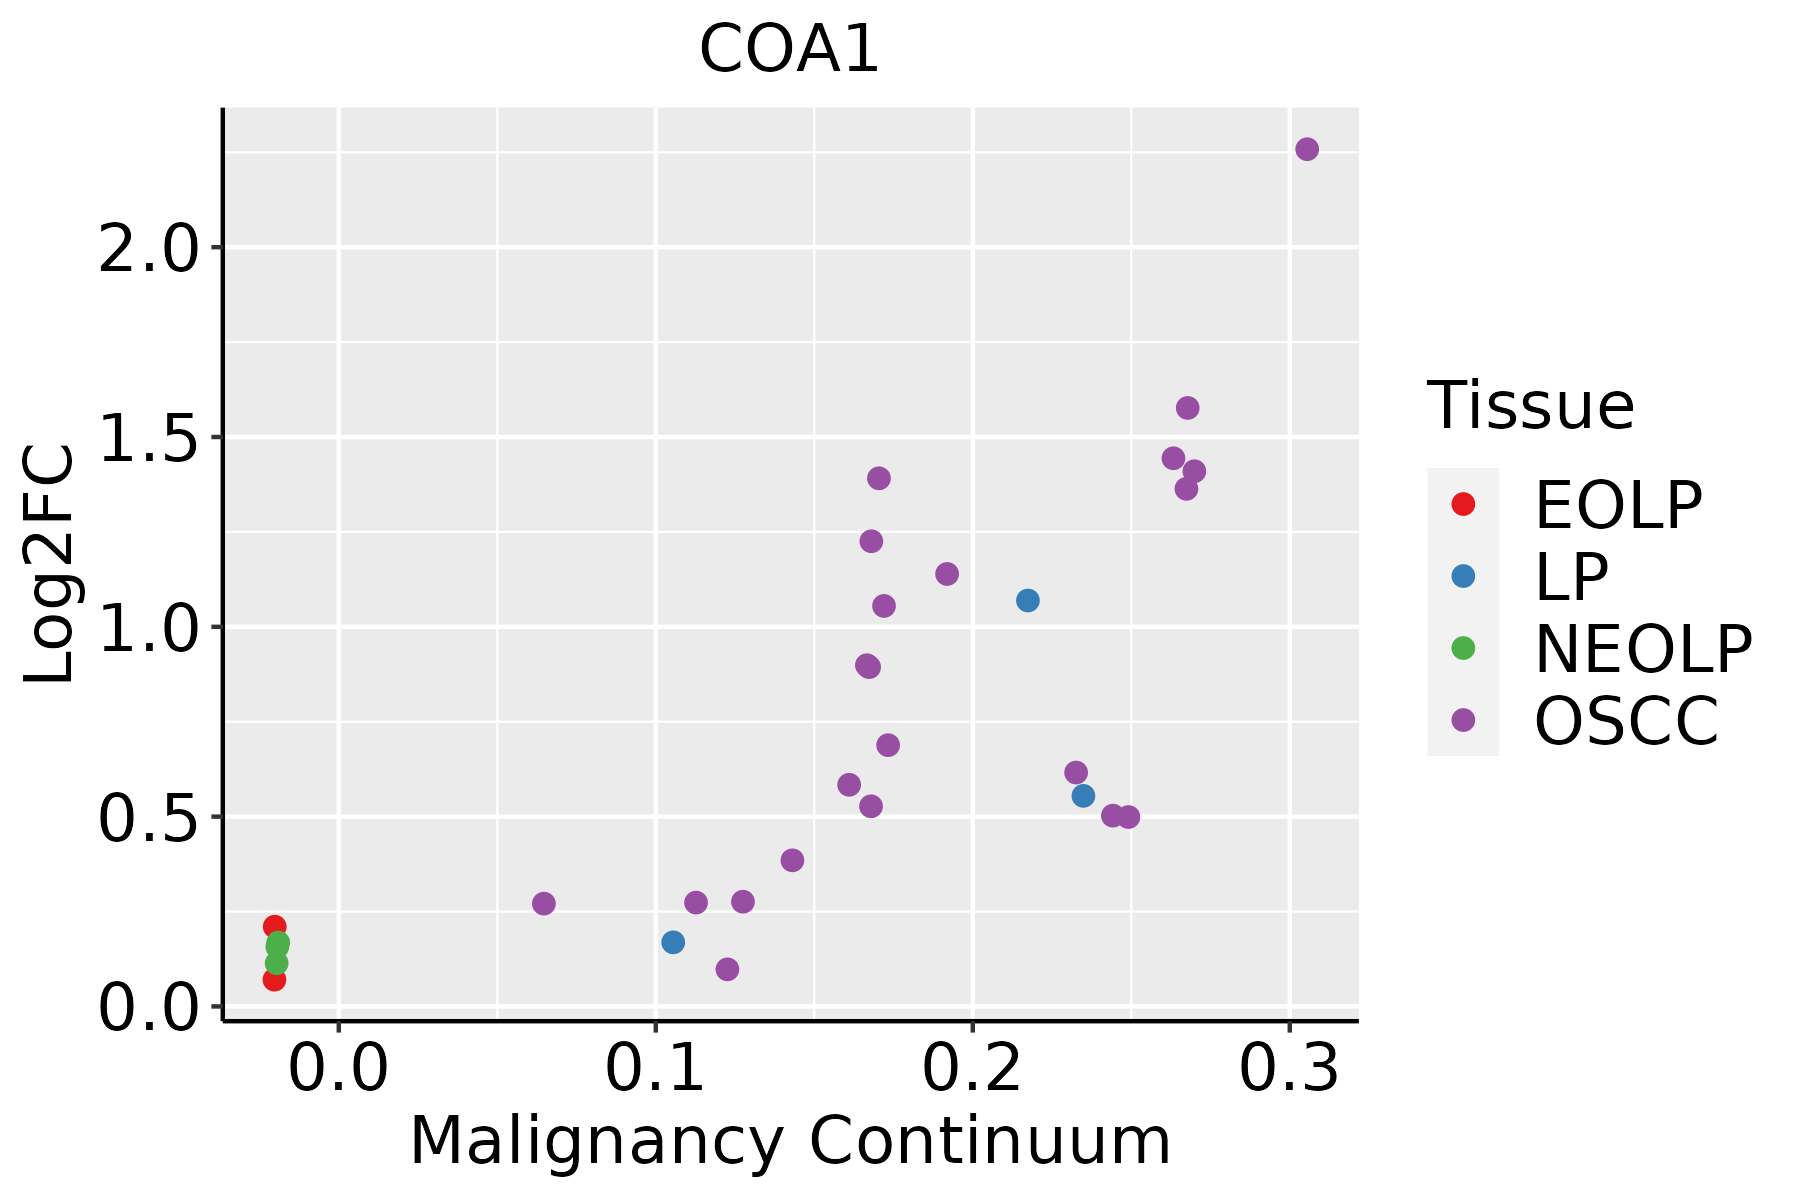 | EOLP: Erosive Oral lichen planus |
| LP: leukoplakia | ||
| NEOLP: Non-erosive oral lichen planus | ||
| OSCC: Oral squamous cell carcinoma | ||
| Skin |  | AK: Actinic keratosis |
| cSCC: Cutaneous squamous cell carcinoma | ||
| SCCIS:squamous cell carcinoma in situ | ||
| Thyroid | 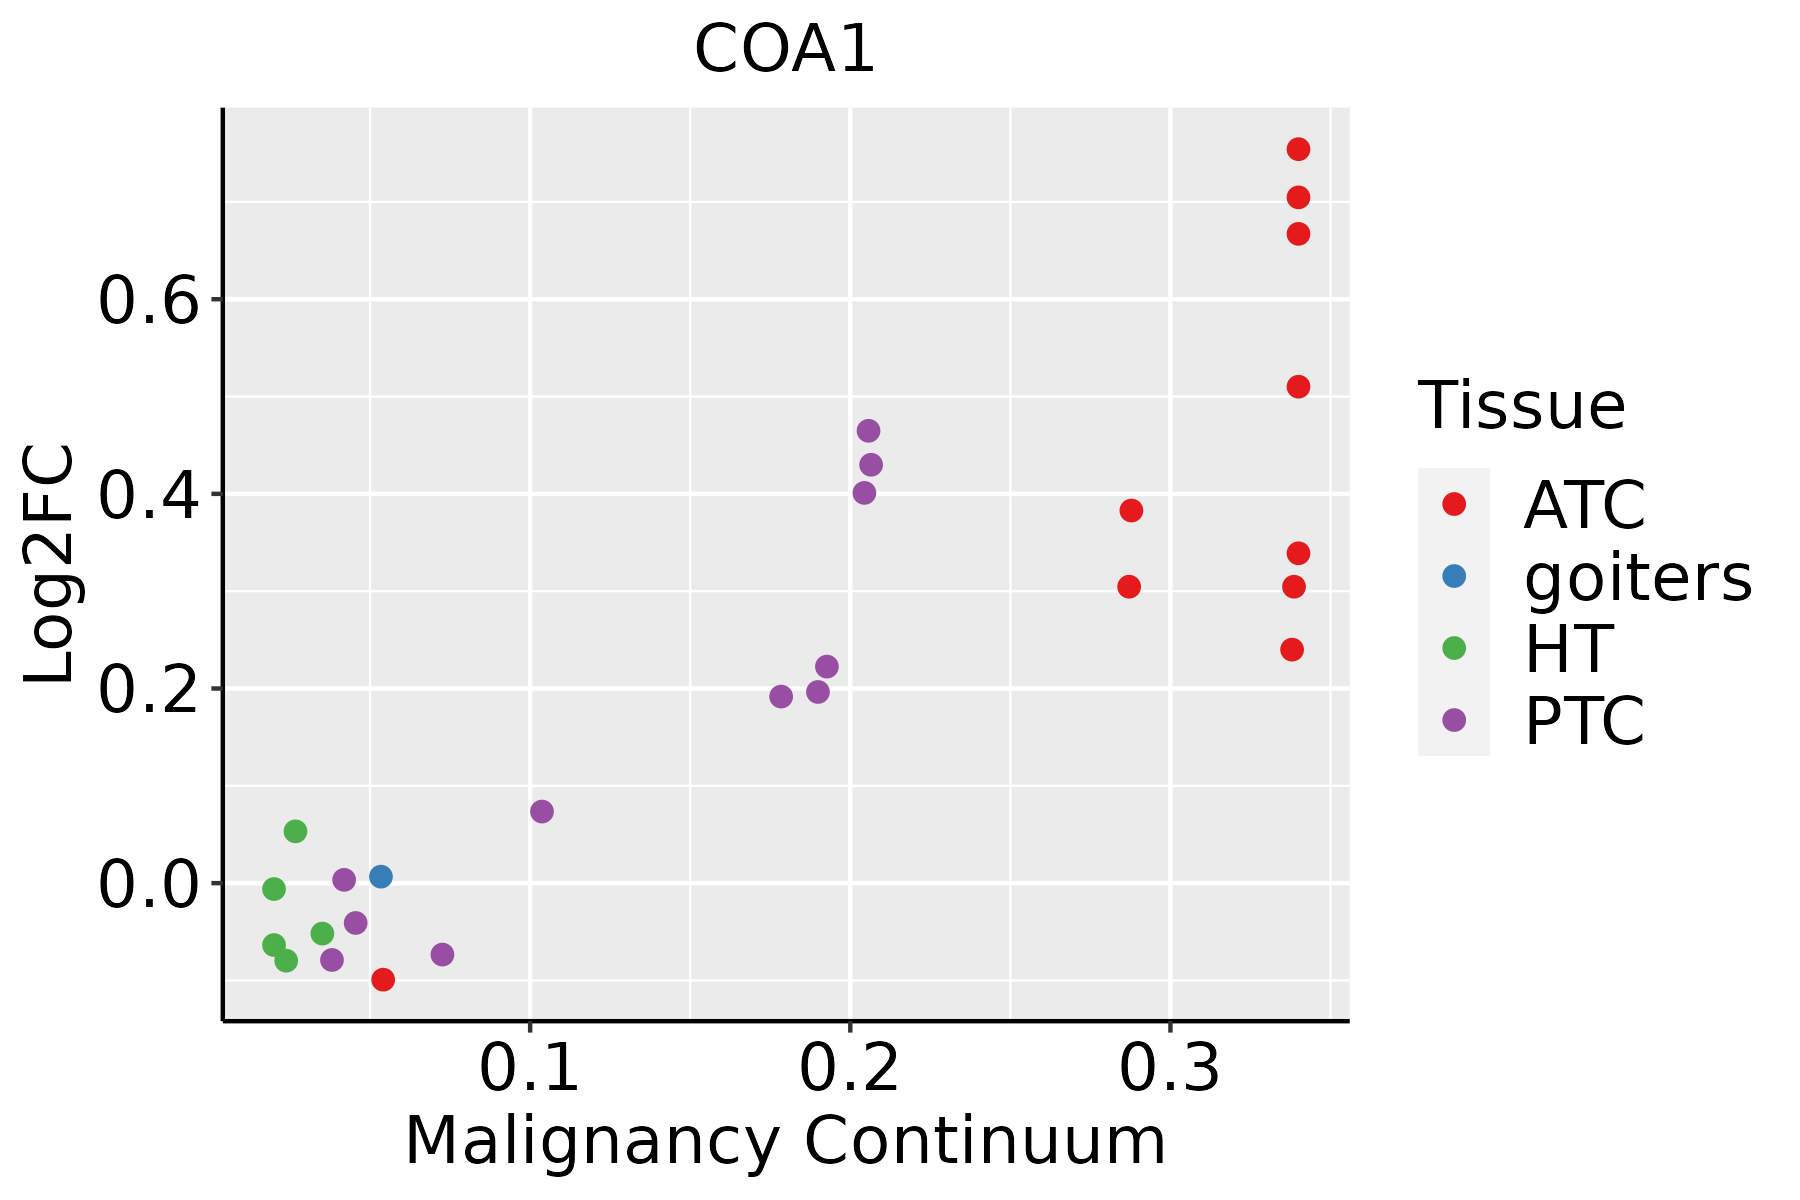 | ATC: Anaplastic thyroid cancer |
| HT: Hashimoto's thyroiditis | ||
| PTC: Papillary thyroid cancer |
| ∗log2FC in expression of this searched gene in stem-like cells from each diseased tissue sample relative to stem-like cells in normal samples in each tissue plotted against the malignancy continuum. Samples are colored based on if they are from different disease stage. |
Top |
Malignant transformation related pathway analysis |
| Find out the enriched GO biological processes and KEGG pathways involved in transition from healthy to precancer to cancer |
| Tissue | Disease Stage | Enriched GO biological Processes |
| Colorectum | AD |  |
| Colorectum | SER |  |
| Colorectum | MSS |  |
| Colorectum | MSI-H |  |
| Colorectum | FAP |  |
| ∗Top 15 enriched GO BP terms are showed in the bar plot of each disease state in each tissue. Each row represents a significant GO biological process which is colored according to the -log10(p.adjust). |
| Page: 1 2 3 4 5 6 7 8 9 |
| GO ID | Tissue | Disease Stage | Description | Gene Ratio | Bg Ratio | pvalue | p.adjust | Count |
| GO:003166912 | Liver | HCC | cellular response to nutrient levels | 130/7958 | 215/18723 | 7.52e-08 | 1.51e-06 | 130 |
| GO:190165422 | Liver | HCC | response to ketone | 119/7958 | 194/18723 | 8.65e-08 | 1.72e-06 | 119 |
| GO:00439671 | Liver | HCC | histone H4 acetylation | 50/7958 | 67/18723 | 9.14e-08 | 1.82e-06 | 50 |
| GO:000170111 | Liver | HCC | in utero embryonic development | 204/7958 | 367/18723 | 2.44e-07 | 4.30e-06 | 204 |
| GO:00170041 | Liver | HCC | cytochrome complex assembly | 30/7958 | 36/18723 | 5.69e-07 | 9.03e-06 | 30 |
| GO:000941022 | Liver | HCC | response to xenobiotic stimulus | 248/7958 | 462/18723 | 6.47e-07 | 1.02e-05 | 248 |
| GO:00336171 | Liver | HCC | mitochondrial cytochrome c oxidase assembly | 20/7958 | 22/18723 | 3.00e-06 | 3.98e-05 | 20 |
| GO:00085351 | Liver | HCC | respiratory chain complex IV assembly | 22/7958 | 26/18723 | 1.23e-05 | 1.39e-04 | 22 |
| GO:000975521 | Liver | HCC | hormone-mediated signaling pathway | 106/7958 | 190/18723 | 1.45e-04 | 1.17e-03 | 106 |
| GO:00323552 | Liver | HCC | response to estradiol | 81/7958 | 141/18723 | 2.39e-04 | 1.79e-03 | 81 |
| GO:004851121 | Liver | HCC | rhythmic process | 156/7958 | 298/18723 | 3.54e-04 | 2.46e-03 | 156 |
| GO:000189211 | Liver | HCC | embryonic placenta development | 50/7958 | 82/18723 | 5.62e-04 | 3.61e-03 | 50 |
| GO:000189011 | Liver | HCC | placenta development | 81/7958 | 144/18723 | 5.91e-04 | 3.75e-03 | 81 |
| GO:005087822 | Liver | HCC | regulation of body fluid levels | 191/7958 | 379/18723 | 1.06e-03 | 6.11e-03 | 191 |
| GO:00606694 | Liver | HCC | embryonic placenta morphogenesis | 19/7958 | 26/18723 | 1.57e-03 | 8.23e-03 | 19 |
| GO:00325701 | Liver | HCC | response to progesterone | 25/7958 | 37/18723 | 1.82e-03 | 9.38e-03 | 25 |
| GO:00308795 | Liver | HCC | mammary gland development | 75/7958 | 137/18723 | 2.52e-03 | 1.22e-02 | 75 |
| GO:00714662 | Liver | HCC | cellular response to xenobiotic stimulus | 93/7958 | 177/18723 | 4.35e-03 | 1.89e-02 | 93 |
| GO:00075951 | Liver | HCC | lactation | 29/7958 | 47/18723 | 6.16e-03 | 2.52e-02 | 29 |
| GO:00607114 | Liver | HCC | labyrinthine layer development | 27/7958 | 44/18723 | 8.98e-03 | 3.46e-02 | 27 |
| Page: 1 2 3 4 5 6 7 8 9 10 11 12 13 14 15 16 17 18 19 20 21 22 23 24 25 26 27 28 29 30 31 32 33 34 35 36 37 38 |
| Pathway ID | Tissue | Disease Stage | Description | Gene Ratio | Bg Ratio | pvalue | p.adjust | qvalue | Count |
| hsa0471439 | Esophagus | HGIN | Thermogenesis | 91/1383 | 232/8465 | 1.97e-17 | 5.36e-16 | 4.25e-16 | 91 |
| hsa04714114 | Esophagus | HGIN | Thermogenesis | 91/1383 | 232/8465 | 1.97e-17 | 5.36e-16 | 4.25e-16 | 91 |
| hsa04714211 | Esophagus | ESCC | Thermogenesis | 163/4205 | 232/8465 | 9.22e-11 | 1.14e-09 | 5.86e-10 | 163 |
| hsa04714310 | Esophagus | ESCC | Thermogenesis | 163/4205 | 232/8465 | 9.22e-11 | 1.14e-09 | 5.86e-10 | 163 |
| hsa0471414 | Liver | Cirrhotic | Thermogenesis | 121/2530 | 232/8465 | 5.70e-13 | 1.36e-11 | 8.36e-12 | 121 |
| hsa0471415 | Liver | Cirrhotic | Thermogenesis | 121/2530 | 232/8465 | 5.70e-13 | 1.36e-11 | 8.36e-12 | 121 |
| hsa0471422 | Liver | HCC | Thermogenesis | 170/4020 | 232/8465 | 5.36e-16 | 2.25e-14 | 1.25e-14 | 170 |
| hsa0471432 | Liver | HCC | Thermogenesis | 170/4020 | 232/8465 | 5.36e-16 | 2.25e-14 | 1.25e-14 | 170 |
| hsa0471416 | Lung | IAC | Thermogenesis | 46/1053 | 232/8465 | 7.85e-04 | 6.38e-03 | 4.23e-03 | 46 |
| hsa0471417 | Lung | IAC | Thermogenesis | 46/1053 | 232/8465 | 7.85e-04 | 6.38e-03 | 4.23e-03 | 46 |
| hsa0471423 | Lung | AIS | Thermogenesis | 43/961 | 232/8465 | 7.36e-04 | 6.28e-03 | 4.02e-03 | 43 |
| hsa0471433 | Lung | AIS | Thermogenesis | 43/961 | 232/8465 | 7.36e-04 | 6.28e-03 | 4.02e-03 | 43 |
| hsa0471430 | Oral cavity | OSCC | Thermogenesis | 138/3704 | 232/8465 | 7.67e-07 | 4.35e-06 | 2.22e-06 | 138 |
| hsa04714113 | Oral cavity | OSCC | Thermogenesis | 138/3704 | 232/8465 | 7.67e-07 | 4.35e-06 | 2.22e-06 | 138 |
| hsa04714210 | Oral cavity | LP | Thermogenesis | 105/2418 | 232/8465 | 3.14e-08 | 4.98e-07 | 3.21e-07 | 105 |
| hsa0471438 | Oral cavity | LP | Thermogenesis | 105/2418 | 232/8465 | 3.14e-08 | 4.98e-07 | 3.21e-07 | 105 |
| hsa0471445 | Oral cavity | EOLP | Thermogenesis | 54/1218 | 232/8465 | 1.66e-04 | 7.16e-04 | 4.22e-04 | 54 |
| hsa0471455 | Oral cavity | EOLP | Thermogenesis | 54/1218 | 232/8465 | 1.66e-04 | 7.16e-04 | 4.22e-04 | 54 |
| Page: 1 |
Top |
Cell-cell communication analysis |
| Identification of potential cell-cell interactions between two cell types and their ligand-receptor pairs for different disease states |
| Ligand | Receptor | LRpair | Pathway | Tissue | Disease Stage |
| Page: 1 |
Top |
Single-cell gene regulatory network inference analysis |
| Find out the significant the regulons (TFs) and the target genes of each regulon across cell types for different disease states |
| TF | Cell Type | Tissue | Disease Stage | Target Gene | RSS | Regulon Activity |
| ∗The dot plots of a searched regulon are shown for all cell subpopulations in each disease state of each tissue based on the regulon specific score inferred using pySCENIC and by calculating the average expression. |
| Page: 1 |
Top |
Somatic mutation of malignant transformation related genes |
| Annotation of somatic variants for genes involved in malignant transformation |
| Hugo Symbol | Variant Class | Variant Classification | dbSNP RS | HGVSc | HGVSp | HGVSp Short | SWISSPROT | BIOTYPE | SIFT | PolyPhen | Tumor Sample Barcode | Tissue | Histology | Sex | Age | Stage | Therapy Types | Drugs | Outcome |
| COA1 | SNV | Missense_Mutation | novel | c.355G>A | p.Glu119Lys | p.E119K | Q9GZY4 | protein_coding | deleterious(0) | possibly_damaging(0.751) | TCGA-AN-A046-01 | Breast | breast invasive carcinoma | Female | >=65 | I/II | Unknown | Unknown | SD |
| COA1 | SNV | Missense_Mutation | c.229G>A | p.Asp77Asn | p.D77N | Q9GZY4 | protein_coding | deleterious(0.03) | probably_damaging(0.91) | TCGA-BH-A2L8-01 | Breast | breast invasive carcinoma | Female | <65 | I/II | Chemotherapy | cytoxan | CR | |
| COA1 | insertion | In_Frame_Ins | novel | c.340_341insAAGGAGTAGAGACGACCCAGAAGACCCAGCTTGCTTCTAGTCCAT | p.Arg114delinsLysGlyValGluThrThrGlnLysThrGlnLeuAlaSerSerProTrp | p.R114delinsKGVETTQKTQLASSPW | Q9GZY4 | protein_coding | TCGA-A8-A07J-01 | Breast | breast invasive carcinoma | Female | <65 | I/II | Chemotherapy | 5-fluorouracil | CR | ||
| COA1 | SNV | Missense_Mutation | novel | c.247G>A | p.Asp83Asn | p.D83N | Q9GZY4 | protein_coding | deleterious(0.04) | possibly_damaging(0.833) | TCGA-2W-A8YY-01 | Cervix | cervical & endocervical cancer | Female | <65 | I/II | Chemotherapy | cisplatin | CR |
| COA1 | SNV | Missense_Mutation | c.146T>C | p.Leu49Ser | p.L49S | Q9GZY4 | protein_coding | tolerated(0.11) | benign(0.079) | TCGA-AZ-6601-01 | Colorectum | colon adenocarcinoma | Male | >=65 | I/II | Unknown | Unknown | PD | |
| COA1 | SNV | Missense_Mutation | rs140065703 | c.82N>A | p.Gly28Arg | p.G28R | Q9GZY4 | protein_coding | deleterious(0) | probably_damaging(0.946) | TCGA-CK-5916-01 | Colorectum | colon adenocarcinoma | Female | >=65 | I/II | Unknown | Unknown | PD |
| COA1 | insertion | Frame_Shift_Ins | novel | c.365_366insT | p.Leu122PhefsTer20 | p.L122Ffs*20 | Q9GZY4 | protein_coding | TCGA-G4-6628-01 | Colorectum | colon adenocarcinoma | Male | >=65 | I/II | Unknown | Unknown | SD | ||
| COA1 | SNV | Missense_Mutation | c.229N>T | p.Asp77Tyr | p.D77Y | Q9GZY4 | protein_coding | deleterious(0) | probably_damaging(0.987) | TCGA-B5-A0JY-01 | Endometrium | uterine corpus endometrioid carcinoma | Female | <65 | III/IV | Chemotherapy | doxorubicin | SD | |
| COA1 | SNV | Missense_Mutation | rs751652291 | c.32N>A | p.Arg11Gln | p.R11Q | Q9GZY4 | protein_coding | tolerated(0.67) | benign(0) | TCGA-D1-A16X-01 | Endometrium | uterine corpus endometrioid carcinoma | Female | <65 | I/II | Unknown | Unknown | SD |
| COA1 | SNV | Missense_Mutation | c.229G>A | p.Asp77Asn | p.D77N | Q9GZY4 | protein_coding | deleterious(0.03) | probably_damaging(0.91) | TCGA-D1-A2G5-01 | Endometrium | uterine corpus endometrioid carcinoma | Female | <65 | I/II | Unknown | Unknown | PD |
| Page: 1 2 |
Top |
Related drugs of malignant transformation related genes |
| Identification of chemicals and drugs interact with genes involved in malignant transfromation |
| (DGIdb 4.0) |
| Entrez ID | Symbol | Category | Interaction Types | Drug Claim Name | Drug Name | PMIDs |
| Page: 1 |

Copyright 2023-Present -The University of Texas Health Science Center at Houston |