
|
|||||
|
 | |
| |
| |
| |
| |
| |
|
Gene: ARF6 |
Gene summary for ARF6 |
| Gene information | Species | Human | Gene symbol | ARF6 | Gene ID | 382 |
| Gene name | ADP ribosylation factor 6 | |
| Gene Alias | ARF6 | |
| Cytomap | 14q21.3 | |
| Gene Type | protein-coding | GO ID | GO:0001667 | UniProtAcc | P62330 |
Top |
Malignant transformation analysis |
| Identification of the aberrant gene expression in precancerous and cancerous lesions by comparing the gene expression of stem-like cells in diseased tissues with normal stem cells |
| Entrez ID | Symbol | Replicates | Species | Organ | Tissue | Adj P-value | Log2FC | Malignancy |
| 382 | ARF6 | GSM4909281 | Human | Breast | IDC | 1.30e-03 | 3.33e-01 | 0.21 |
| 382 | ARF6 | GSM4909282 | Human | Breast | IDC | 5.60e-22 | 6.81e-01 | -0.0288 |
| 382 | ARF6 | GSM4909285 | Human | Breast | IDC | 1.32e-03 | 1.07e-01 | 0.21 |
| 382 | ARF6 | GSM4909288 | Human | Breast | IDC | 1.22e-02 | -2.72e-01 | 0.0988 |
| 382 | ARF6 | GSM4909290 | Human | Breast | IDC | 1.11e-04 | 4.35e-01 | 0.2096 |
| 382 | ARF6 | GSM4909296 | Human | Breast | IDC | 5.30e-07 | -1.72e-01 | 0.1524 |
| 382 | ARF6 | GSM4909297 | Human | Breast | IDC | 1.98e-28 | 3.81e-01 | 0.1517 |
| 382 | ARF6 | GSM4909301 | Human | Breast | IDC | 7.27e-04 | -3.33e-01 | 0.1577 |
| 382 | ARF6 | GSM4909311 | Human | Breast | IDC | 9.79e-29 | -3.89e-01 | 0.1534 |
| 382 | ARF6 | GSM4909312 | Human | Breast | IDC | 3.77e-07 | -4.08e-02 | 0.1552 |
| 382 | ARF6 | GSM4909319 | Human | Breast | IDC | 8.04e-35 | -2.27e-01 | 0.1563 |
| 382 | ARF6 | GSM4909320 | Human | Breast | IDC | 7.39e-06 | -3.93e-01 | 0.1575 |
| 382 | ARF6 | GSM4909321 | Human | Breast | IDC | 6.08e-10 | 4.39e-03 | 0.1559 |
| 382 | ARF6 | brca2 | Human | Breast | Precancer | 4.13e-02 | 1.24e-01 | -0.024 |
| 382 | ARF6 | brca3 | Human | Breast | Precancer | 2.42e-03 | 2.15e-01 | -0.0263 |
| 382 | ARF6 | NCCBC14 | Human | Breast | DCIS | 6.02e-05 | -4.03e-02 | 0.2021 |
| 382 | ARF6 | NCCBC5 | Human | Breast | DCIS | 2.39e-05 | -4.32e-02 | 0.2046 |
| 382 | ARF6 | NCCBC6 | Human | Breast | DCIS | 8.97e-09 | 6.33e-01 | 0.2095 |
| 382 | ARF6 | P1 | Human | Breast | IDC | 8.80e-13 | -2.21e-01 | 0.1527 |
| 382 | ARF6 | DCIS2 | Human | Breast | DCIS | 7.89e-51 | 1.69e-01 | 0.0085 |
| Page: 1 2 3 4 5 6 7 8 9 10 11 12 |
| Tissue | Expression Dynamics | Abbreviation |
| Breast |  | IDC: Invasive ductal carcinoma |
| DCIS: Ductal carcinoma in situ | ||
| Precancer(BRCA1-mut): Precancerous lesion from BRCA1 mutation carriers | ||
| Cervix |  | CC: Cervix cancer |
| HSIL_HPV: HPV-infected high-grade squamous intraepithelial lesions | ||
| N_HPV: HPV-infected normal cervix | ||
| Colorectum (GSE201348) |  | FAP: Familial adenomatous polyposis |
| CRC: Colorectal cancer | ||
| Colorectum (HTA11) |  | AD: Adenomas |
| SER: Sessile serrated lesions | ||
| MSI-H: Microsatellite-high colorectal cancer | ||
| MSS: Microsatellite stable colorectal cancer | ||
| Esophagus | 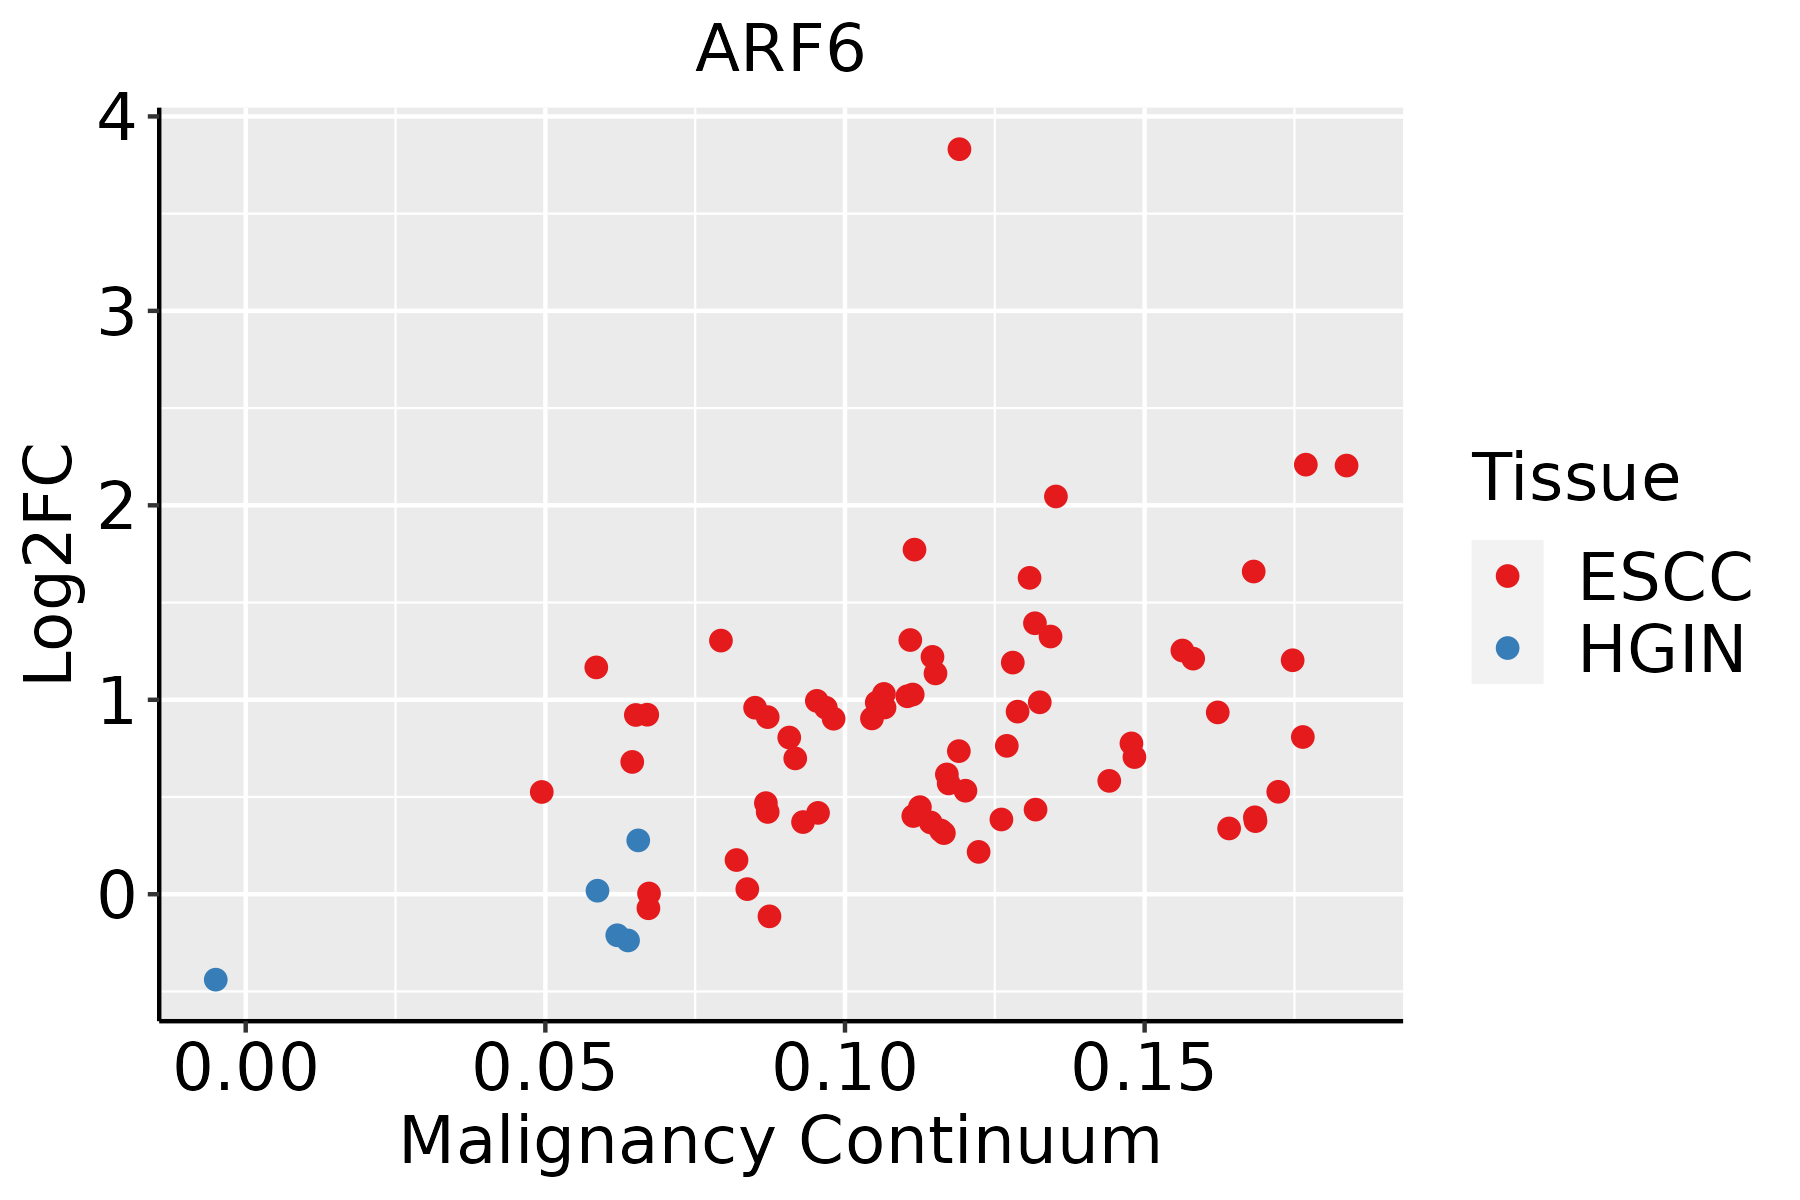 | ESCC: Esophageal squamous cell carcinoma |
| HGIN: High-grade intraepithelial neoplasias | ||
| LGIN: Low-grade intraepithelial neoplasias | ||
| GC | 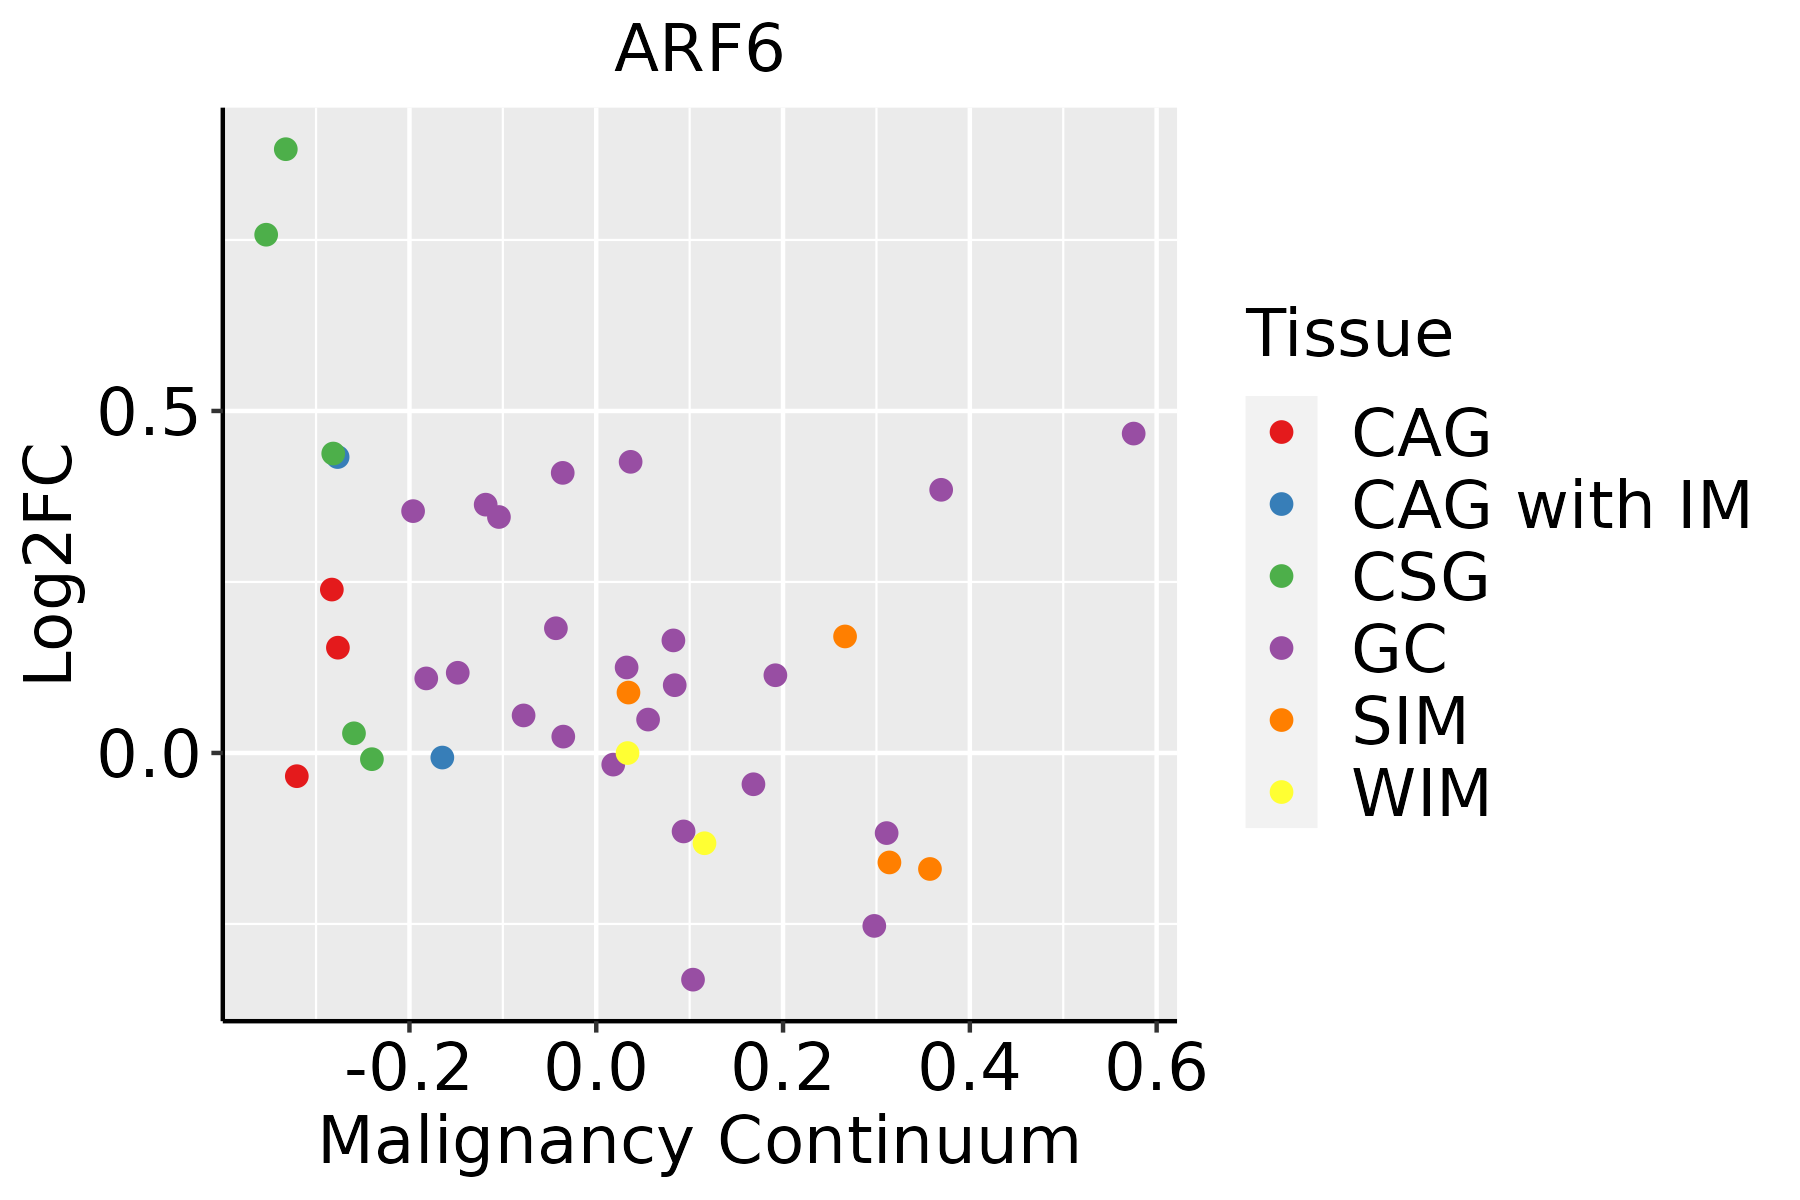 | CAG: Chronic atrophic gastritis |
| CAG with IM: Chronic atrophic gastritis with intestinal metaplasia | ||
| CSG: Chronic superficial gastritis | ||
| GC: Gastric cancer | ||
| SIM: Severe intestinal metaplasia | ||
| WIM: Wild intestinal metaplasia | ||
| Liver | 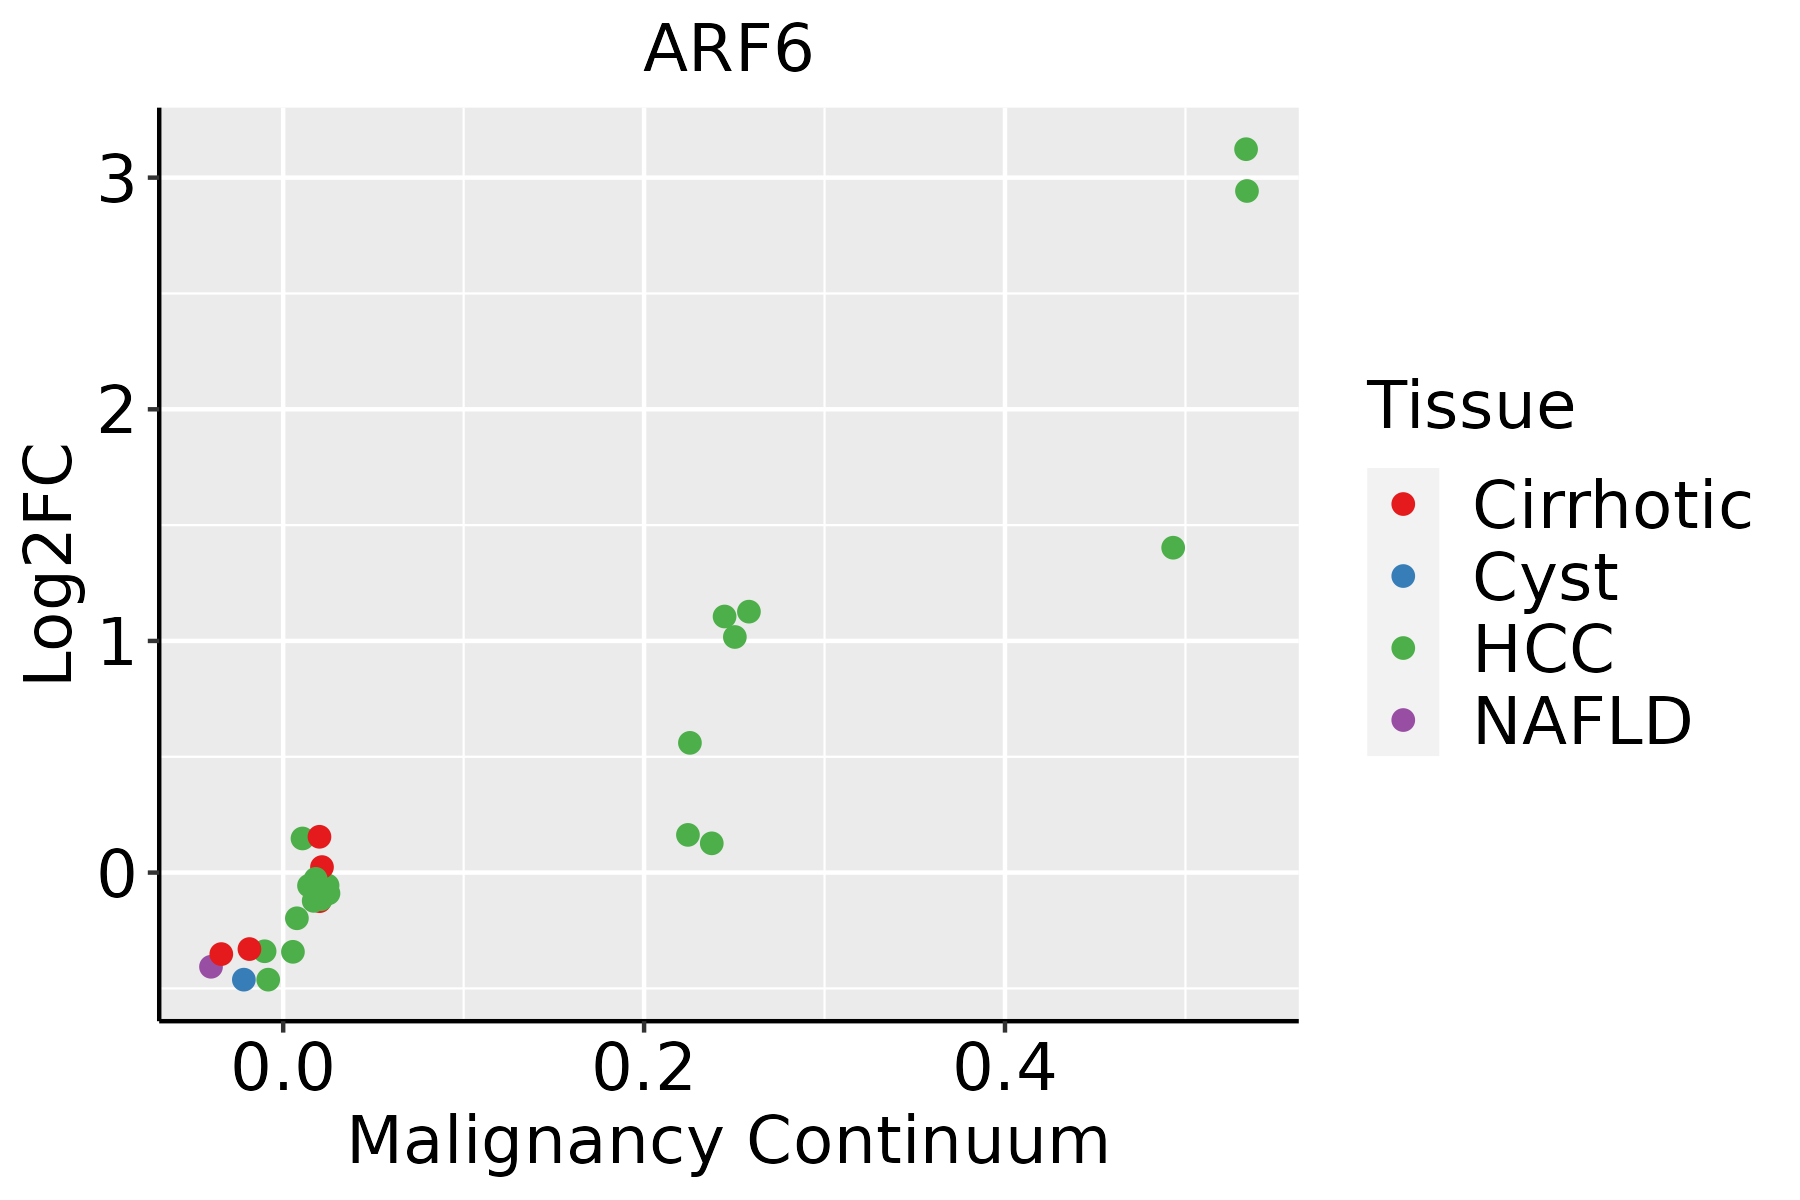 | HCC: Hepatocellular carcinoma |
| NAFLD: Non-alcoholic fatty liver disease | ||
| Oral Cavity | 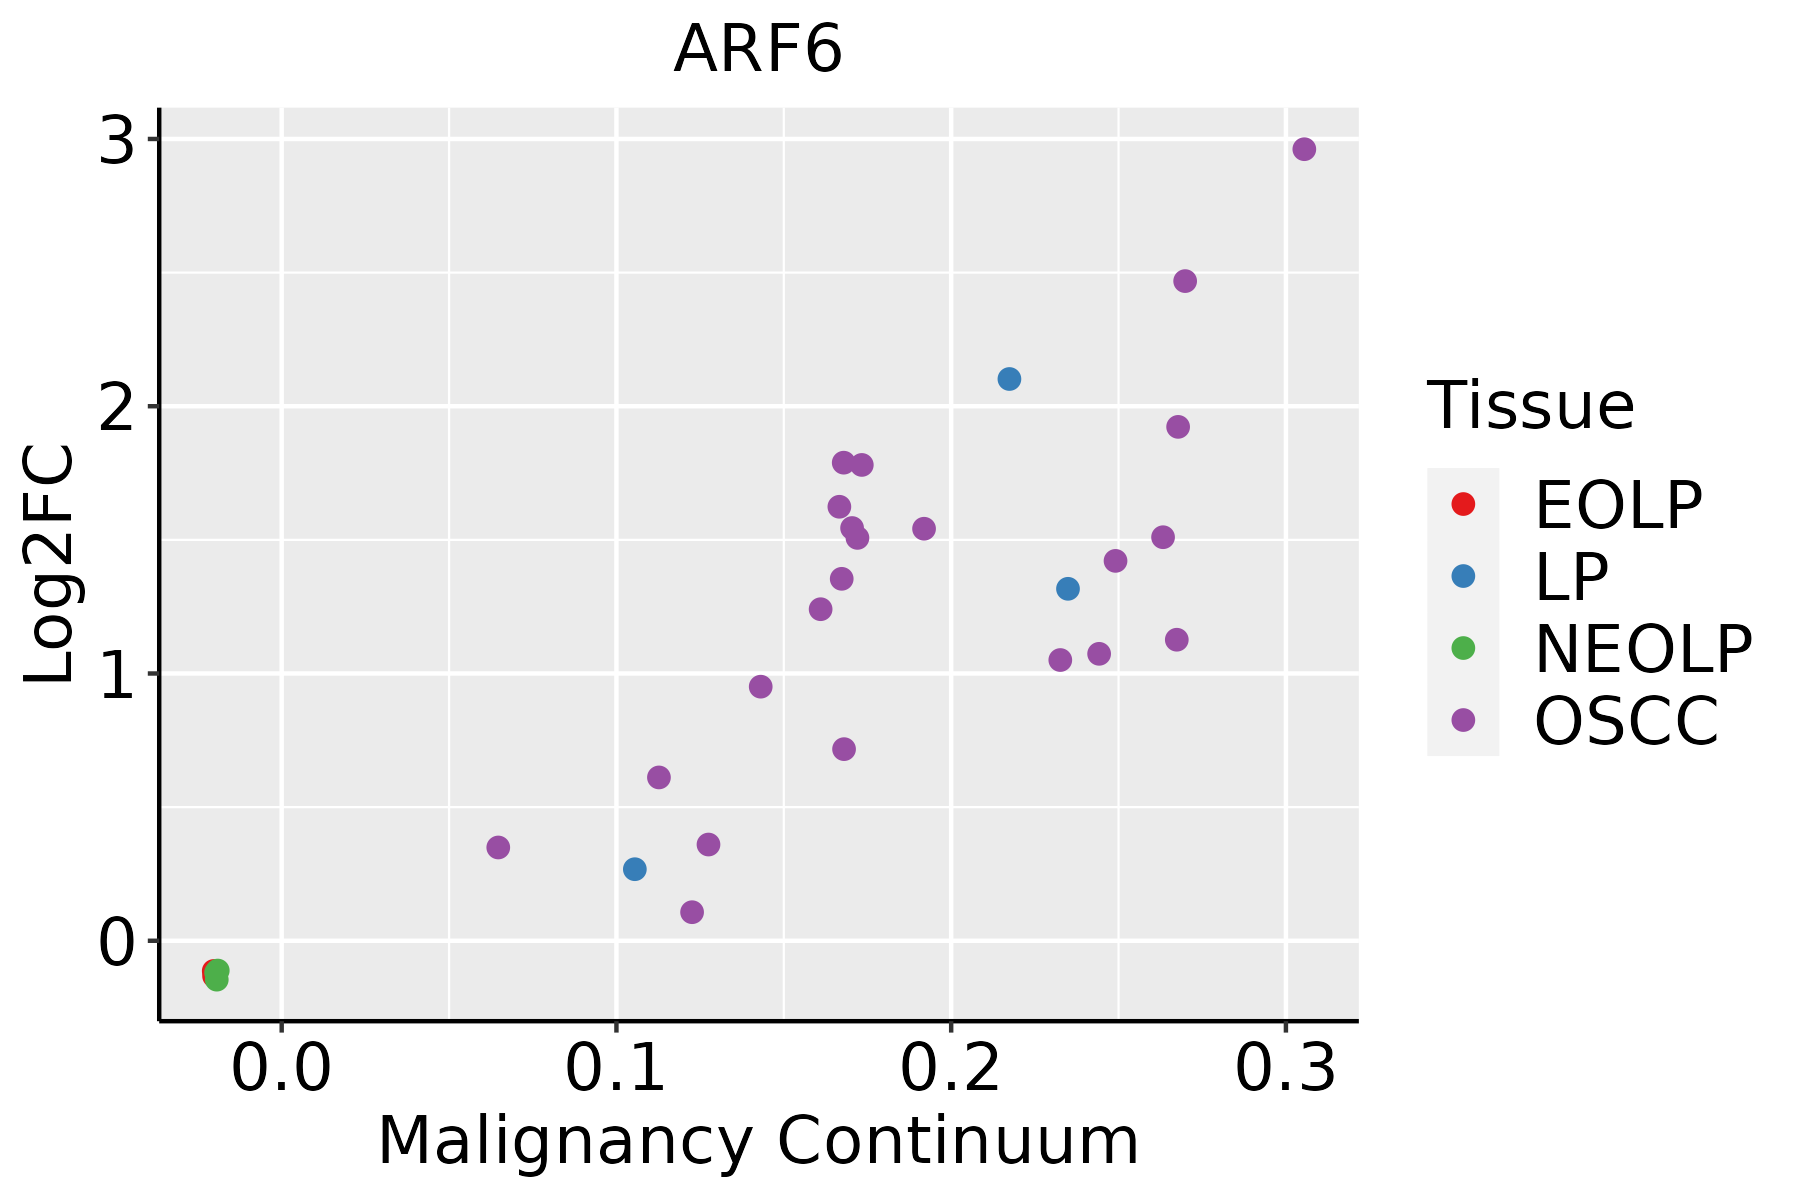 | EOLP: Erosive Oral lichen planus |
| LP: leukoplakia | ||
| NEOLP: Non-erosive oral lichen planus | ||
| OSCC: Oral squamous cell carcinoma | ||
| Prostate | 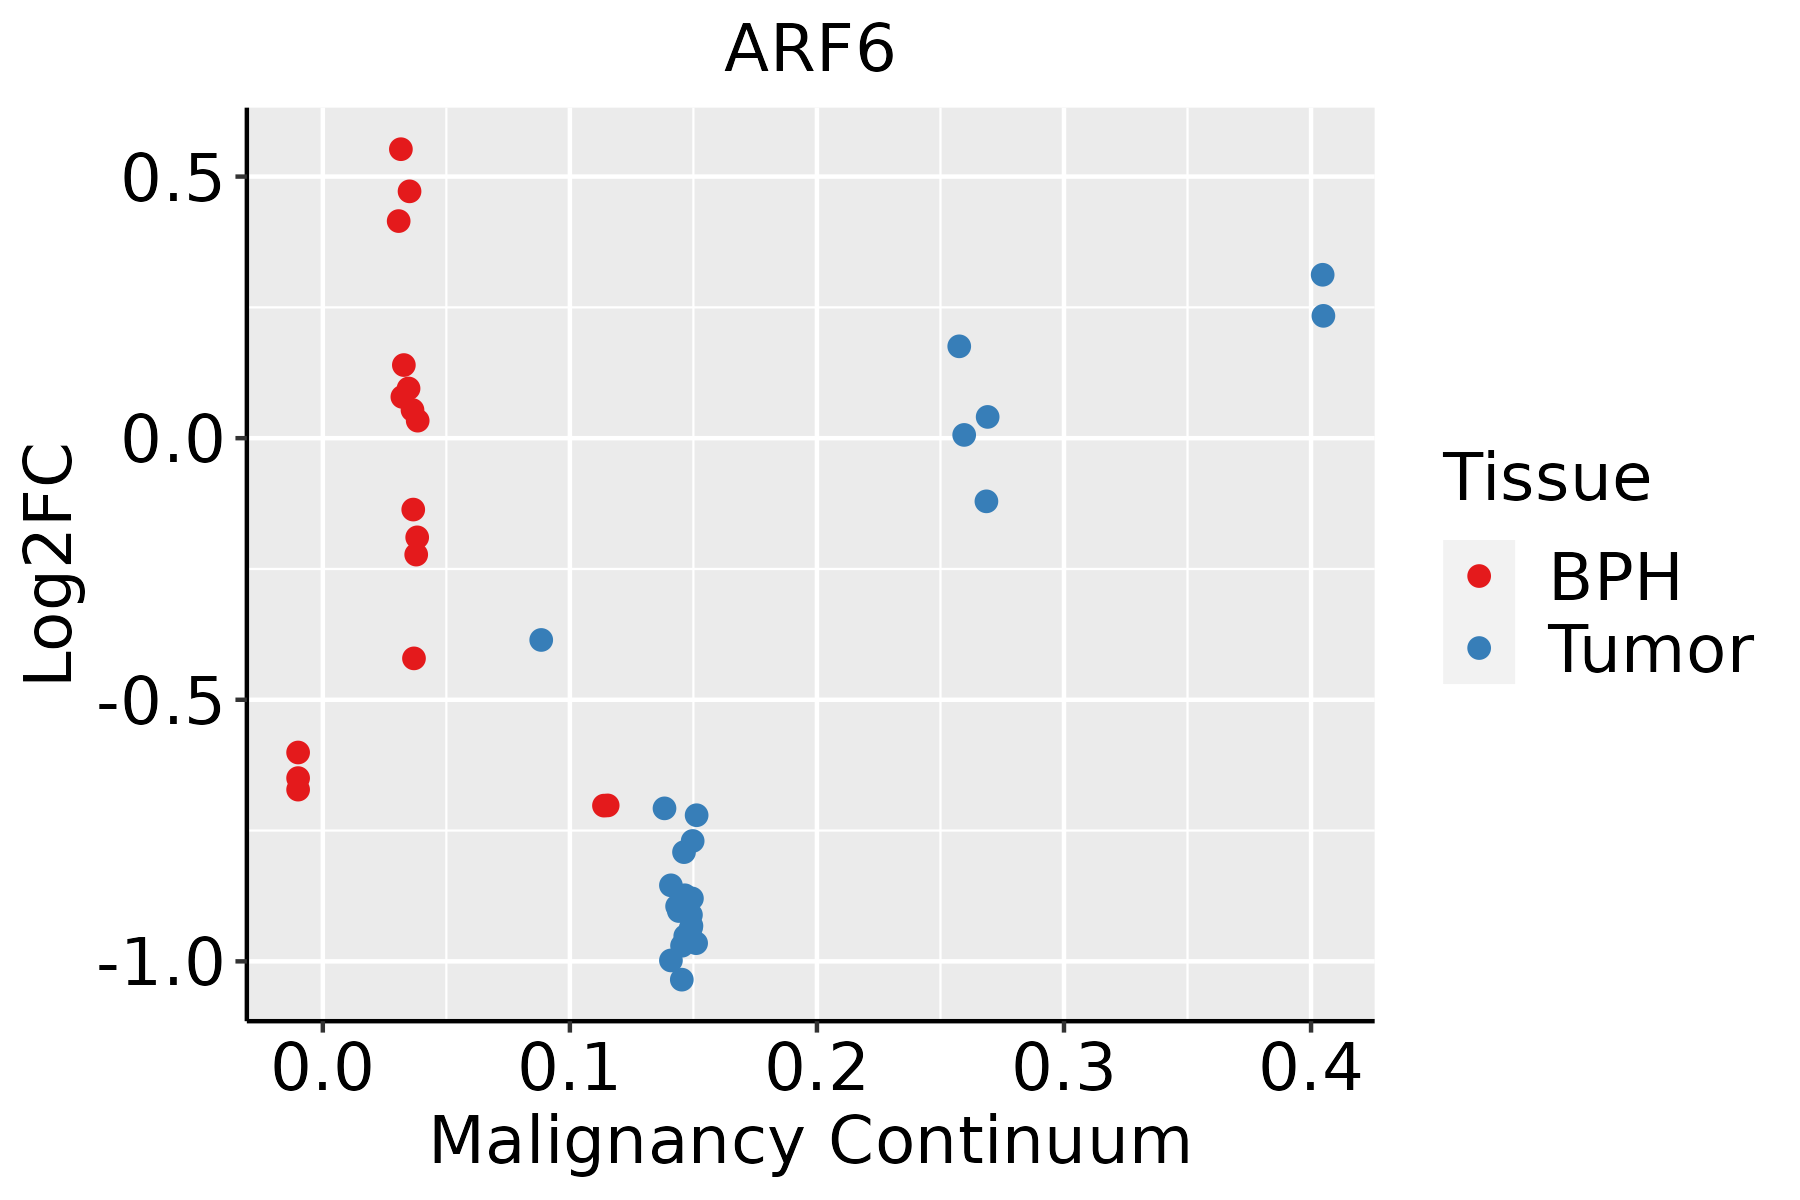 | BPH: Benign Prostatic Hyperplasia |
| Skin | 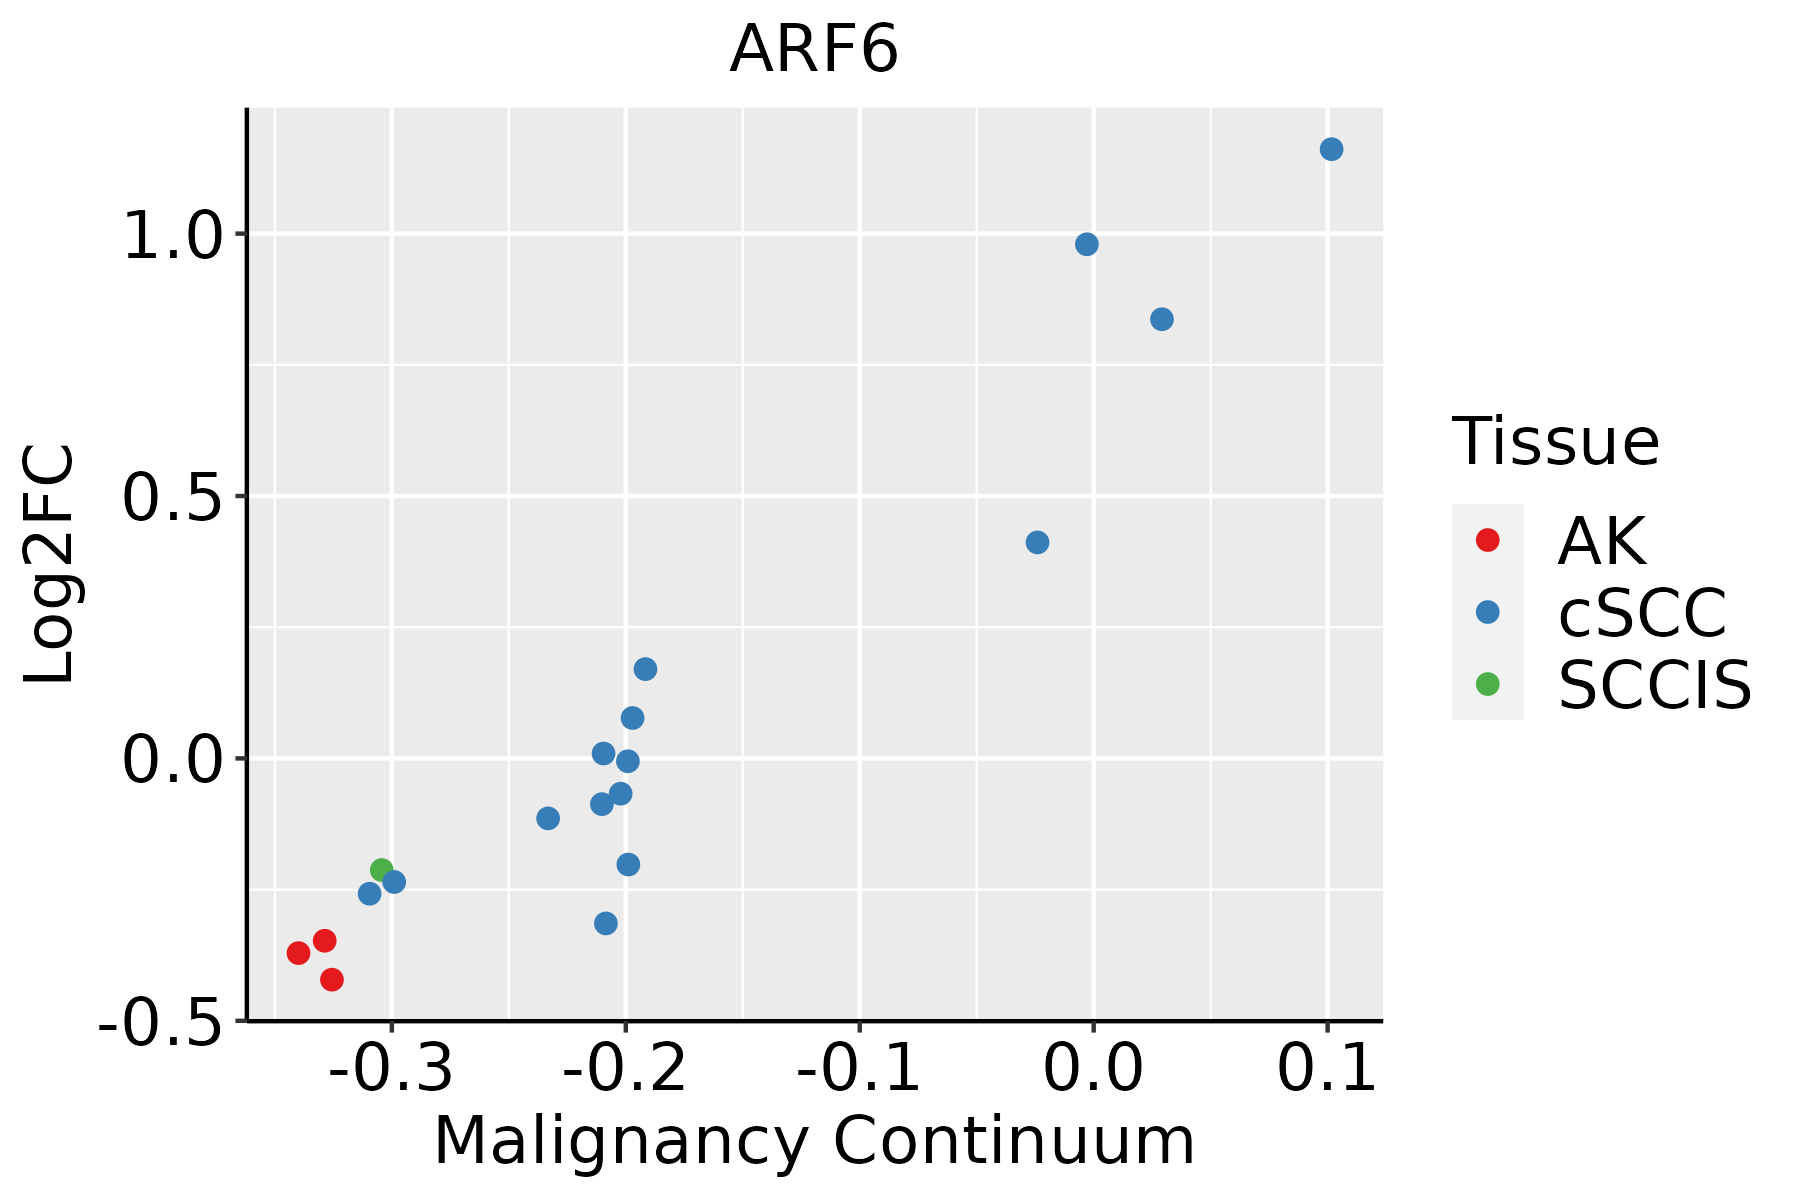 | AK: Actinic keratosis |
| cSCC: Cutaneous squamous cell carcinoma | ||
| SCCIS:squamous cell carcinoma in situ | ||
| Thyroid | 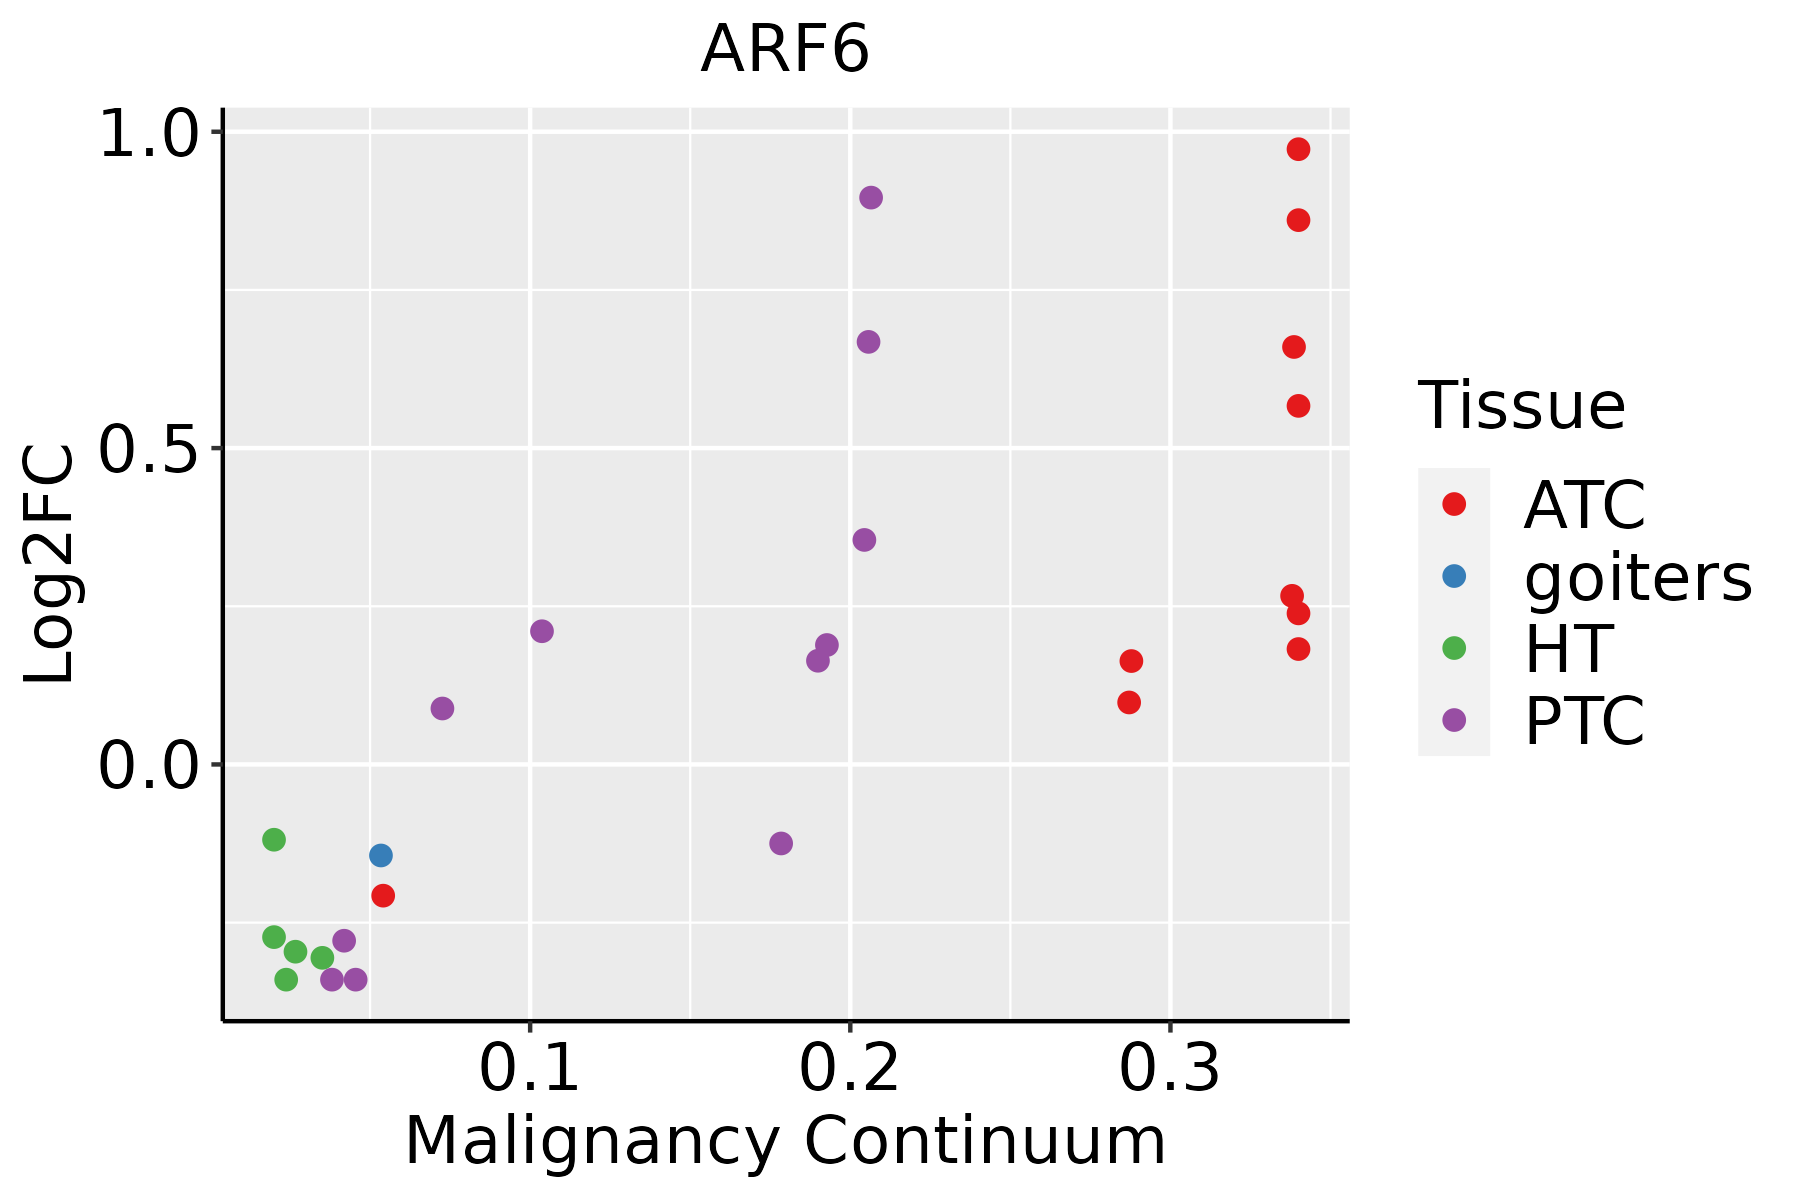 | ATC: Anaplastic thyroid cancer |
| HT: Hashimoto's thyroiditis | ||
| PTC: Papillary thyroid cancer |
| ∗log2FC in expression of this searched gene in stem-like cells from each diseased tissue sample relative to stem-like cells in normal samples in each tissue plotted against the malignancy continuum. Samples are colored based on if they are from different disease stage. |
Top |
Malignant transformation related pathway analysis |
| Find out the enriched GO biological processes and KEGG pathways involved in transition from healthy to precancer to cancer |
| Tissue | Disease Stage | Enriched GO biological Processes |
| Colorectum | AD |  |
| Colorectum | SER |  |
| Colorectum | MSS |  |
| Colorectum | MSI-H |  |
| Colorectum | FAP |  |
| ∗Top 15 enriched GO BP terms are showed in the bar plot of each disease state in each tissue. Each row represents a significant GO biological process which is colored according to the -log10(p.adjust). |
| Page: 1 2 3 4 5 6 7 8 9 |
| GO ID | Tissue | Disease Stage | Description | Gene Ratio | Bg Ratio | pvalue | p.adjust | Count |
| GO:00322731 | Colorectum | SER | positive regulation of protein polymerization | 51/2897 | 138/18723 | 5.26e-10 | 5.98e-08 | 51 |
| GO:00514951 | Colorectum | SER | positive regulation of cytoskeleton organization | 71/2897 | 226/18723 | 1.22e-09 | 1.27e-07 | 71 |
| GO:19049511 | Colorectum | SER | positive regulation of establishment of protein localization | 91/2897 | 319/18723 | 1.69e-09 | 1.68e-07 | 91 |
| GO:00313341 | Colorectum | SER | positive regulation of protein-containing complex assembly | 73/2897 | 237/18723 | 1.89e-09 | 1.84e-07 | 73 |
| GO:00224111 | Colorectum | SER | cellular component disassembly | 114/2897 | 443/18723 | 1.17e-08 | 9.59e-07 | 114 |
| GO:00512221 | Colorectum | SER | positive regulation of protein transport | 85/2897 | 303/18723 | 1.36e-08 | 1.05e-06 | 85 |
| GO:00487321 | Colorectum | SER | gland development | 112/2897 | 436/18723 | 1.75e-08 | 1.28e-06 | 112 |
| GO:19030761 | Colorectum | SER | regulation of protein localization to plasma membrane | 36/2897 | 104/18723 | 1.12e-06 | 5.18e-05 | 36 |
| GO:19054751 | Colorectum | SER | regulation of protein localization to membrane | 52/2897 | 175/18723 | 1.31e-06 | 6.04e-05 | 52 |
| GO:19043751 | Colorectum | SER | regulation of protein localization to cell periphery | 40/2897 | 125/18723 | 2.85e-06 | 1.16e-04 | 40 |
| GO:00071631 | Colorectum | SER | establishment or maintenance of cell polarity | 60/2897 | 218/18723 | 3.45e-06 | 1.33e-04 | 60 |
| GO:00343291 | Colorectum | SER | cell junction assembly | 100/2897 | 420/18723 | 4.23e-06 | 1.61e-04 | 100 |
| GO:01501151 | Colorectum | SER | cell-substrate junction organization | 34/2897 | 101/18723 | 4.46e-06 | 1.67e-04 | 34 |
| GO:00610081 | Colorectum | SER | hepaticobiliary system development | 45/2897 | 150/18723 | 4.98e-06 | 1.85e-04 | 45 |
| GO:00018891 | Colorectum | SER | liver development | 44/2897 | 147/18723 | 6.73e-06 | 2.35e-04 | 44 |
| GO:00161971 | Colorectum | SER | endosomal transport | 61/2897 | 230/18723 | 1.03e-05 | 3.35e-04 | 61 |
| GO:19054771 | Colorectum | SER | positive regulation of protein localization to membrane | 33/2897 | 106/18723 | 3.83e-05 | 9.82e-04 | 33 |
| GO:00991731 | Colorectum | SER | postsynapse organization | 46/2897 | 168/18723 | 5.20e-05 | 1.25e-03 | 46 |
| GO:00439541 | Colorectum | SER | cellular component maintenance | 22/2897 | 61/18723 | 6.47e-05 | 1.49e-03 | 22 |
| GO:00016671 | Colorectum | SER | ameboidal-type cell migration | 105/2897 | 475/18723 | 6.97e-05 | 1.59e-03 | 105 |
| Page: 1 2 3 4 5 6 7 8 9 10 11 12 13 14 15 16 17 18 19 20 21 22 23 24 25 26 27 28 29 30 31 32 33 34 35 36 37 38 39 40 41 42 43 44 45 46 47 48 49 50 51 52 53 54 55 56 57 58 59 60 61 62 63 64 65 66 67 68 69 70 71 72 73 74 75 76 77 |
| Pathway ID | Tissue | Disease Stage | Description | Gene Ratio | Bg Ratio | pvalue | p.adjust | qvalue | Count |
| hsa0513218 | Breast | Precancer | Salmonella infection | 49/684 | 249/8465 | 2.92e-09 | 6.15e-08 | 4.71e-08 | 49 |
| hsa0513018 | Breast | Precancer | Pathogenic Escherichia coli infection | 38/684 | 197/8465 | 3.12e-07 | 5.81e-06 | 4.45e-06 | 38 |
| hsa0513118 | Breast | Precancer | Shigellosis | 44/684 | 247/8465 | 3.91e-07 | 6.86e-06 | 5.26e-06 | 44 |
| hsa0513219 | Breast | Precancer | Salmonella infection | 49/684 | 249/8465 | 2.92e-09 | 6.15e-08 | 4.71e-08 | 49 |
| hsa0513019 | Breast | Precancer | Pathogenic Escherichia coli infection | 38/684 | 197/8465 | 3.12e-07 | 5.81e-06 | 4.45e-06 | 38 |
| hsa0513119 | Breast | Precancer | Shigellosis | 44/684 | 247/8465 | 3.91e-07 | 6.86e-06 | 5.26e-06 | 44 |
| hsa0513224 | Breast | IDC | Salmonella infection | 55/867 | 249/8465 | 2.07e-08 | 4.49e-07 | 3.36e-07 | 55 |
| hsa0513024 | Breast | IDC | Pathogenic Escherichia coli infection | 42/867 | 197/8465 | 2.66e-06 | 3.92e-05 | 2.94e-05 | 42 |
| hsa0513124 | Breast | IDC | Shigellosis | 47/867 | 247/8465 | 1.78e-05 | 2.00e-04 | 1.49e-04 | 47 |
| hsa0513234 | Breast | IDC | Salmonella infection | 55/867 | 249/8465 | 2.07e-08 | 4.49e-07 | 3.36e-07 | 55 |
| hsa0513034 | Breast | IDC | Pathogenic Escherichia coli infection | 42/867 | 197/8465 | 2.66e-06 | 3.92e-05 | 2.94e-05 | 42 |
| hsa0513134 | Breast | IDC | Shigellosis | 47/867 | 247/8465 | 1.78e-05 | 2.00e-04 | 1.49e-04 | 47 |
| hsa0513243 | Breast | DCIS | Salmonella infection | 55/846 | 249/8465 | 8.71e-09 | 1.87e-07 | 1.38e-07 | 55 |
| hsa0513043 | Breast | DCIS | Pathogenic Escherichia coli infection | 42/846 | 197/8465 | 1.40e-06 | 2.15e-05 | 1.59e-05 | 42 |
| hsa0513144 | Breast | DCIS | Shigellosis | 46/846 | 247/8465 | 2.06e-05 | 2.38e-04 | 1.75e-04 | 46 |
| hsa0414416 | Breast | DCIS | Endocytosis | 37/846 | 251/8465 | 9.92e-03 | 4.40e-02 | 3.24e-02 | 37 |
| hsa0513253 | Breast | DCIS | Salmonella infection | 55/846 | 249/8465 | 8.71e-09 | 1.87e-07 | 1.38e-07 | 55 |
| hsa0513053 | Breast | DCIS | Pathogenic Escherichia coli infection | 42/846 | 197/8465 | 1.40e-06 | 2.15e-05 | 1.59e-05 | 42 |
| hsa0513154 | Breast | DCIS | Shigellosis | 46/846 | 247/8465 | 2.06e-05 | 2.38e-04 | 1.75e-04 | 46 |
| hsa0414417 | Breast | DCIS | Endocytosis | 37/846 | 251/8465 | 9.92e-03 | 4.40e-02 | 3.24e-02 | 37 |
| Page: 1 2 3 4 5 6 7 8 9 10 |
Top |
Cell-cell communication analysis |
| Identification of potential cell-cell interactions between two cell types and their ligand-receptor pairs for different disease states |
| Ligand | Receptor | LRpair | Pathway | Tissue | Disease Stage |
| Page: 1 |
Top |
Single-cell gene regulatory network inference analysis |
| Find out the significant the regulons (TFs) and the target genes of each regulon across cell types for different disease states |
| TF | Cell Type | Tissue | Disease Stage | Target Gene | RSS | Regulon Activity |
| ∗The dot plots of a searched regulon are shown for all cell subpopulations in each disease state of each tissue based on the regulon specific score inferred using pySCENIC and by calculating the average expression. |
| Page: 1 |
Top |
Somatic mutation of malignant transformation related genes |
| Annotation of somatic variants for genes involved in malignant transformation |
| Hugo Symbol | Variant Class | Variant Classification | dbSNP RS | HGVSc | HGVSp | HGVSp Short | SWISSPROT | BIOTYPE | SIFT | PolyPhen | Tumor Sample Barcode | Tissue | Histology | Sex | Age | Stage | Therapy Types | Drugs | Outcome |
| ARF6 | SNV | Missense_Mutation | novel | c.390N>C | p.Met130Ile | p.M130I | P62330 | protein_coding | deleterious_low_confidence(0.03) | benign(0.029) | TCGA-C5-A2LY-01 | Cervix | cervical & endocervical cancer | Female | <65 | I/II | Chemotherapy | cisplatin | SD |
| ARF6 | SNV | Missense_Mutation | c.433N>T | p.Arg145Trp | p.R145W | P62330 | protein_coding | deleterious_low_confidence(0.01) | possibly_damaging(0.848) | TCGA-EK-A2RA-01 | Cervix | cervical & endocervical cancer | Female | >=65 | I/II | Unknown | Unknown | SD | |
| ARF6 | SNV | Missense_Mutation | c.91N>C | p.Tyr31His | p.Y31H | P62330 | protein_coding | deleterious_low_confidence(0.01) | probably_damaging(1) | TCGA-AA-A010-01 | Colorectum | colon adenocarcinoma | Female | <65 | I/II | Chemotherapy | folinic | CR | |
| ARF6 | SNV | Missense_Mutation | c.433C>T | p.Arg145Trp | p.R145W | P62330 | protein_coding | deleterious_low_confidence(0.01) | possibly_damaging(0.848) | TCGA-A5-A0G2-01 | Endometrium | uterine corpus endometrioid carcinoma | Female | <65 | III/IV | Unknown | Unknown | SD | |
| ARF6 | SNV | Missense_Mutation | c.415N>A | p.Leu139Met | p.L139M | P62330 | protein_coding | deleterious_low_confidence(0.04) | benign(0.41) | TCGA-AP-A059-01 | Endometrium | uterine corpus endometrioid carcinoma | Female | >=65 | I/II | Unknown | Unknown | SD | |
| ARF6 | SNV | Missense_Mutation | c.418N>T | p.Gly140Cys | p.G140C | P62330 | protein_coding | deleterious_low_confidence(0) | possibly_damaging(0.884) | TCGA-AP-A0LD-01 | Endometrium | uterine corpus endometrioid carcinoma | Female | <65 | I/II | Unknown | Unknown | SD | |
| ARF6 | SNV | Missense_Mutation | c.448N>C | p.Tyr150His | p.Y150H | P62330 | protein_coding | tolerated_low_confidence(0.15) | possibly_damaging(0.503) | TCGA-BS-A0UJ-01 | Endometrium | uterine corpus endometrioid carcinoma | Female | >=65 | I/II | Unknown | Unknown | SD | |
| ARF6 | SNV | Missense_Mutation | novel | c.246N>C | p.Gln82His | p.Q82H | P62330 | protein_coding | tolerated_low_confidence(0.05) | probably_damaging(0.968) | TCGA-EO-A3B0-01 | Endometrium | uterine corpus endometrioid carcinoma | Female | <65 | III/IV | Unknown | Unknown | SD |
| ARF6 | SNV | Missense_Mutation | novel | c.446G>T | p.Trp149Leu | p.W149L | P62330 | protein_coding | deleterious_low_confidence(0) | probably_damaging(0.968) | TCGA-EO-A3KX-01 | Endometrium | uterine corpus endometrioid carcinoma | Female | >=65 | I/II | Unknown | Unknown | SD |
| ARF6 | SNV | Missense_Mutation | novel | c.102N>T | p.Lys34Asn | p.K34N | P62330 | protein_coding | deleterious_low_confidence(0) | probably_damaging(0.989) | TCGA-91-8499-01 | Lung | lung adenocarcinoma | Female | >=65 | I/II | Unknown | Unknown | SD |
| Page: 1 2 |
Top |
Related drugs of malignant transformation related genes |
| Identification of chemicals and drugs interact with genes involved in malignant transfromation |
| (DGIdb 4.0) |
| Entrez ID | Symbol | Category | Interaction Types | Drug Claim Name | Drug Name | PMIDs |
| 382 | ARF6 | NA | INSULIN | INSULIN | 11438681 |
| Page: 1 |

Copyright 2023-Present -The University of Texas Health Science Center at Houston |