
|
|||||
|
 | |
| |
| |
| |
| |
| |
|
Gene: ACSL4 |
Gene summary for ACSL4 |
| Gene information | Species | Human | Gene symbol | ACSL4 | Gene ID | 2182 |
| Gene name | acyl-CoA synthetase long chain family member 4 | |
| Gene Alias | ACS4 | |
| Cytomap | Xq23 | |
| Gene Type | protein-coding | GO ID | GO:0000003 | UniProtAcc | O60488 |
Top |
Malignant transformation analysis |
| Identification of the aberrant gene expression in precancerous and cancerous lesions by comparing the gene expression of stem-like cells in diseased tissues with normal stem cells |
| Entrez ID | Symbol | Replicates | Species | Organ | Tissue | Adj P-value | Log2FC | Malignancy |
| 2182 | ACSL4 | CA_HPV_1 | Human | Cervix | CC | 2.70e-06 | -2.97e-01 | 0.0264 |
| 2182 | ACSL4 | CA_HPV_3 | Human | Cervix | CC | 2.12e-07 | -3.90e-01 | 0.0414 |
| 2182 | ACSL4 | N_HPV_2 | Human | Cervix | N_HPV | 8.62e-10 | -3.51e-01 | -0.0131 |
| 2182 | ACSL4 | CCII_1 | Human | Cervix | CC | 7.28e-14 | -7.67e-01 | 0.3249 |
| 2182 | ACSL4 | Tumor | Human | Cervix | CC | 4.27e-29 | -7.43e-01 | 0.1241 |
| 2182 | ACSL4 | sample1 | Human | Cervix | CC | 3.49e-04 | -5.85e-01 | 0.0959 |
| 2182 | ACSL4 | sample3 | Human | Cervix | CC | 1.29e-25 | -6.96e-01 | 0.1387 |
| 2182 | ACSL4 | H2 | Human | Cervix | HSIL_HPV | 3.37e-02 | -2.74e-01 | 0.0632 |
| 2182 | ACSL4 | L1 | Human | Cervix | CC | 1.50e-22 | -8.24e-01 | 0.0802 |
| 2182 | ACSL4 | T1 | Human | Cervix | CC | 1.78e-17 | -6.87e-01 | 0.0918 |
| 2182 | ACSL4 | T3 | Human | Cervix | CC | 7.30e-22 | -6.87e-01 | 0.1389 |
| 2182 | ACSL4 | LZE4T | Human | Esophagus | ESCC | 7.25e-08 | -1.51e-01 | 0.0811 |
| 2182 | ACSL4 | LZE8T | Human | Esophagus | ESCC | 6.05e-04 | -3.63e-02 | 0.067 |
| 2182 | ACSL4 | P2T-E | Human | Esophagus | ESCC | 6.80e-05 | 1.58e-01 | 0.1177 |
| 2182 | ACSL4 | P4T-E | Human | Esophagus | ESCC | 2.26e-18 | 8.06e-02 | 0.1323 |
| 2182 | ACSL4 | P5T-E | Human | Esophagus | ESCC | 2.83e-20 | -3.36e-02 | 0.1327 |
| 2182 | ACSL4 | P8T-E | Human | Esophagus | ESCC | 5.19e-11 | -4.85e-02 | 0.0889 |
| 2182 | ACSL4 | P9T-E | Human | Esophagus | ESCC | 6.44e-06 | 2.63e-01 | 0.1131 |
| 2182 | ACSL4 | P10T-E | Human | Esophagus | ESCC | 2.36e-13 | 4.83e-02 | 0.116 |
| 2182 | ACSL4 | P12T-E | Human | Esophagus | ESCC | 1.27e-18 | -1.16e-01 | 0.1122 |
| Page: 1 2 3 4 5 6 7 |
| Tissue | Expression Dynamics | Abbreviation |
| Cervix |  | CC: Cervix cancer |
| HSIL_HPV: HPV-infected high-grade squamous intraepithelial lesions | ||
| N_HPV: HPV-infected normal cervix | ||
| Esophagus |  | ESCC: Esophageal squamous cell carcinoma |
| HGIN: High-grade intraepithelial neoplasias | ||
| LGIN: Low-grade intraepithelial neoplasias | ||
| Liver | 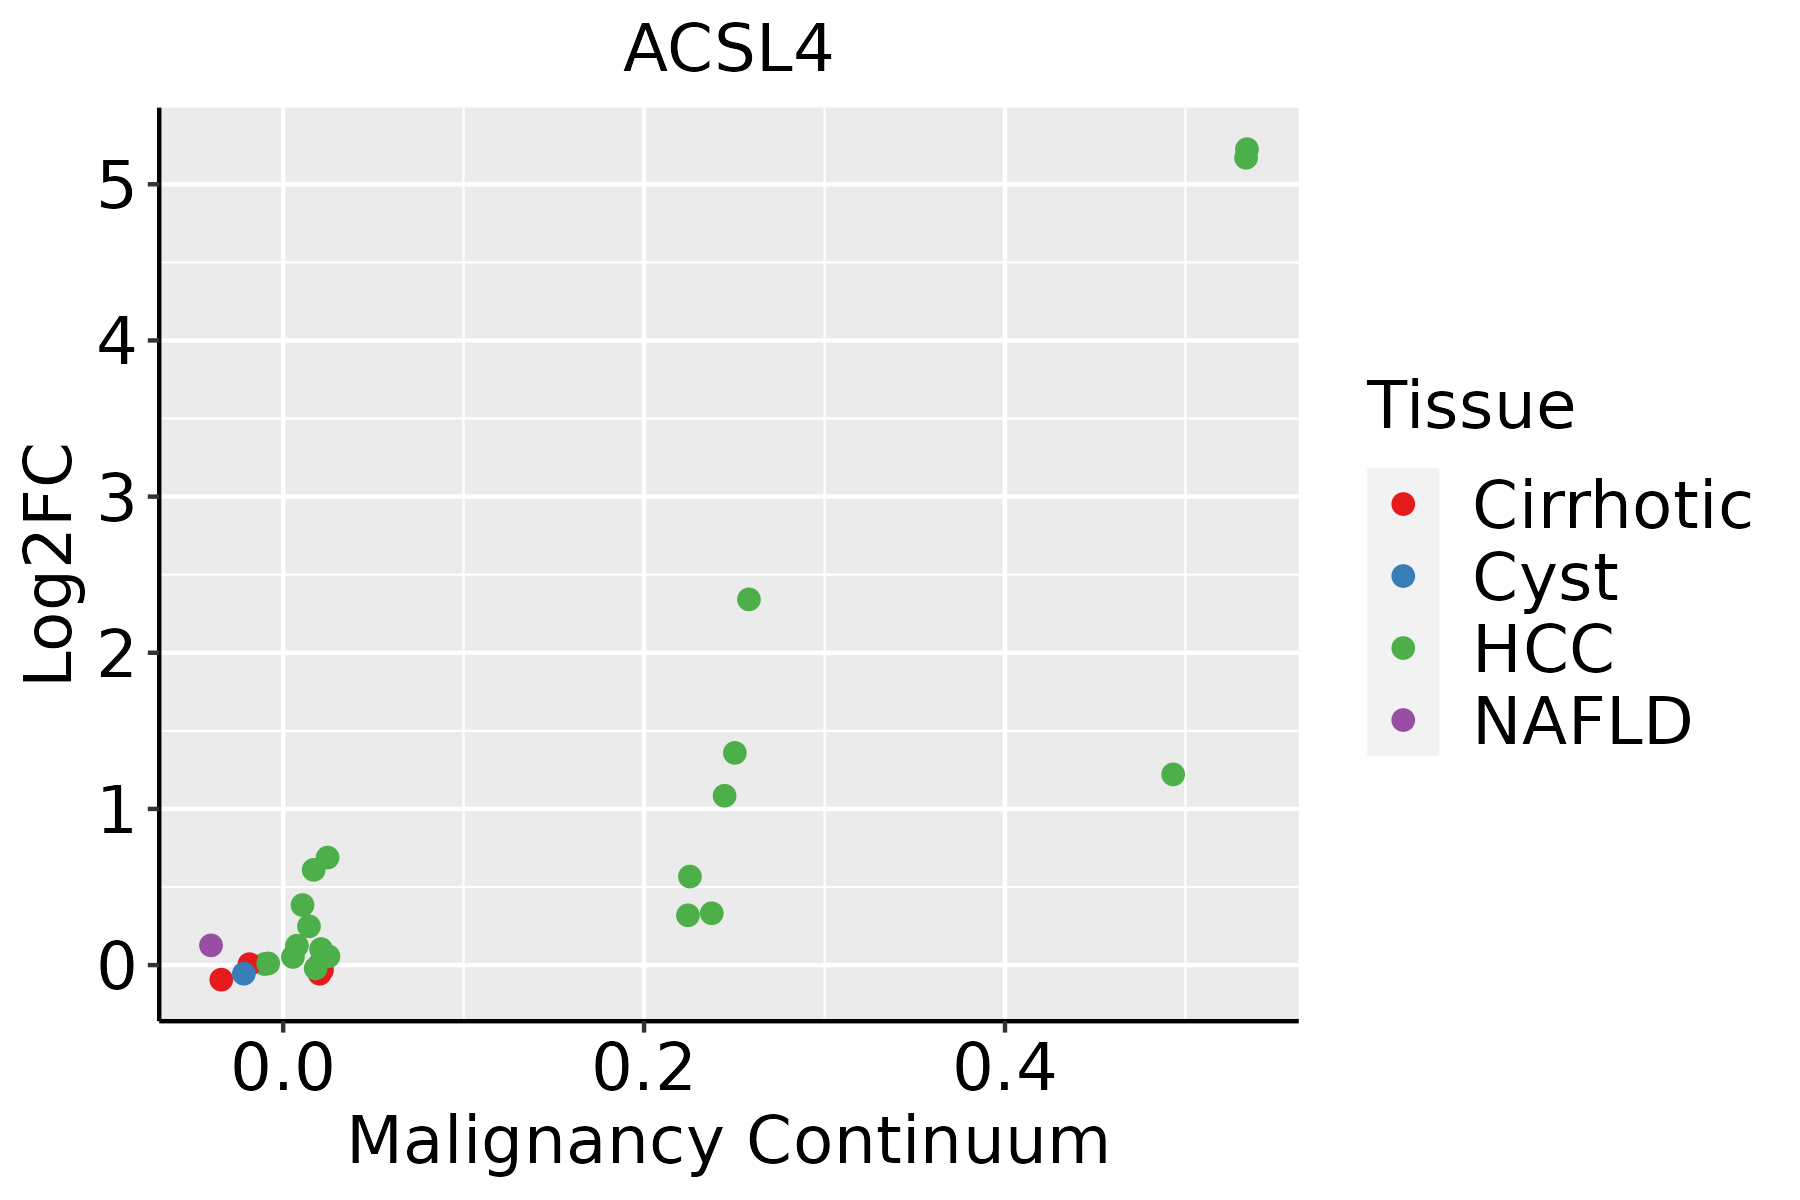 | HCC: Hepatocellular carcinoma |
| NAFLD: Non-alcoholic fatty liver disease | ||
| Lung | 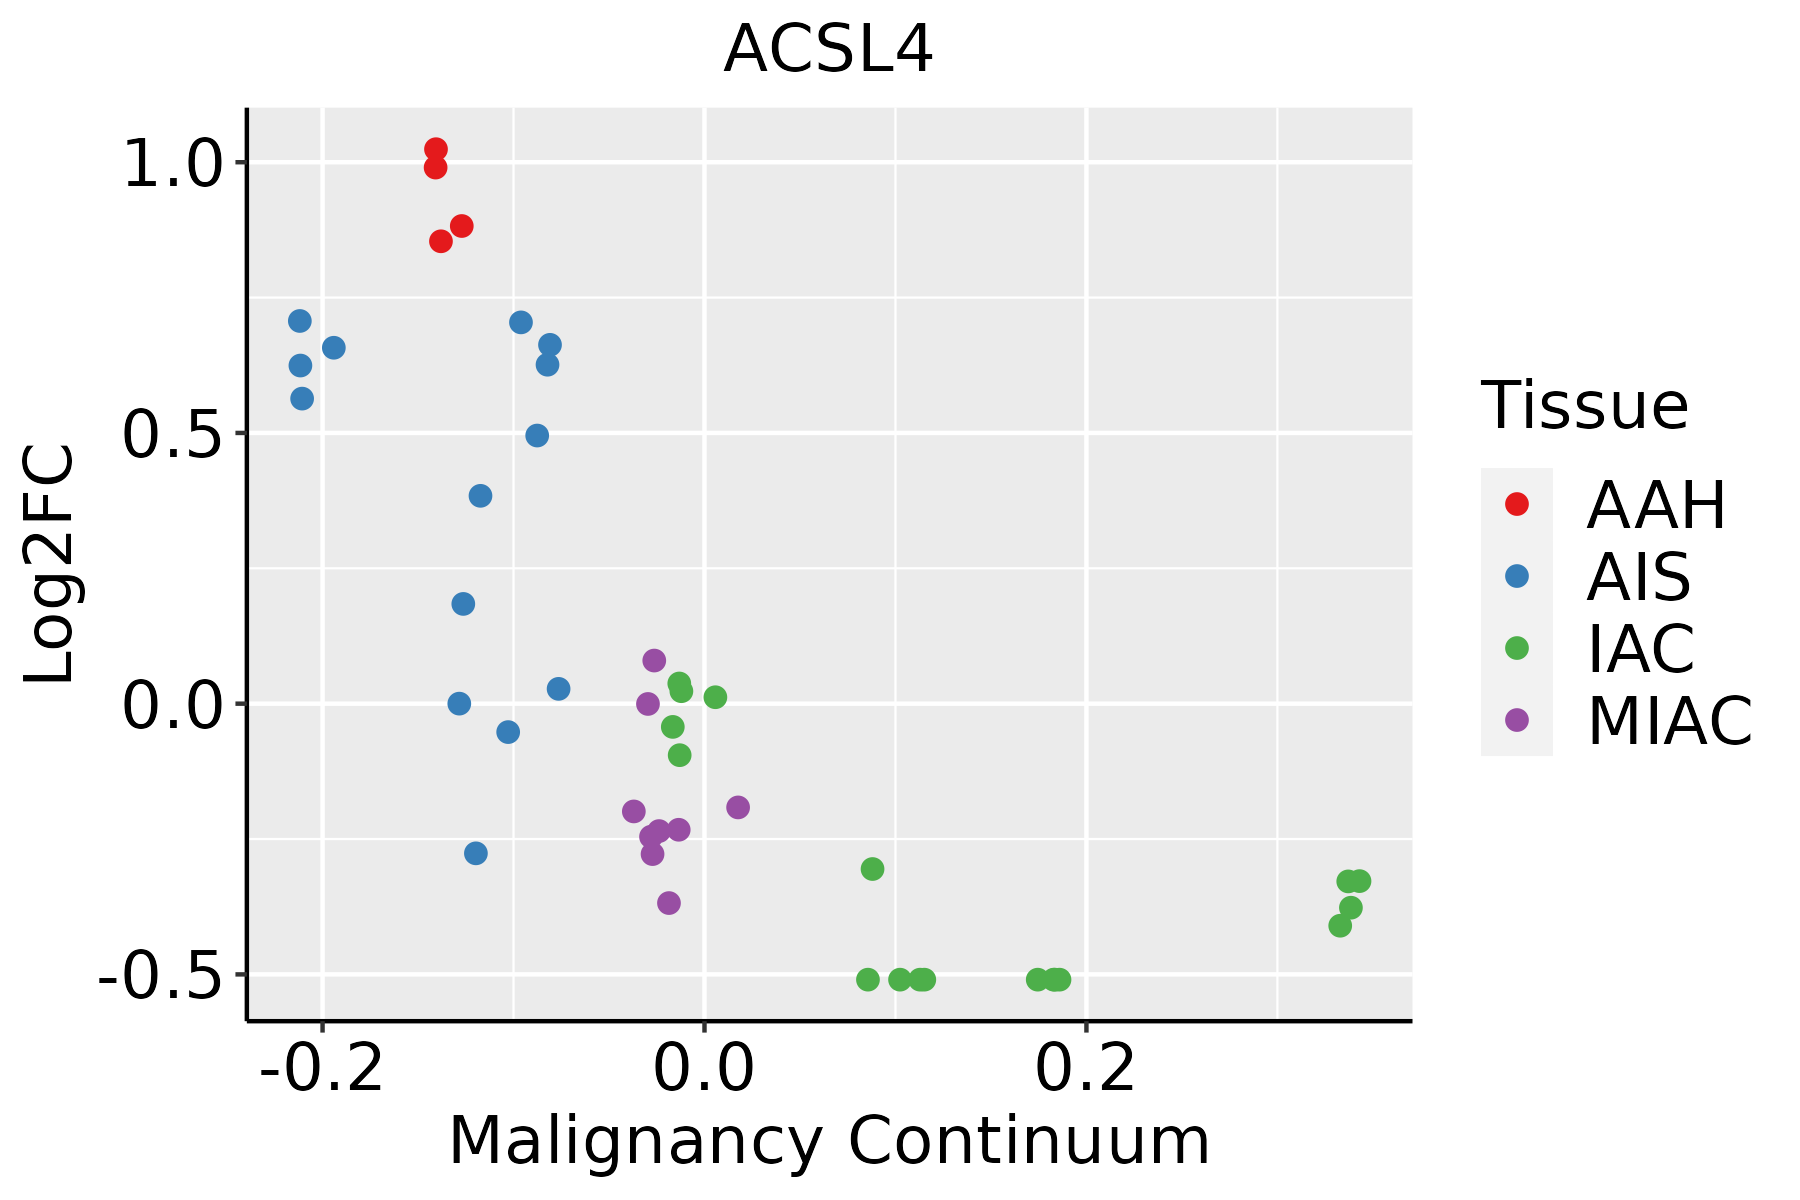 | AAH: Atypical adenomatous hyperplasia |
| AIS: Adenocarcinoma in situ | ||
| IAC: Invasive lung adenocarcinoma | ||
| MIA: Minimally invasive adenocarcinoma | ||
| Oral Cavity | 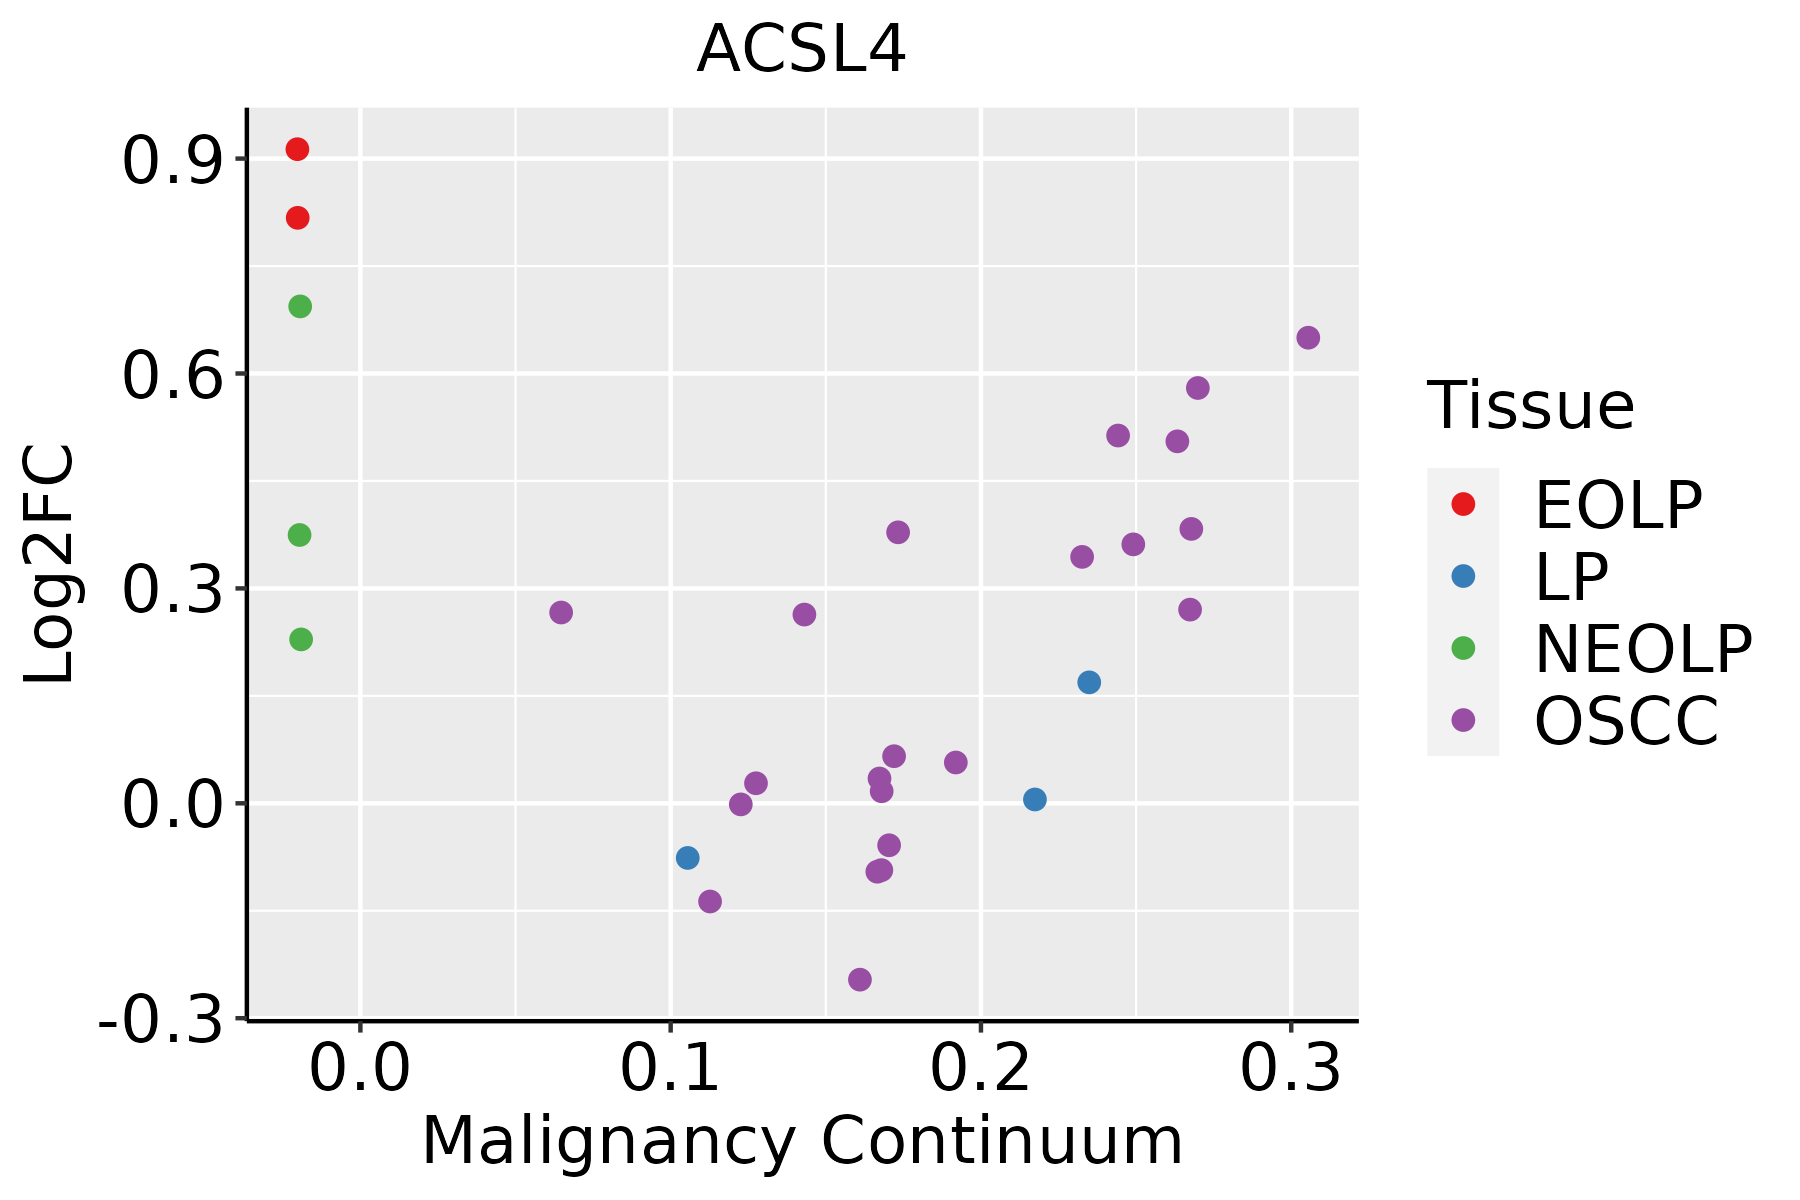 | EOLP: Erosive Oral lichen planus |
| LP: leukoplakia | ||
| NEOLP: Non-erosive oral lichen planus | ||
| OSCC: Oral squamous cell carcinoma | ||
| Prostate | 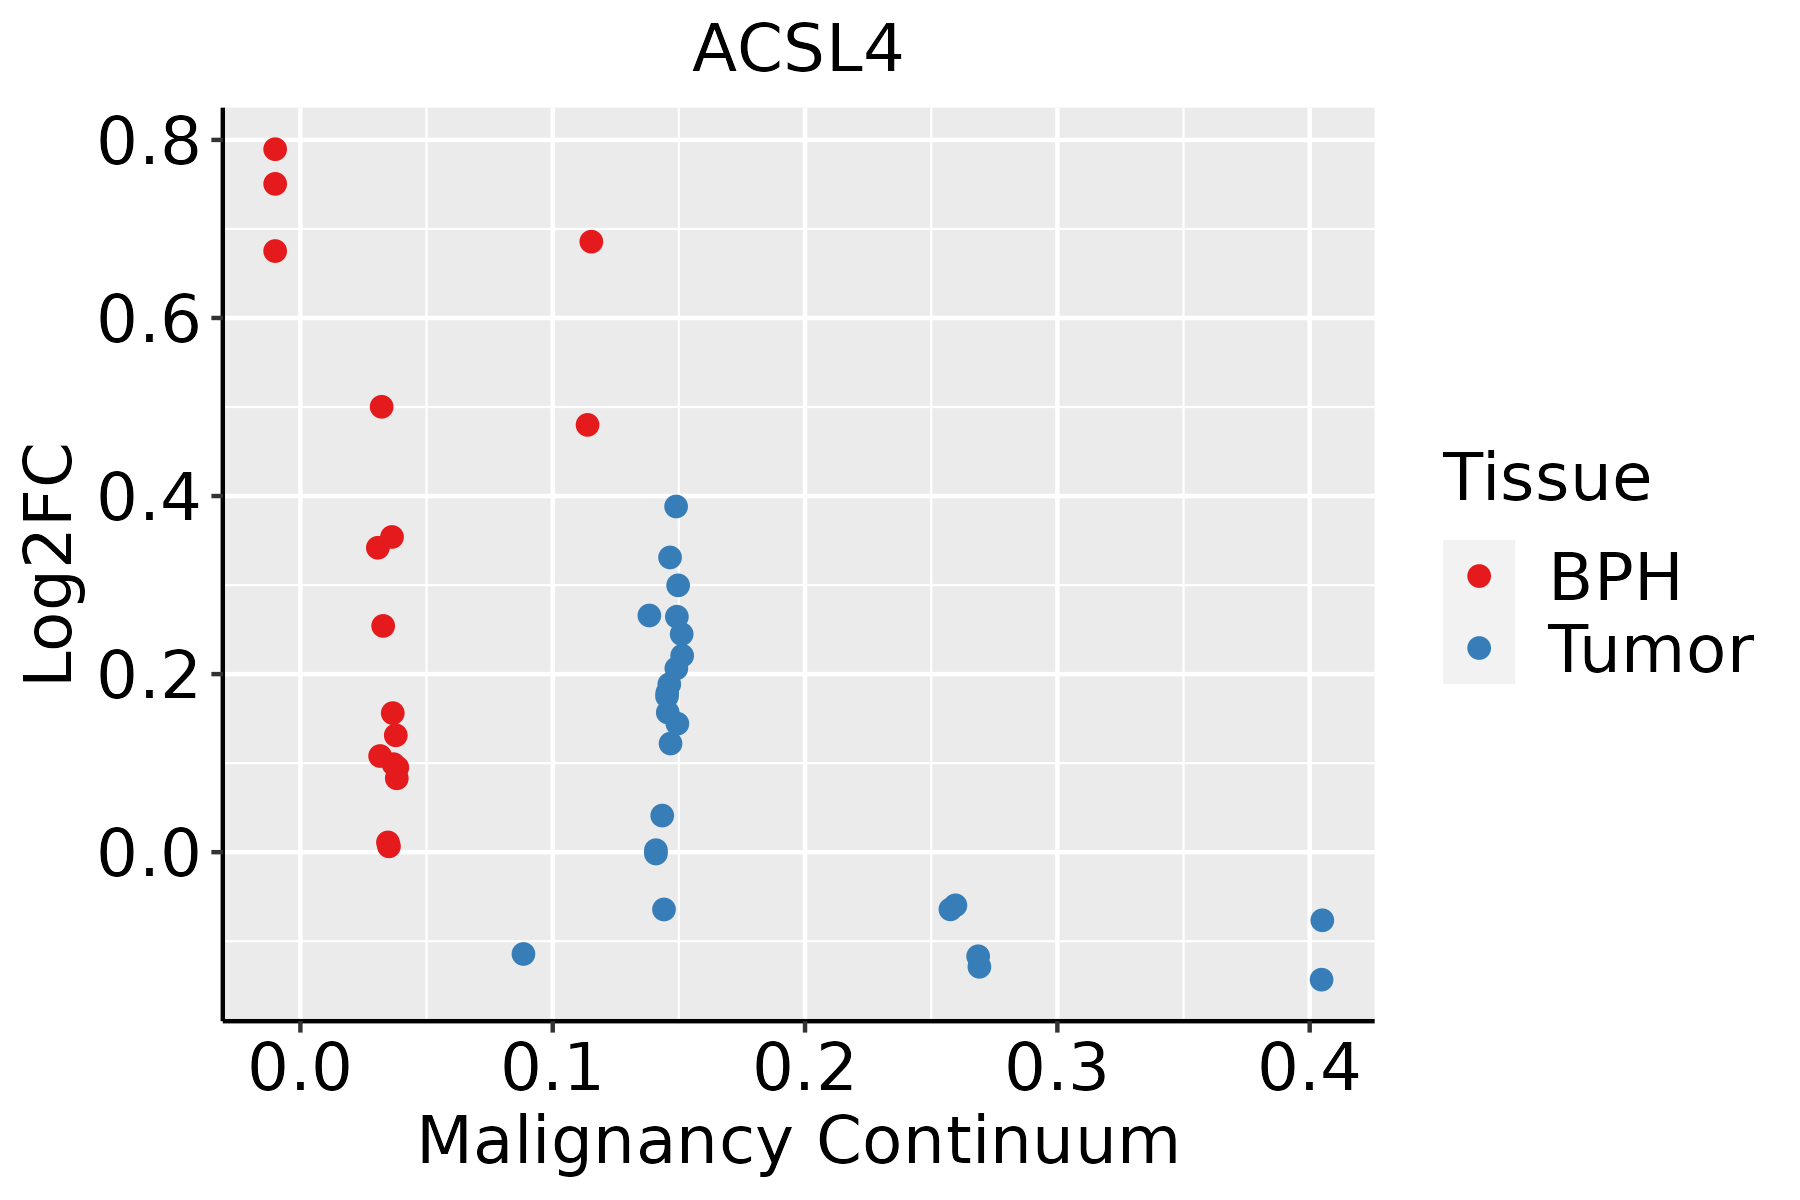 | BPH: Benign Prostatic Hyperplasia |
| Skin | 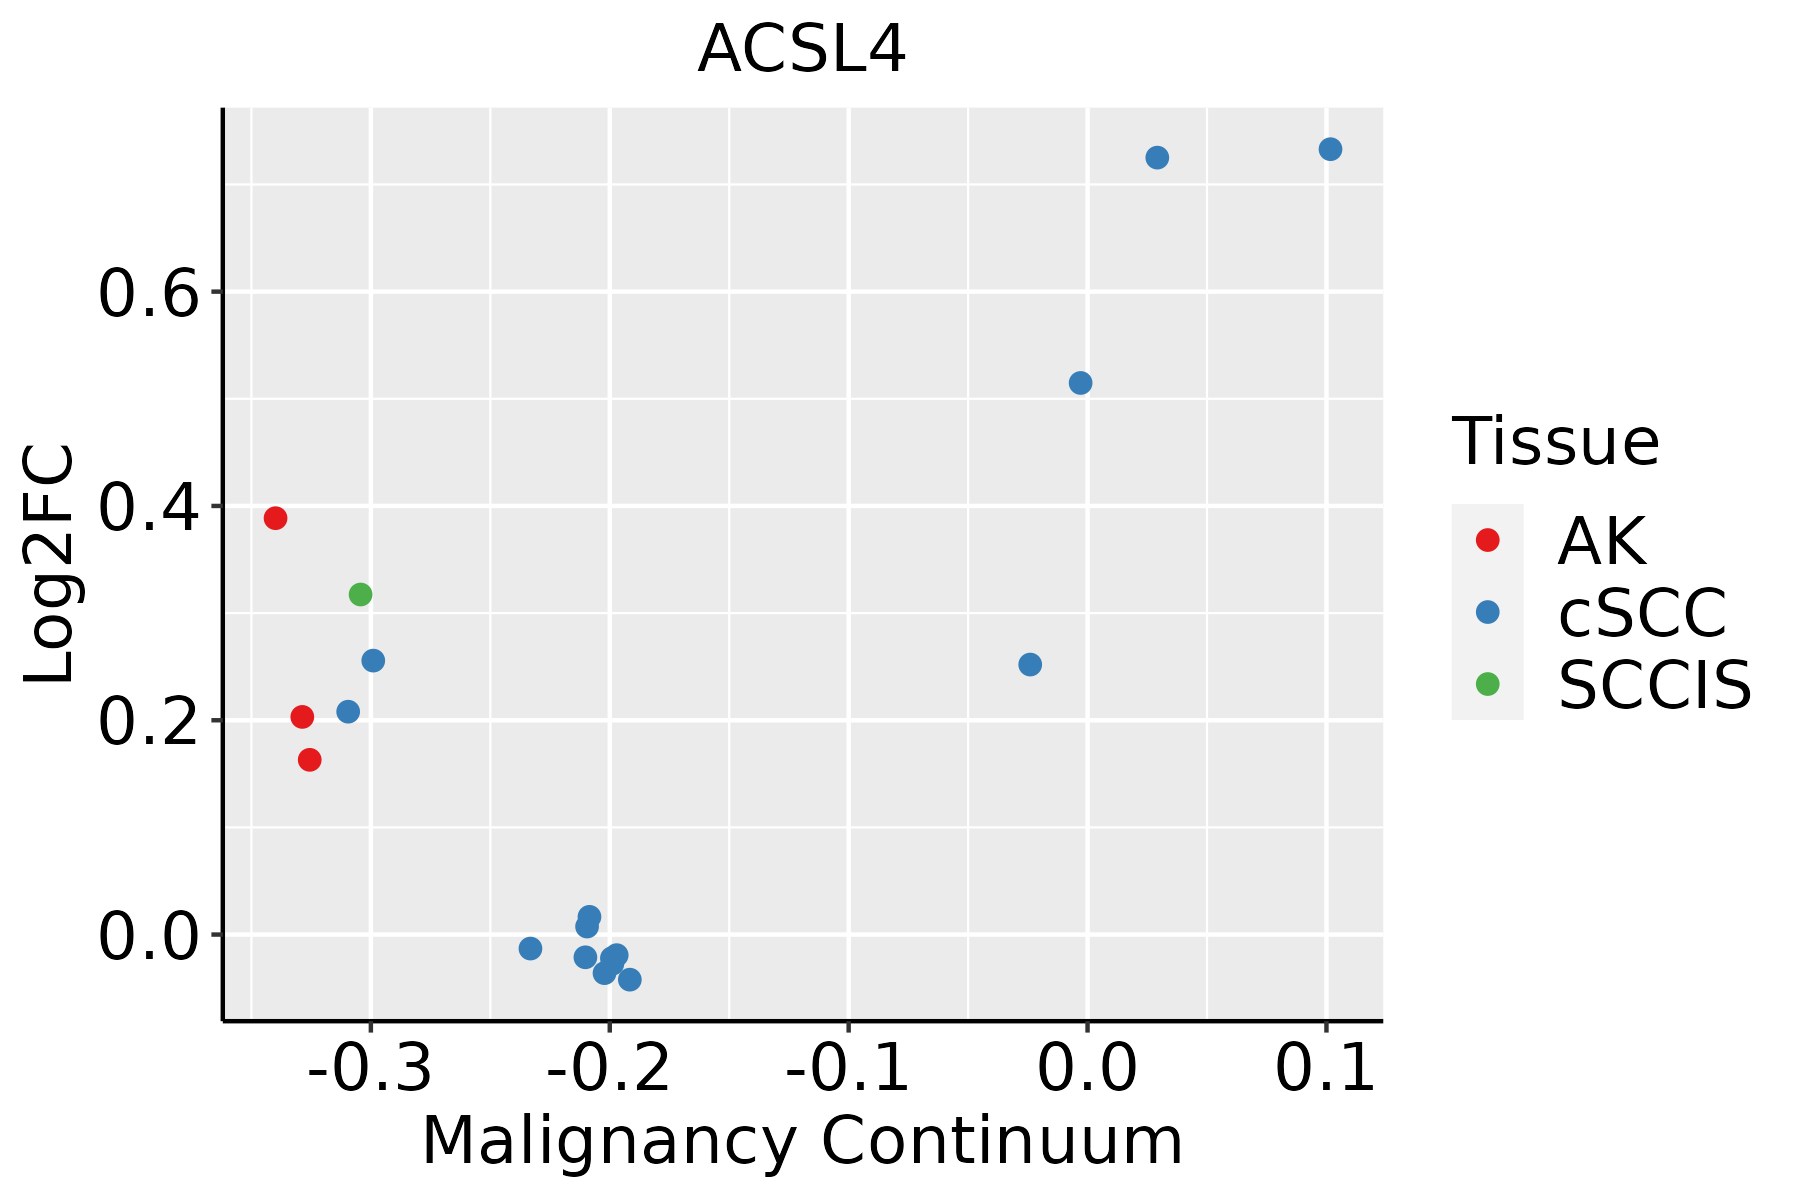 | AK: Actinic keratosis |
| cSCC: Cutaneous squamous cell carcinoma | ||
| SCCIS:squamous cell carcinoma in situ | ||
| Thyroid | 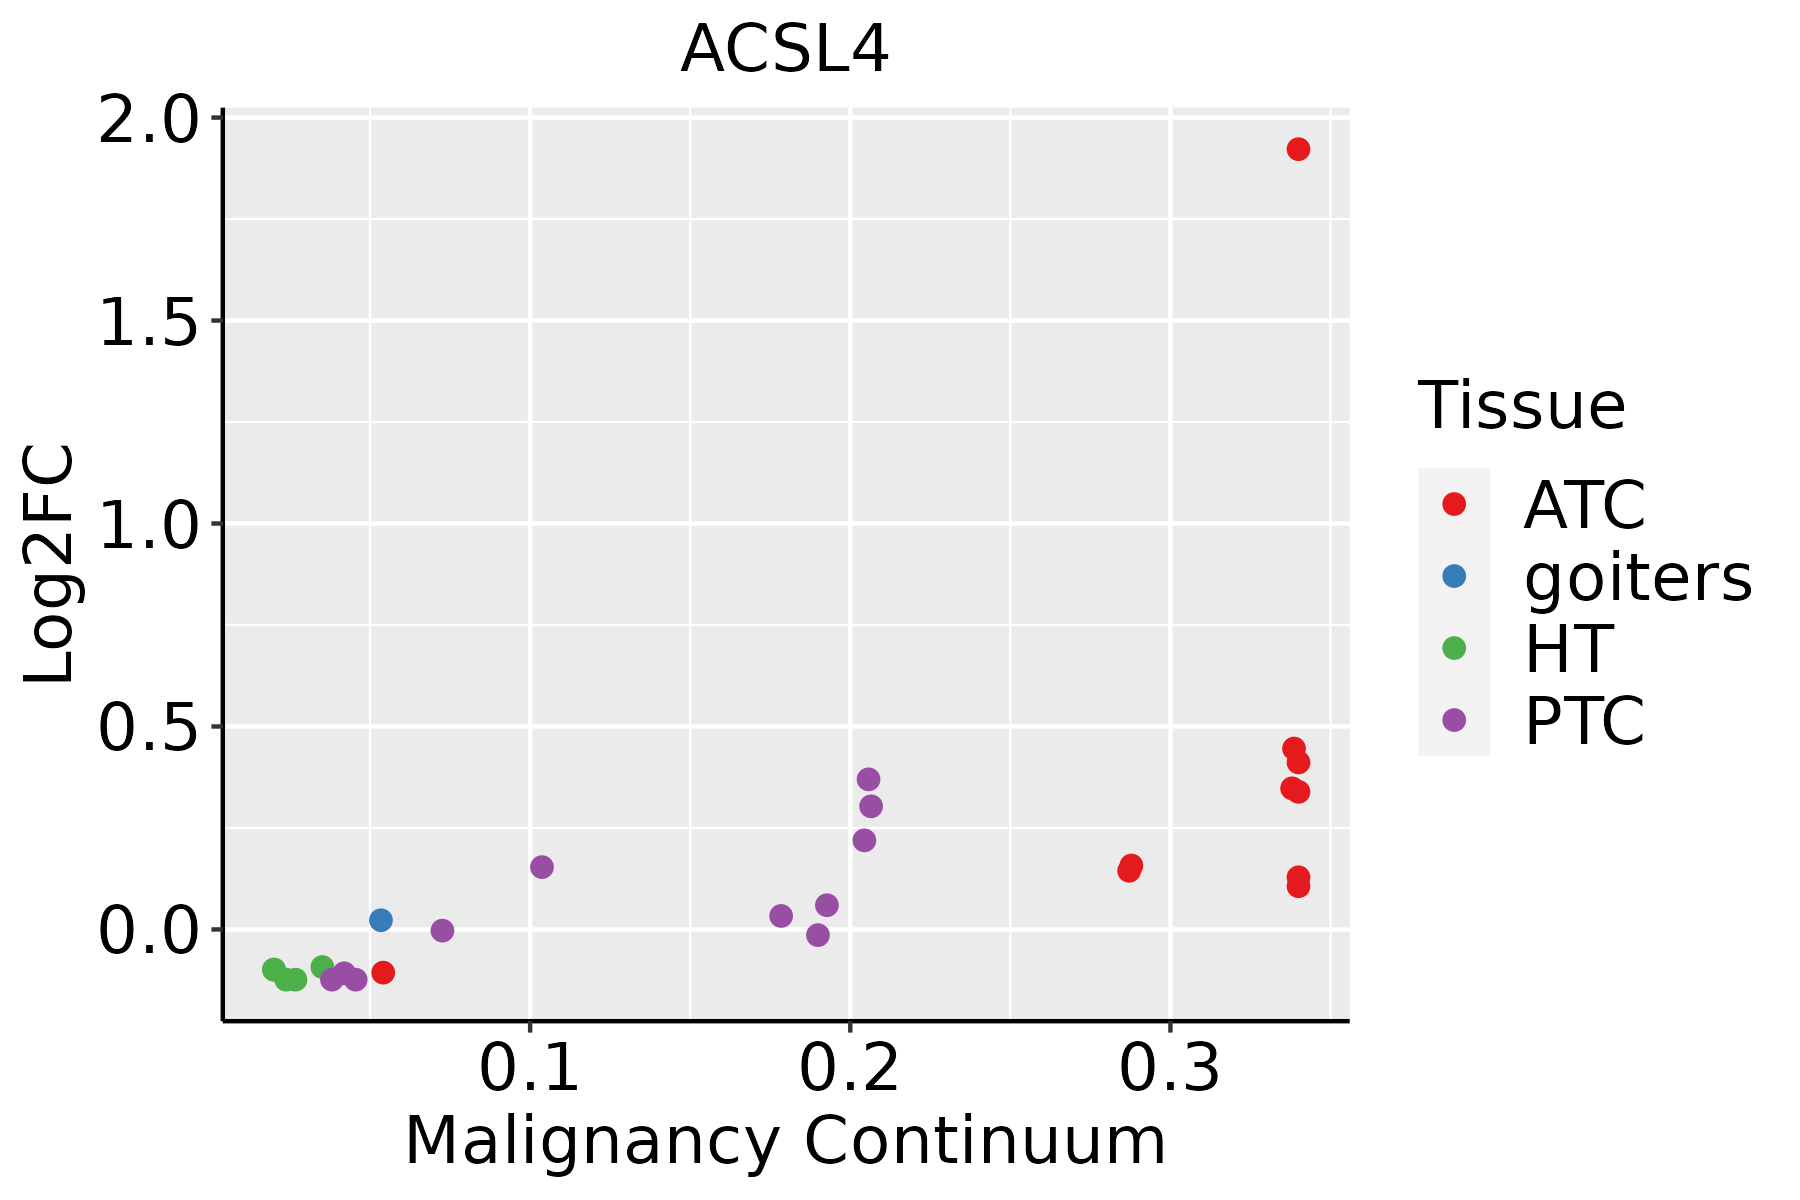 | ATC: Anaplastic thyroid cancer |
| HT: Hashimoto's thyroiditis | ||
| PTC: Papillary thyroid cancer |
| ∗log2FC in expression of this searched gene in stem-like cells from each diseased tissue sample relative to stem-like cells in normal samples in each tissue plotted against the malignancy continuum. Samples are colored based on if they are from different disease stage. |
Top |
Malignant transformation related pathway analysis |
| Find out the enriched GO biological processes and KEGG pathways involved in transition from healthy to precancer to cancer |
| Tissue | Disease Stage | Enriched GO biological Processes |
| Colorectum | AD |  |
| Colorectum | SER |  |
| Colorectum | MSS |  |
| Colorectum | MSI-H |  |
| Colorectum | FAP |  |
| ∗Top 15 enriched GO BP terms are showed in the bar plot of each disease state in each tissue. Each row represents a significant GO biological process which is colored according to the -log10(p.adjust). |
| Page: 1 2 3 4 5 6 7 8 9 |
| GO ID | Tissue | Disease Stage | Description | Gene Ratio | Bg Ratio | pvalue | p.adjust | Count |
| GO:0031667112 | Skin | SCCIS | response to nutrient levels | 40/919 | 474/18723 | 6.21e-04 | 9.18e-03 | 40 |
| GO:000915027 | Skin | SCCIS | purine ribonucleotide metabolic process | 31/919 | 368/18723 | 2.49e-03 | 2.42e-02 | 31 |
| GO:000925926 | Skin | SCCIS | ribonucleotide metabolic process | 32/919 | 385/18723 | 2.64e-03 | 2.48e-02 | 32 |
| GO:004470615 | Skin | SCCIS | multi-multicellular organism process | 21/919 | 220/18723 | 2.81e-03 | 2.61e-02 | 21 |
| GO:000926020 | Skin | SCCIS | ribonucleotide biosynthetic process | 18/919 | 182/18723 | 3.74e-03 | 3.26e-02 | 18 |
| GO:000915220 | Skin | SCCIS | purine ribonucleotide biosynthetic process | 17/919 | 169/18723 | 4.01e-03 | 3.41e-02 | 17 |
| GO:000616326 | Skin | SCCIS | purine nucleotide metabolic process | 32/919 | 396/18723 | 4.04e-03 | 3.43e-02 | 32 |
| GO:001969326 | Skin | SCCIS | ribose phosphate metabolic process | 32/919 | 396/18723 | 4.04e-03 | 3.43e-02 | 32 |
| GO:007252126 | Skin | SCCIS | purine-containing compound metabolic process | 33/919 | 416/18723 | 4.69e-03 | 3.89e-02 | 33 |
| GO:004639020 | Skin | SCCIS | ribose phosphate biosynthetic process | 18/919 | 190/18723 | 5.86e-03 | 4.52e-02 | 18 |
| GO:1904951112 | Skin | cSCC | positive regulation of establishment of protein localization | 134/4864 | 319/18723 | 2.60e-10 | 1.09e-08 | 134 |
| GO:0051222112 | Skin | cSCC | positive regulation of protein transport | 125/4864 | 303/18723 | 3.88e-09 | 1.32e-07 | 125 |
| GO:0019693112 | Skin | cSCC | ribose phosphate metabolic process | 146/4864 | 396/18723 | 9.28e-07 | 1.68e-05 | 146 |
| GO:000675324 | Skin | cSCC | nucleoside phosphate metabolic process | 176/4864 | 497/18723 | 1.55e-06 | 2.62e-05 | 176 |
| GO:0046390111 | Skin | cSCC | ribose phosphate biosynthetic process | 79/4864 | 190/18723 | 1.86e-06 | 3.10e-05 | 79 |
| GO:000911724 | Skin | cSCC | nucleotide metabolic process | 173/4864 | 489/18723 | 2.03e-06 | 3.35e-05 | 173 |
| GO:0072521112 | Skin | cSCC | purine-containing compound metabolic process | 150/4864 | 416/18723 | 2.88e-06 | 4.54e-05 | 150 |
| GO:0009259112 | Skin | cSCC | ribonucleotide metabolic process | 138/4864 | 385/18723 | 1.00e-05 | 1.30e-04 | 138 |
| GO:0006163112 | Skin | cSCC | purine nucleotide metabolic process | 140/4864 | 396/18723 | 1.93e-05 | 2.27e-04 | 140 |
| GO:0009260111 | Skin | cSCC | ribonucleotide biosynthetic process | 73/4864 | 182/18723 | 2.01e-05 | 2.36e-04 | 73 |
| Page: 1 2 3 4 5 6 7 8 9 10 11 12 13 14 15 16 17 18 19 |
| Pathway ID | Tissue | Disease Stage | Description | Gene Ratio | Bg Ratio | pvalue | p.adjust | qvalue | Count |
| hsa0471420 | Cervix | CC | Thermogenesis | 76/1267 | 232/8465 | 4.29e-12 | 1.16e-10 | 6.85e-11 | 76 |
| hsa0421614 | Cervix | CC | Ferroptosis | 14/1267 | 41/8465 | 1.75e-03 | 7.21e-03 | 4.26e-03 | 14 |
| hsa04714110 | Cervix | CC | Thermogenesis | 76/1267 | 232/8465 | 4.29e-12 | 1.16e-10 | 6.85e-11 | 76 |
| hsa0421615 | Cervix | CC | Ferroptosis | 14/1267 | 41/8465 | 1.75e-03 | 7.21e-03 | 4.26e-03 | 14 |
| hsa0471425 | Cervix | HSIL_HPV | Thermogenesis | 25/459 | 232/8465 | 7.63e-04 | 5.88e-03 | 4.76e-03 | 25 |
| hsa0471435 | Cervix | HSIL_HPV | Thermogenesis | 25/459 | 232/8465 | 7.63e-04 | 5.88e-03 | 4.76e-03 | 25 |
| hsa0471444 | Cervix | N_HPV | Thermogenesis | 27/349 | 232/8465 | 9.35e-07 | 1.41e-05 | 1.10e-05 | 27 |
| hsa0421624 | Cervix | N_HPV | Ferroptosis | 6/349 | 41/8465 | 6.24e-03 | 3.24e-02 | 2.54e-02 | 6 |
| hsa0471454 | Cervix | N_HPV | Thermogenesis | 27/349 | 232/8465 | 9.35e-07 | 1.41e-05 | 1.10e-05 | 27 |
| hsa0421634 | Cervix | N_HPV | Ferroptosis | 6/349 | 41/8465 | 6.24e-03 | 3.24e-02 | 2.54e-02 | 6 |
| hsa04714211 | Esophagus | ESCC | Thermogenesis | 163/4205 | 232/8465 | 9.22e-11 | 1.14e-09 | 5.86e-10 | 163 |
| hsa0421629 | Esophagus | ESCC | Ferroptosis | 33/4205 | 41/8465 | 4.58e-05 | 1.99e-04 | 1.02e-04 | 33 |
| hsa012129 | Esophagus | ESCC | Fatty acid metabolism | 41/4205 | 57/8465 | 5.13e-04 | 1.75e-03 | 8.98e-04 | 41 |
| hsa041467 | Esophagus | ESCC | Peroxisome | 55/4205 | 82/8465 | 1.04e-03 | 3.27e-03 | 1.68e-03 | 55 |
| hsa04714310 | Esophagus | ESCC | Thermogenesis | 163/4205 | 232/8465 | 9.22e-11 | 1.14e-09 | 5.86e-10 | 163 |
| hsa0421638 | Esophagus | ESCC | Ferroptosis | 33/4205 | 41/8465 | 4.58e-05 | 1.99e-04 | 1.02e-04 | 33 |
| hsa0121214 | Esophagus | ESCC | Fatty acid metabolism | 41/4205 | 57/8465 | 5.13e-04 | 1.75e-03 | 8.98e-04 | 41 |
| hsa0414612 | Esophagus | ESCC | Peroxisome | 55/4205 | 82/8465 | 1.04e-03 | 3.27e-03 | 1.68e-03 | 55 |
| hsa0471422 | Liver | HCC | Thermogenesis | 170/4020 | 232/8465 | 5.36e-16 | 2.25e-14 | 1.25e-14 | 170 |
| hsa012124 | Liver | HCC | Fatty acid metabolism | 45/4020 | 57/8465 | 1.05e-06 | 1.10e-05 | 6.09e-06 | 45 |
| Page: 1 2 3 4 |
Top |
Cell-cell communication analysis |
| Identification of potential cell-cell interactions between two cell types and their ligand-receptor pairs for different disease states |
| Ligand | Receptor | LRpair | Pathway | Tissue | Disease Stage |
| Page: 1 |
Top |
Single-cell gene regulatory network inference analysis |
| Find out the significant the regulons (TFs) and the target genes of each regulon across cell types for different disease states |
| TF | Cell Type | Tissue | Disease Stage | Target Gene | RSS | Regulon Activity |
| ∗The dot plots of a searched regulon are shown for all cell subpopulations in each disease state of each tissue based on the regulon specific score inferred using pySCENIC and by calculating the average expression. |
| Page: 1 |
Top |
Somatic mutation of malignant transformation related genes |
| Annotation of somatic variants for genes involved in malignant transformation |
| Hugo Symbol | Variant Class | Variant Classification | dbSNP RS | HGVSc | HGVSp | HGVSp Short | SWISSPROT | BIOTYPE | SIFT | PolyPhen | Tumor Sample Barcode | Tissue | Histology | Sex | Age | Stage | Therapy Types | Drugs | Outcome |
| ACSL4 | SNV | Missense_Mutation | c.1328N>A | p.Gly443Glu | p.G443E | O60488 | protein_coding | deleterious(0) | probably_damaging(1) | TCGA-A1-A0SH-01 | Breast | breast invasive carcinoma | Female | <65 | I/II | Chemotherapy | tc | SD | |
| ACSL4 | SNV | Missense_Mutation | c.313N>C | p.Glu105Gln | p.E105Q | O60488 | protein_coding | deleterious(0) | probably_damaging(0.933) | TCGA-AC-A23H-01 | Breast | breast invasive carcinoma | Female | >=65 | I/II | Unknown | Unknown | PD | |
| ACSL4 | SNV | Missense_Mutation | novel | c.4A>G | p.Lys2Glu | p.K2E | O60488 | protein_coding | tolerated_low_confidence(0.05) | possibly_damaging(0.472) | TCGA-AN-A046-01 | Breast | breast invasive carcinoma | Female | >=65 | I/II | Unknown | Unknown | SD |
| ACSL4 | SNV | Missense_Mutation | c.2007N>G | p.Ile669Met | p.I669M | O60488 | protein_coding | tolerated(0.26) | benign(0.007) | TCGA-AR-A255-01 | Breast | breast invasive carcinoma | Female | <65 | I/II | Targeted Molecular therapy | trastuzumab | SD | |
| ACSL4 | SNV | Missense_Mutation | c.134N>A | p.Arg45Lys | p.R45K | O60488 | protein_coding | tolerated(0.18) | benign(0.02) | TCGA-AR-A5QQ-01 | Breast | breast invasive carcinoma | Female | >=65 | III/IV | Chemotherapy | carboplatin | PD | |
| ACSL4 | SNV | Missense_Mutation | c.833C>G | p.Thr278Ser | p.T278S | O60488 | protein_coding | deleterious(0) | probably_damaging(1) | TCGA-B6-A0RG-01 | Breast | breast invasive carcinoma | Female | <65 | I/II | Unknown | Unknown | SD | |
| ACSL4 | SNV | Missense_Mutation | c.746N>T | p.Ser249Leu | p.S249L | O60488 | protein_coding | tolerated(0.21) | benign(0.062) | TCGA-D8-A27G-01 | Breast | breast invasive carcinoma | Female | >=65 | I/II | Unknown | Unknown | SD | |
| ACSL4 | insertion | Frame_Shift_Ins | novel | c.1162_1163insTTTATGCCACACAGTCGGTCCTCAAAATCCTGTCACCCTGG | p.Lys388IlefsTer19 | p.K388Ifs*19 | O60488 | protein_coding | TCGA-AN-A0FK-01 | Breast | breast invasive carcinoma | Female | >=65 | III/IV | Unknown | Unknown | SD | ||
| ACSL4 | deletion | Frame_Shift_Del | novel | c.1500delA | p.Asp501ThrfsTer20 | p.D501Tfs*20 | O60488 | protein_coding | TCGA-D8-A27V-01 | Breast | breast invasive carcinoma | Female | <65 | I/II | Hormone Therapy | tamoxiphen | SD | ||
| ACSL4 | SNV | Missense_Mutation | novel | c.1899N>C | p.Glu633Asp | p.E633D | O60488 | protein_coding | tolerated(0.46) | benign(0) | TCGA-2W-A8YY-01 | Cervix | cervical & endocervical cancer | Female | <65 | I/II | Chemotherapy | cisplatin | CR |
| Page: 1 2 3 4 5 6 7 8 9 10 |
Top |
Related drugs of malignant transformation related genes |
| Identification of chemicals and drugs interact with genes involved in malignant transfromation |
| (DGIdb 4.0) |
| Entrez ID | Symbol | Category | Interaction Types | Drug Claim Name | Drug Name | PMIDs |
| Page: 1 |

Copyright 2023-Present -The University of Texas Health Science Center at Houston |