| Tissue | Expression Dynamics | Abbreviation |
| Cervix | 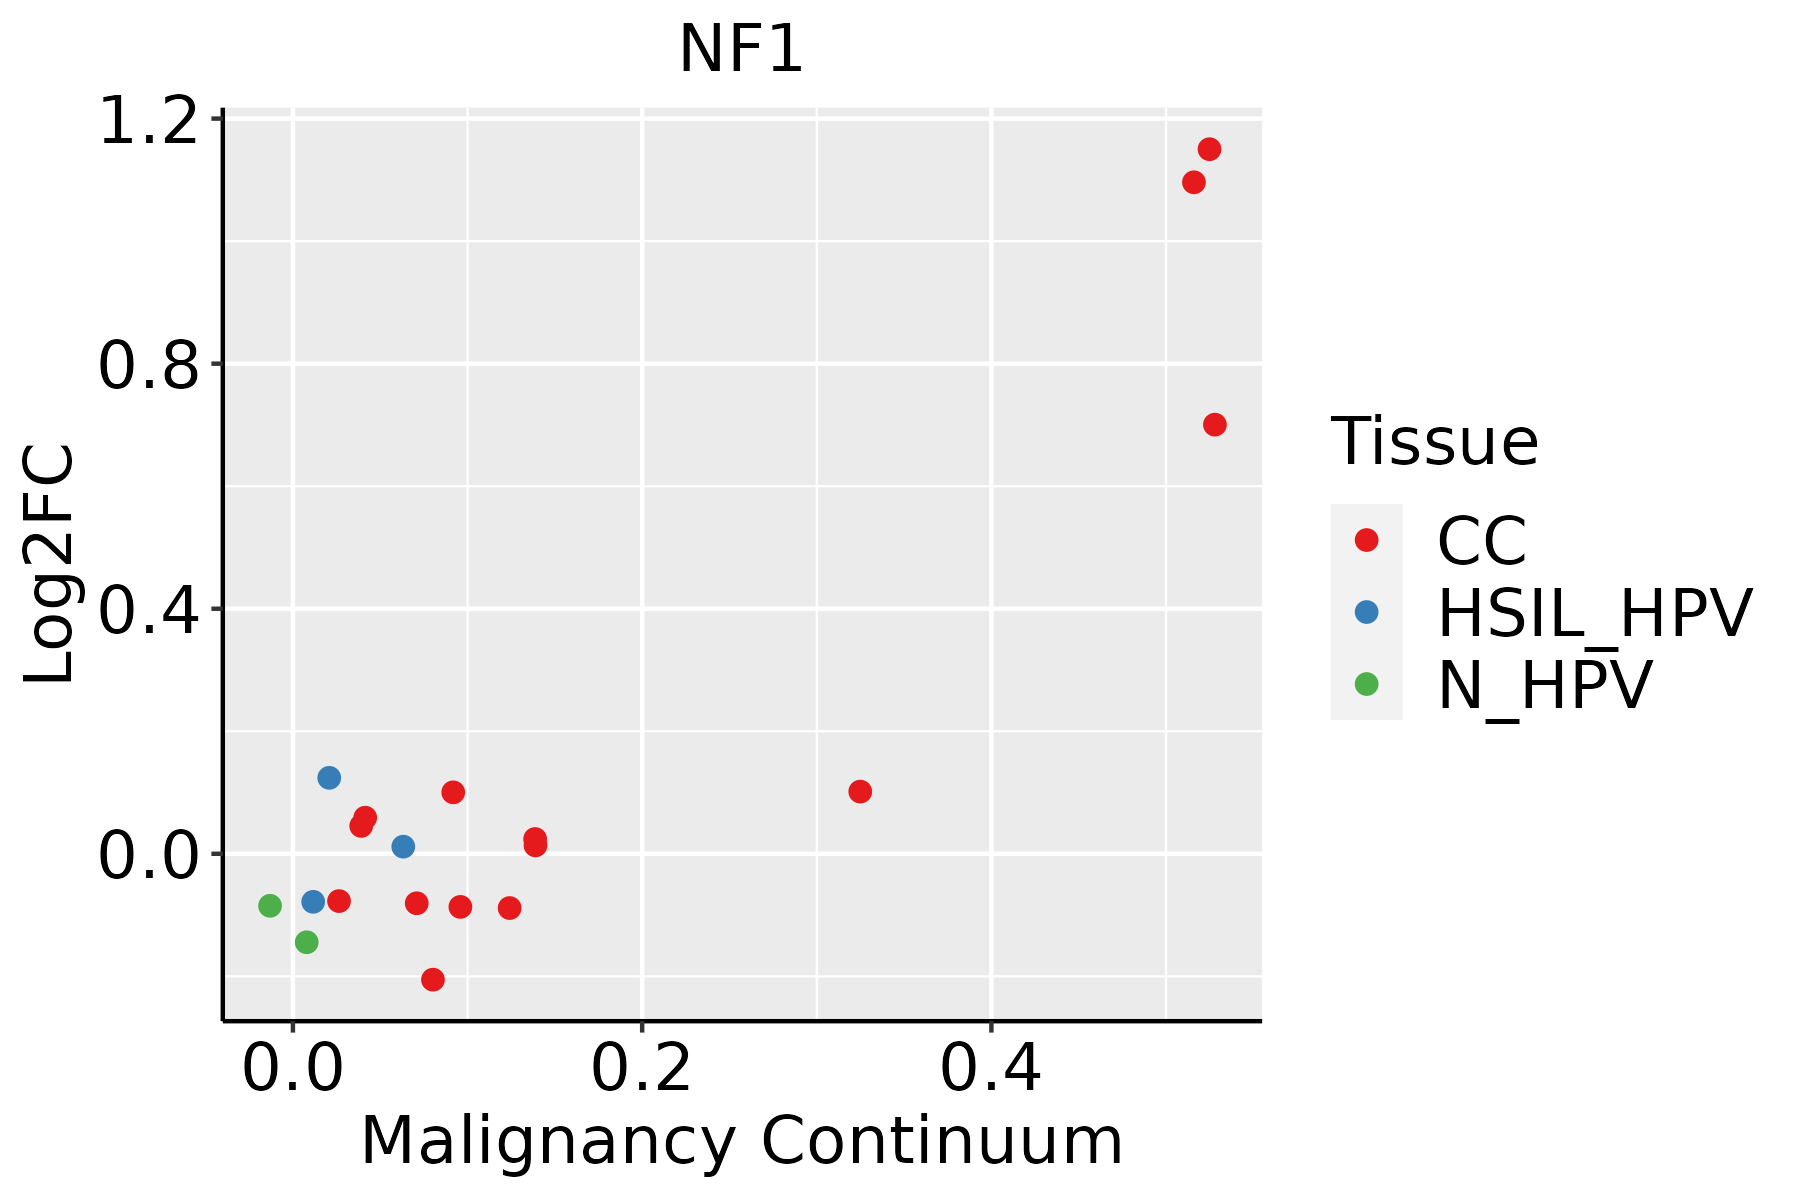 | CC: Cervix cancer |
| HSIL_HPV: HPV-infected high-grade squamous intraepithelial lesions |
| N_HPV: HPV-infected normal cervix |
| Colorectum (GSE201348) |  | FAP: Familial adenomatous polyposis |
| CRC: Colorectal cancer |
| Colorectum (HTA11) |  | AD: Adenomas |
| SER: Sessile serrated lesions |
| MSI-H: Microsatellite-high colorectal cancer |
| MSS: Microsatellite stable colorectal cancer |
| Endometrium | 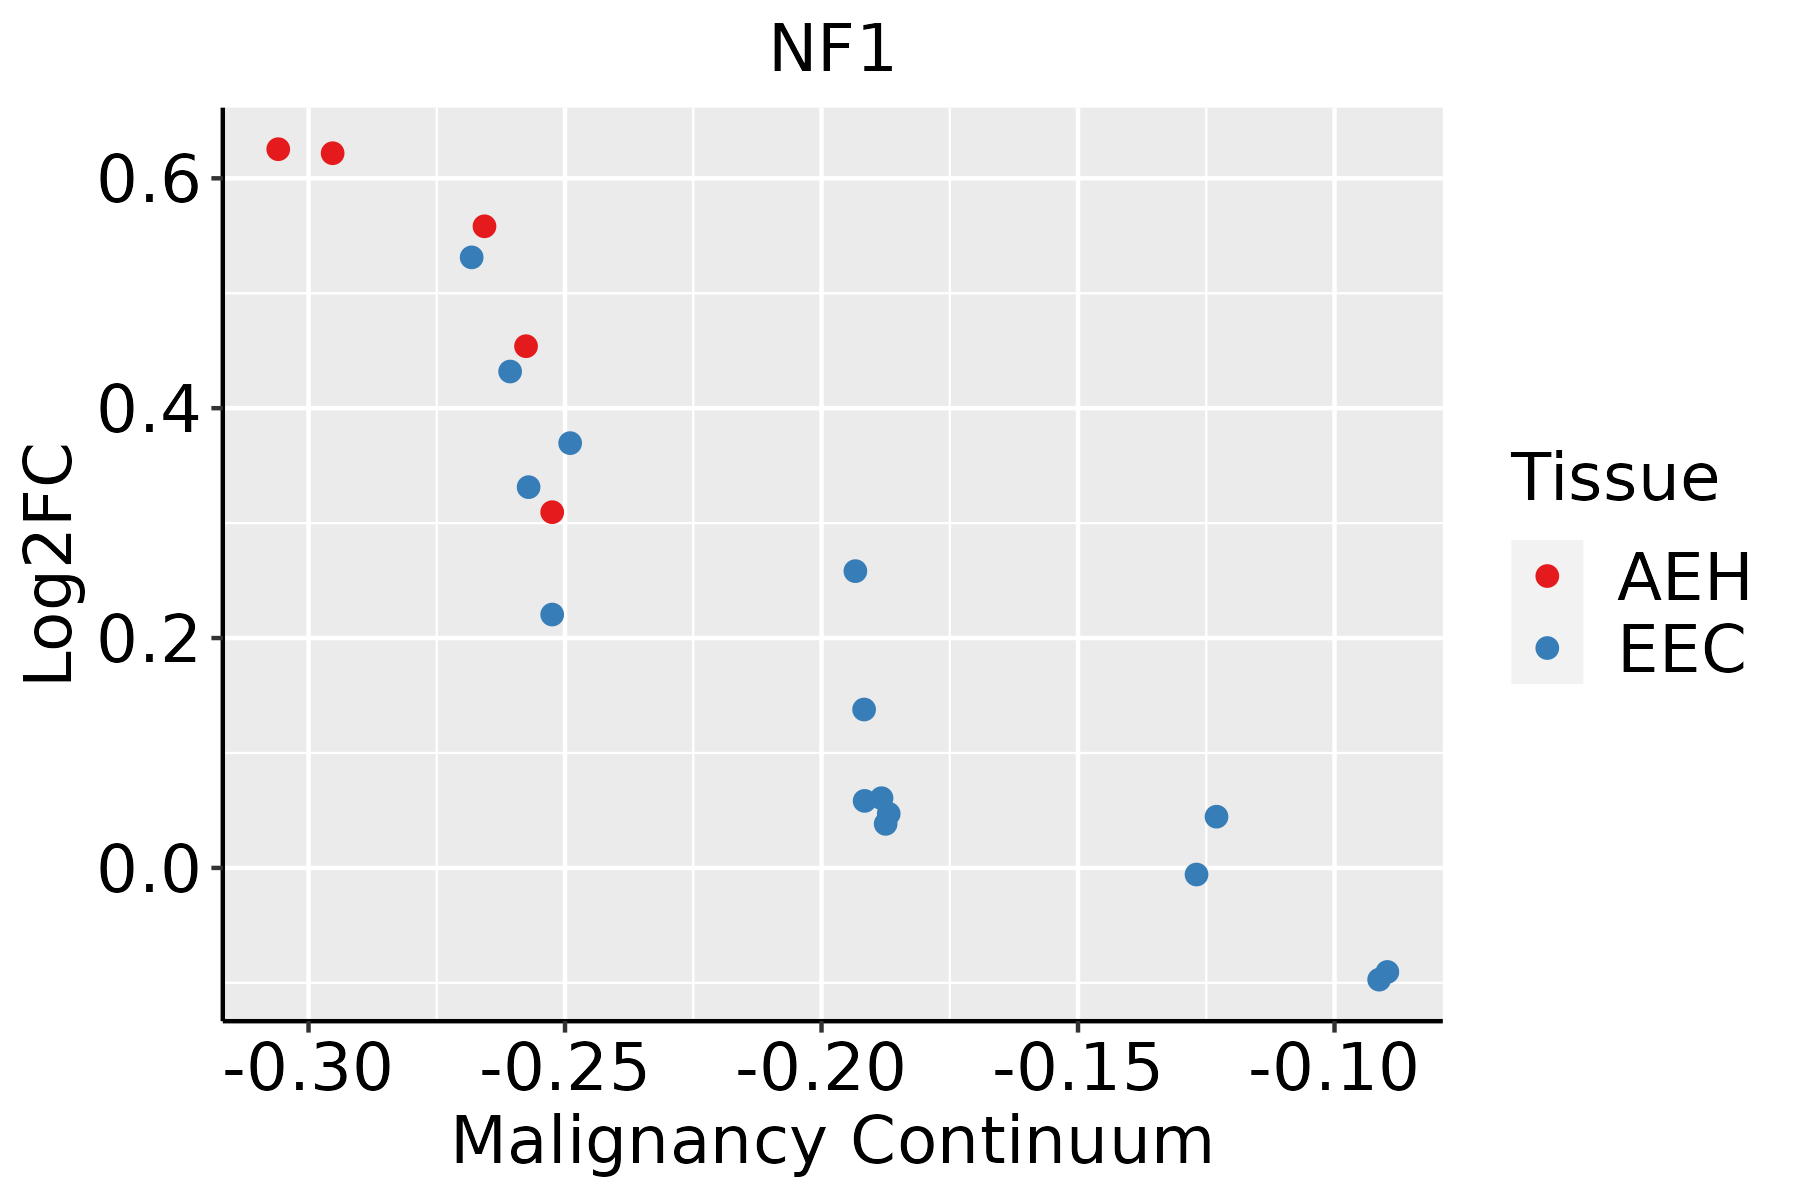 | AEH: Atypical endometrial hyperplasia |
| EEC: Endometrioid Cancer |
| Esophagus | 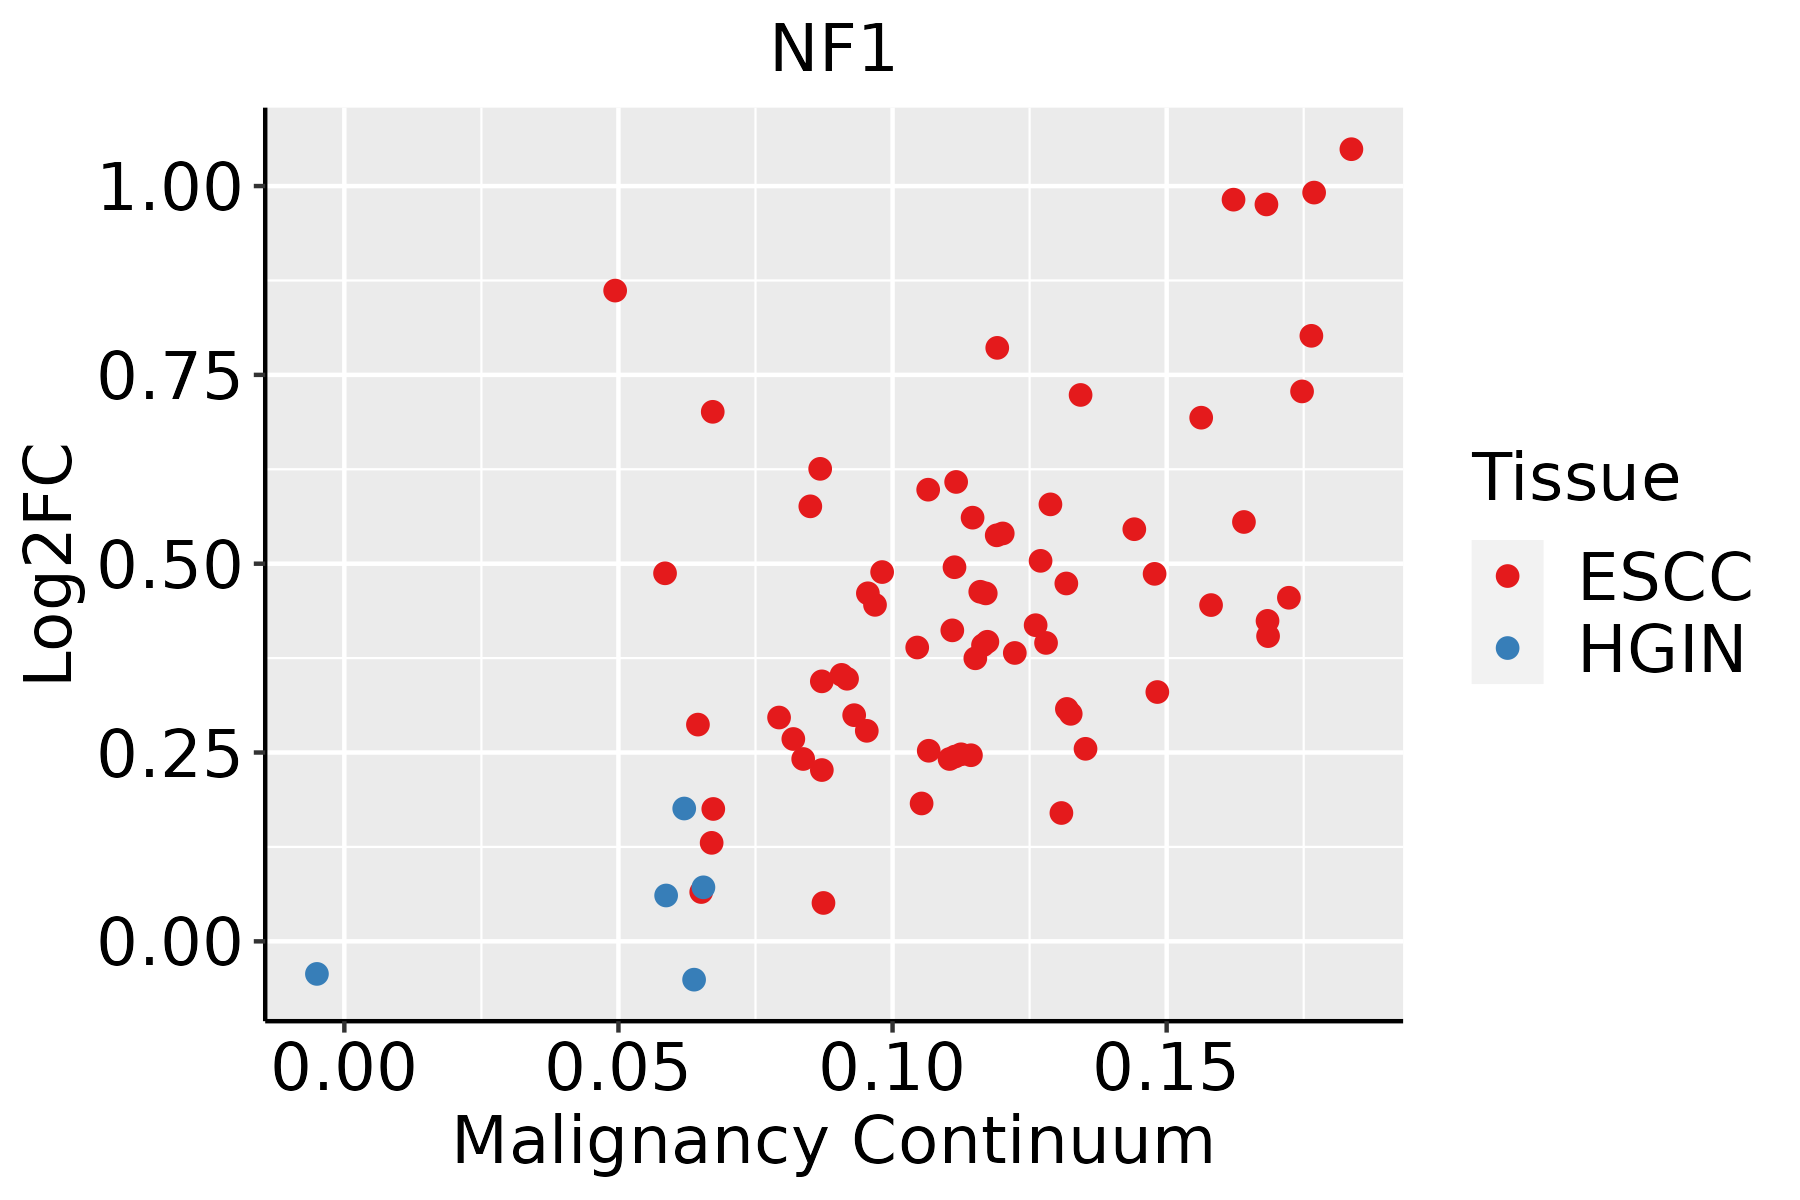 | ESCC: Esophageal squamous cell carcinoma |
| HGIN: High-grade intraepithelial neoplasias |
| LGIN: Low-grade intraepithelial neoplasias |
| Liver |  | HCC: Hepatocellular carcinoma |
| NAFLD: Non-alcoholic fatty liver disease |
| Lung |  | AAH: Atypical adenomatous hyperplasia |
| AIS: Adenocarcinoma in situ |
| IAC: Invasive lung adenocarcinoma |
| MIA: Minimally invasive adenocarcinoma |
| Oral Cavity |  | EOLP: Erosive Oral lichen planus |
| LP: leukoplakia |
| NEOLP: Non-erosive oral lichen planus |
| OSCC: Oral squamous cell carcinoma |
| Prostate | 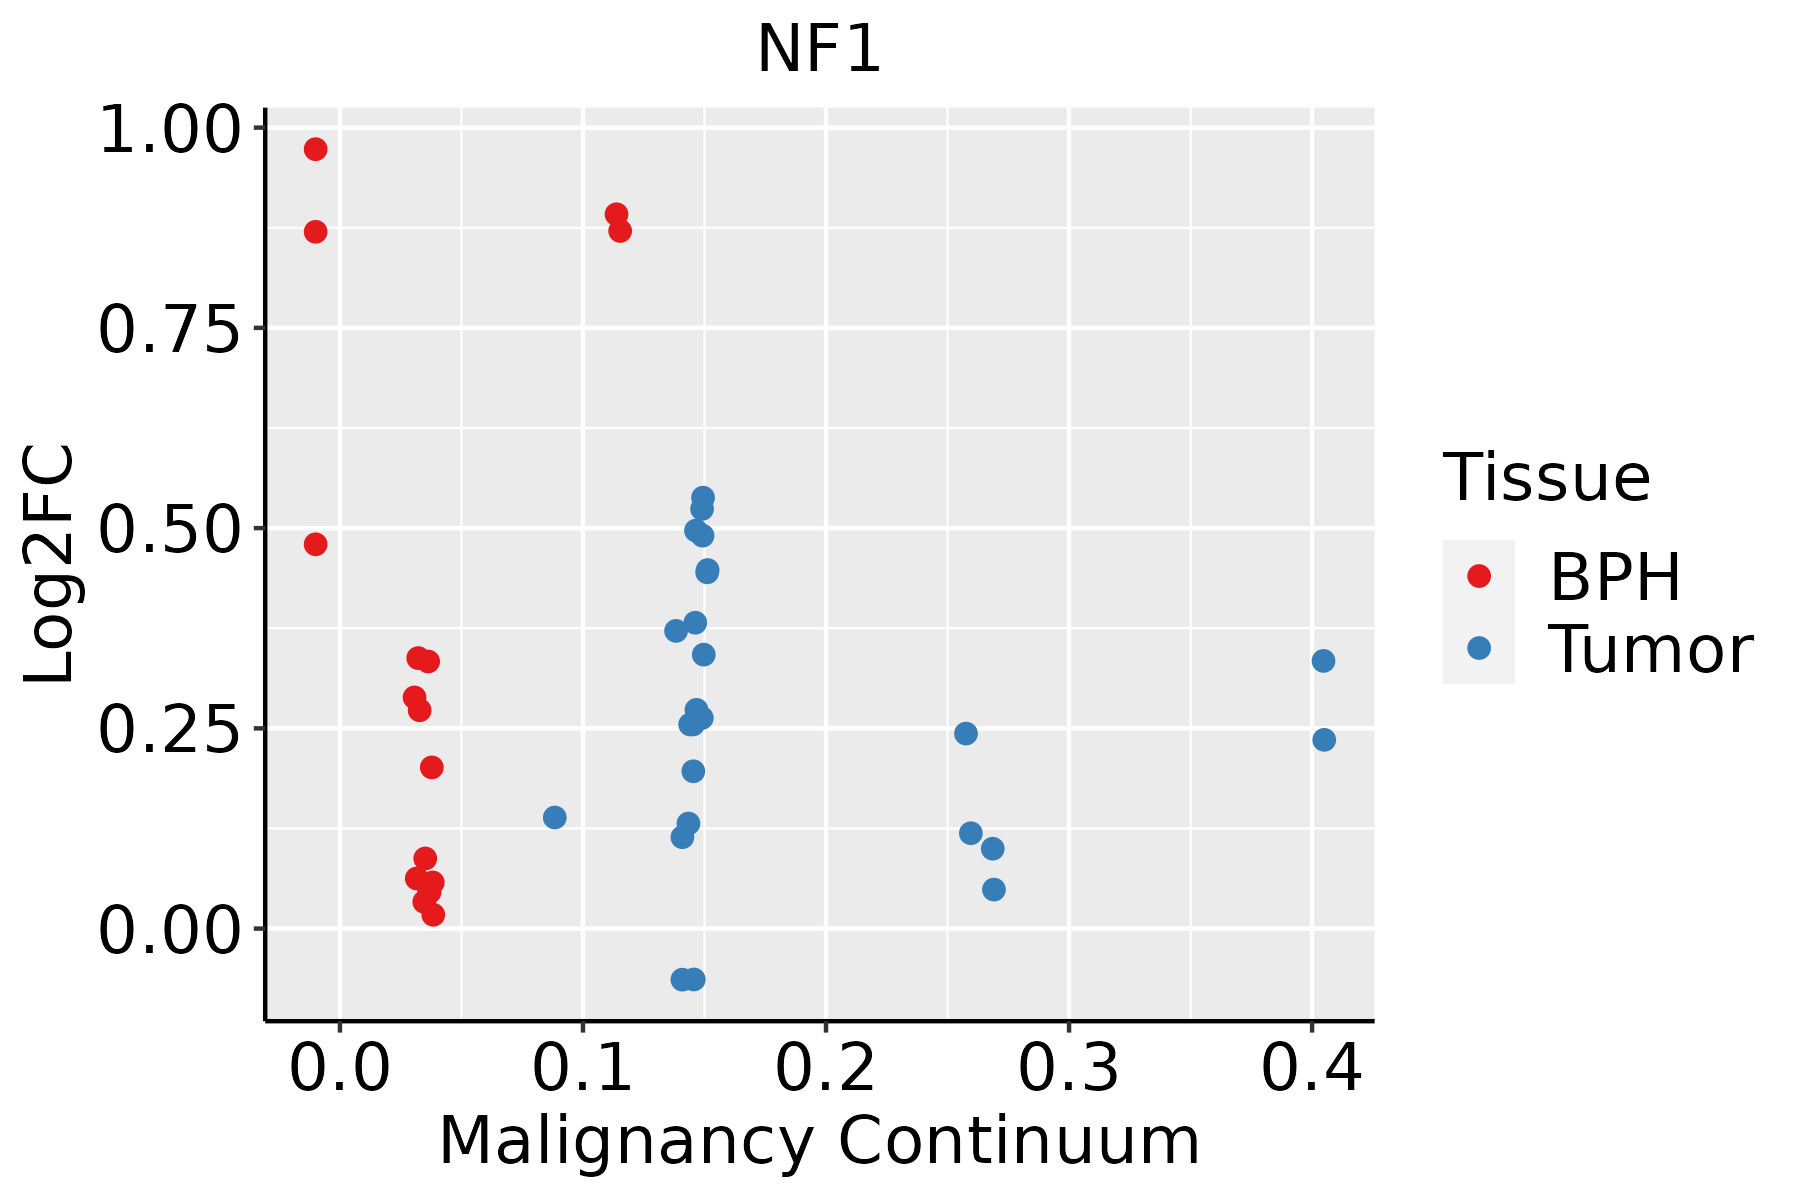 | BPH: Benign Prostatic Hyperplasia |
| Skin | 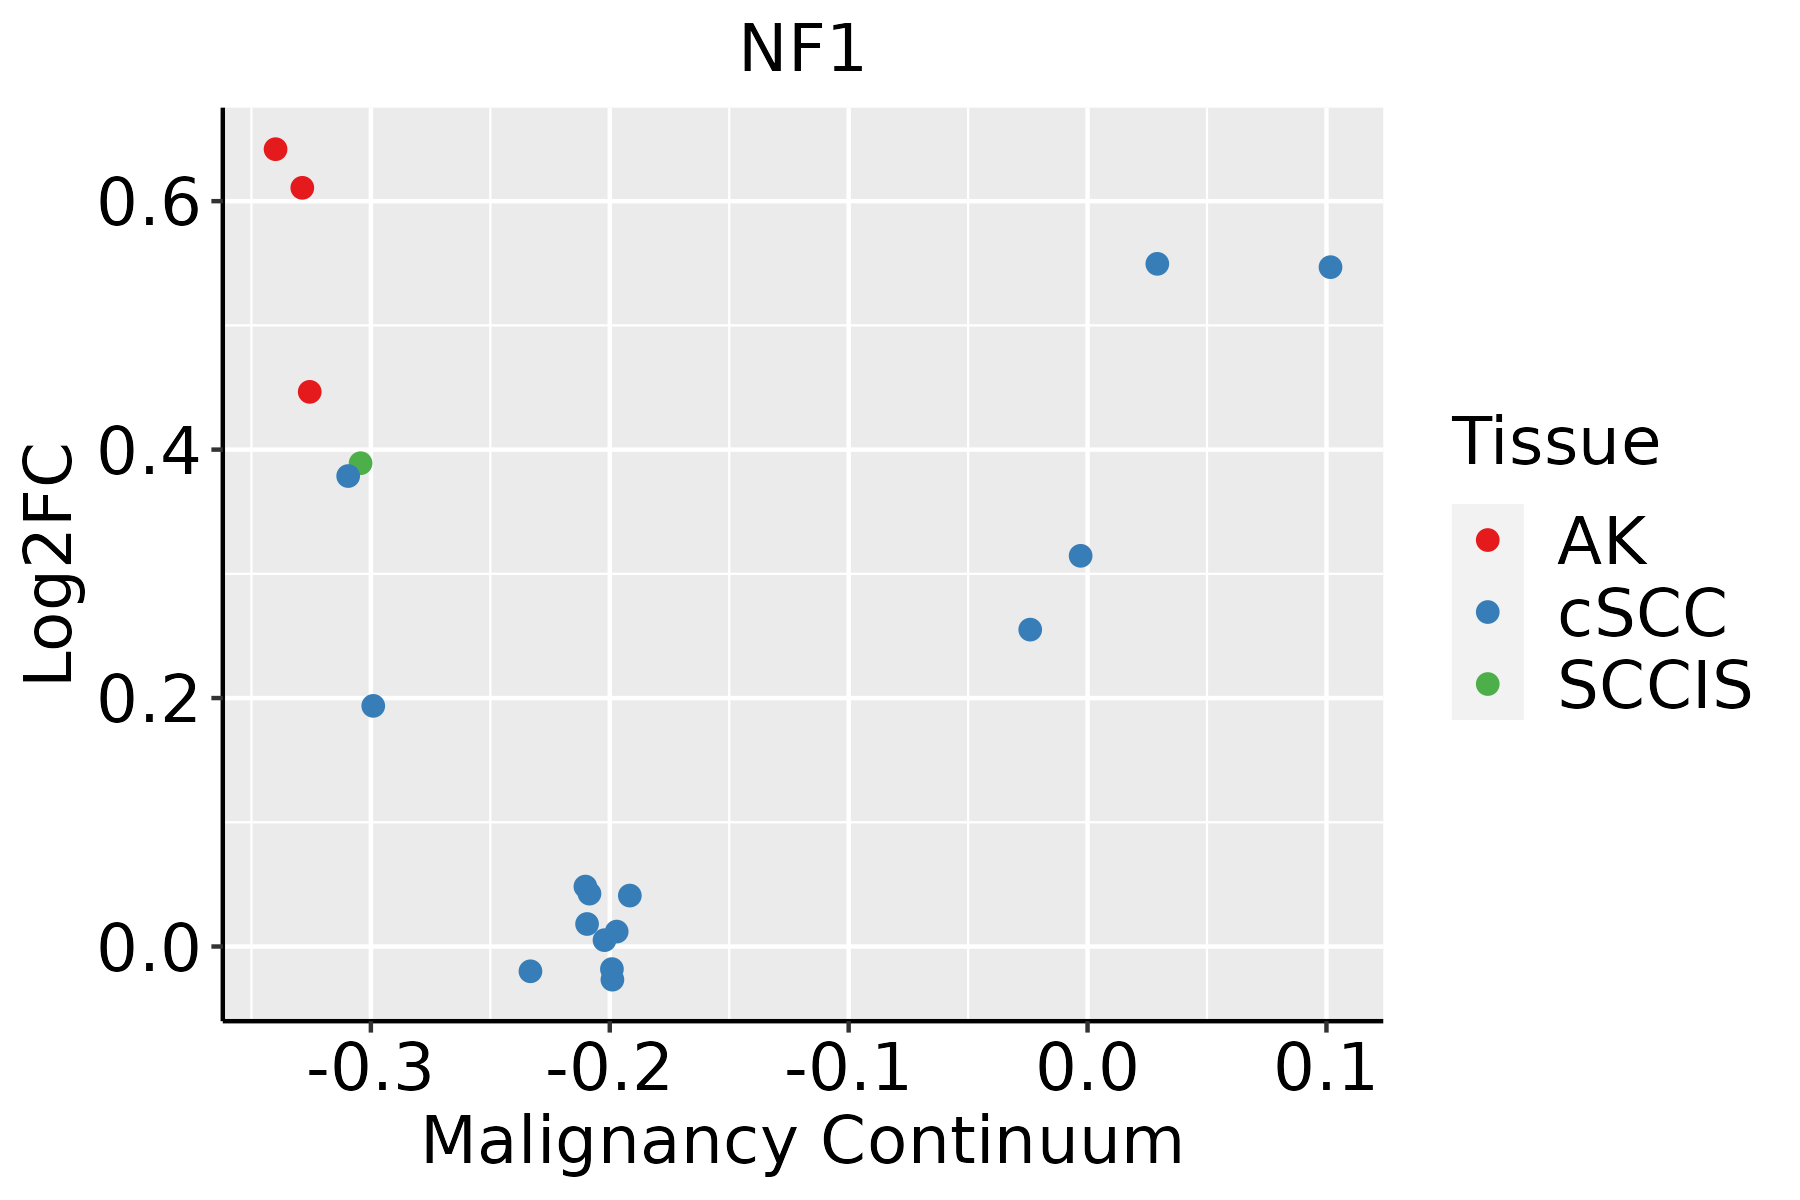 | AK: Actinic keratosis |
| cSCC: Cutaneous squamous cell carcinoma |
| SCCIS:squamous cell carcinoma in situ |
| Thyroid | 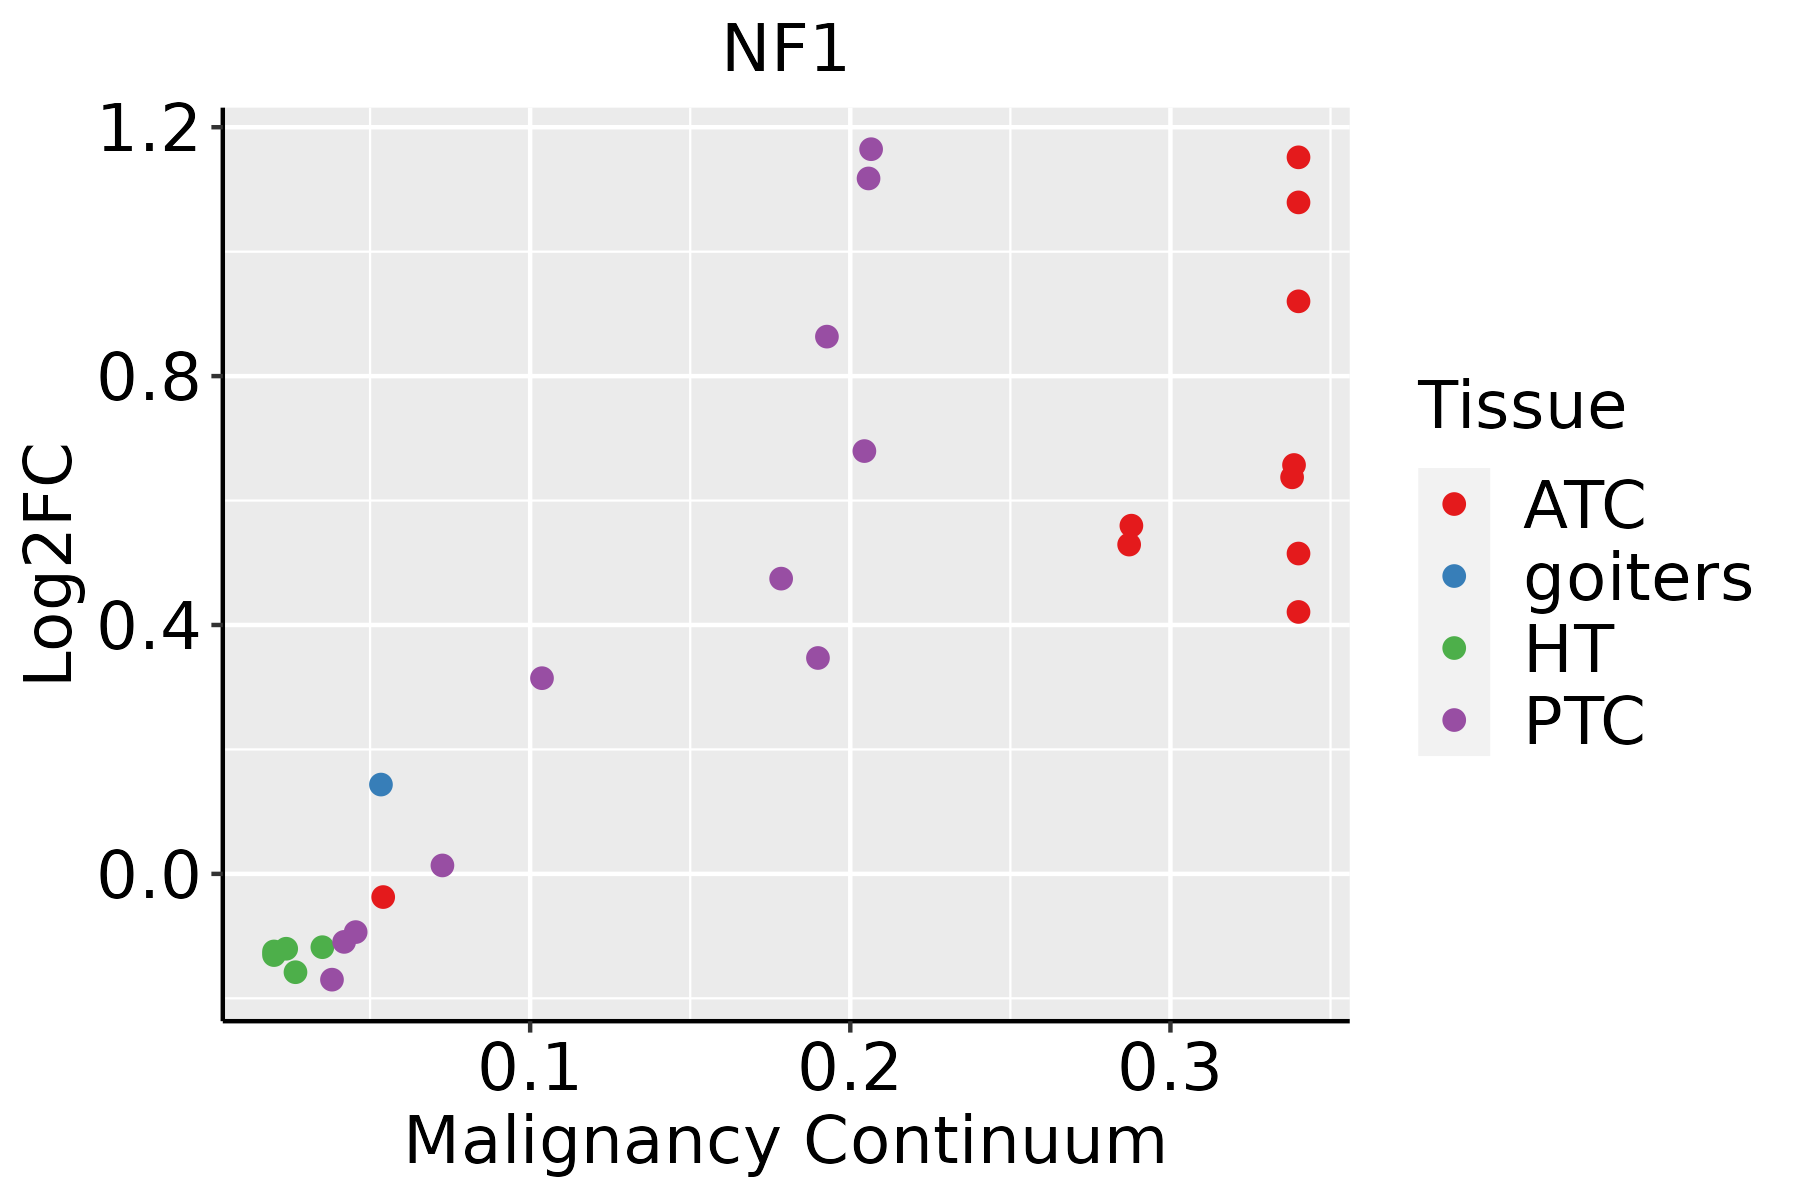 | ATC: Anaplastic thyroid cancer |
| HT: Hashimoto's thyroiditis |
| PTC: Papillary thyroid cancer |
| GO ID | Tissue | Disease Stage | Description | Gene Ratio | Bg Ratio | pvalue | p.adjust | Count |
| GO:000020914 | Prostate | Tumor | protein polyubiquitination | 64/3246 | 236/18723 | 1.08e-04 | 1.03e-03 | 64 |
| GO:000931415 | Prostate | Tumor | response to radiation | 109/3246 | 456/18723 | 1.94e-04 | 1.70e-03 | 109 |
| GO:200014614 | Prostate | Tumor | negative regulation of cell motility | 89/3246 | 359/18723 | 1.99e-04 | 1.74e-03 | 89 |
| GO:003428419 | Prostate | Tumor | response to monosaccharide | 60/3246 | 225/18723 | 2.84e-04 | 2.31e-03 | 60 |
| GO:000182213 | Prostate | Tumor | kidney development | 74/3246 | 293/18723 | 3.68e-04 | 2.87e-03 | 74 |
| GO:001059413 | Prostate | Tumor | regulation of endothelial cell migration | 61/3246 | 232/18723 | 3.81e-04 | 2.96e-03 | 61 |
| GO:004001313 | Prostate | Tumor | negative regulation of locomotion | 94/3246 | 391/18723 | 4.20e-04 | 3.21e-03 | 94 |
| GO:003033613 | Prostate | Tumor | negative regulation of cell migration | 84/3246 | 344/18723 | 4.95e-04 | 3.66e-03 | 84 |
| GO:000974319 | Prostate | Tumor | response to carbohydrate | 65/3246 | 253/18723 | 4.97e-04 | 3.66e-03 | 65 |
| GO:005196211 | Prostate | Tumor | positive regulation of nervous system development | 69/3246 | 272/18723 | 4.99e-04 | 3.67e-03 | 69 |
| GO:007200113 | Prostate | Tumor | renal system development | 75/3246 | 302/18723 | 5.74e-04 | 4.13e-03 | 75 |
| GO:005140216 | Prostate | Tumor | neuron apoptotic process | 63/3246 | 246/18723 | 6.56e-04 | 4.66e-03 | 63 |
| GO:000974618 | Prostate | Tumor | response to hexose | 57/3246 | 219/18723 | 7.59e-04 | 5.20e-03 | 57 |
| GO:00719011 | Prostate | Tumor | negative regulation of protein serine/threonine kinase activity | 35/3246 | 120/18723 | 9.20e-04 | 6.08e-03 | 35 |
| GO:000828614 | Prostate | Tumor | insulin receptor signaling pathway | 34/3246 | 116/18723 | 9.83e-04 | 6.36e-03 | 34 |
| GO:005196011 | Prostate | Tumor | regulation of nervous system development | 102/3246 | 443/18723 | 1.20e-03 | 7.60e-03 | 102 |
| GO:004206312 | Prostate | Tumor | gliogenesis | 73/3246 | 301/18723 | 1.35e-03 | 8.46e-03 | 73 |
| GO:007154812 | Prostate | Tumor | response to dexamethasone | 15/3246 | 39/18723 | 1.42e-03 | 8.80e-03 | 15 |
| GO:000974916 | Prostate | Tumor | response to glucose | 54/3246 | 212/18723 | 1.74e-03 | 1.03e-02 | 54 |
| GO:007154912 | Prostate | Tumor | cellular response to dexamethasone stimulus | 12/3246 | 29/18723 | 2.02e-03 | 1.16e-02 | 12 |
| Pathway ID | Tissue | Disease Stage | Description | Gene Ratio | Bg Ratio | pvalue | p.adjust | qvalue | Count |
| hsa040142 | Cervix | CC | Ras signaling pathway | 51/1267 | 236/8465 | 3.55e-03 | 1.34e-02 | 7.91e-03 | 51 |
| hsa040109 | Cervix | CC | MAPK signaling pathway | 62/1267 | 302/8465 | 4.89e-03 | 1.67e-02 | 9.86e-03 | 62 |
| hsa0401411 | Cervix | CC | Ras signaling pathway | 51/1267 | 236/8465 | 3.55e-03 | 1.34e-02 | 7.91e-03 | 51 |
| hsa0401012 | Cervix | CC | MAPK signaling pathway | 62/1267 | 302/8465 | 4.89e-03 | 1.67e-02 | 9.86e-03 | 62 |
| hsa01521 | Colorectum | AD | EGFR tyrosine kinase inhibitor resistance | 29/2092 | 79/8465 | 1.15e-02 | 4.24e-02 | 2.71e-02 | 29 |
| hsa015211 | Colorectum | AD | EGFR tyrosine kinase inhibitor resistance | 29/2092 | 79/8465 | 1.15e-02 | 4.24e-02 | 2.71e-02 | 29 |
| hsa015212 | Colorectum | FAP | EGFR tyrosine kinase inhibitor resistance | 26/1404 | 79/8465 | 2.69e-04 | 2.19e-03 | 1.33e-03 | 26 |
| hsa04010 | Colorectum | FAP | MAPK signaling pathway | 68/1404 | 302/8465 | 4.00e-03 | 1.67e-02 | 1.02e-02 | 68 |
| hsa015213 | Colorectum | FAP | EGFR tyrosine kinase inhibitor resistance | 26/1404 | 79/8465 | 2.69e-04 | 2.19e-03 | 1.33e-03 | 26 |
| hsa040101 | Colorectum | FAP | MAPK signaling pathway | 68/1404 | 302/8465 | 4.00e-03 | 1.67e-02 | 1.02e-02 | 68 |
| hsa015214 | Colorectum | CRC | EGFR tyrosine kinase inhibitor resistance | 22/1091 | 79/8465 | 2.89e-04 | 3.45e-03 | 2.34e-03 | 22 |
| hsa04014 | Colorectum | CRC | Ras signaling pathway | 49/1091 | 236/8465 | 4.04e-04 | 4.50e-03 | 3.05e-03 | 49 |
| hsa040102 | Colorectum | CRC | MAPK signaling pathway | 56/1091 | 302/8465 | 2.76e-03 | 1.77e-02 | 1.20e-02 | 56 |
| hsa015215 | Colorectum | CRC | EGFR tyrosine kinase inhibitor resistance | 22/1091 | 79/8465 | 2.89e-04 | 3.45e-03 | 2.34e-03 | 22 |
| hsa040141 | Colorectum | CRC | Ras signaling pathway | 49/1091 | 236/8465 | 4.04e-04 | 4.50e-03 | 3.05e-03 | 49 |
| hsa040103 | Colorectum | CRC | MAPK signaling pathway | 56/1091 | 302/8465 | 2.76e-03 | 1.77e-02 | 1.20e-02 | 56 |
| hsa0152110 | Esophagus | ESCC | EGFR tyrosine kinase inhibitor resistance | 55/4205 | 79/8465 | 2.44e-04 | 8.78e-04 | 4.50e-04 | 55 |
| hsa0152115 | Esophagus | ESCC | EGFR tyrosine kinase inhibitor resistance | 55/4205 | 79/8465 | 2.44e-04 | 8.78e-04 | 4.50e-04 | 55 |
| hsa015216 | Liver | Cirrhotic | EGFR tyrosine kinase inhibitor resistance | 35/2530 | 79/8465 | 4.50e-03 | 1.70e-02 | 1.05e-02 | 35 |
| hsa0152111 | Liver | Cirrhotic | EGFR tyrosine kinase inhibitor resistance | 35/2530 | 79/8465 | 4.50e-03 | 1.70e-02 | 1.05e-02 | 35 |
| TF | Cell Type | Tissue | Disease Stage | Target Gene | RSS | Regulon Activity |
| NF1 | ISLET | Pancreas | Healthy | PWRN1,TMEM260,LRIG3, etc. | 2.22e-02 |  |
| NF1 | MSC | Prostate | ADJ | CCDC102B,NARS2,CADPS, etc. | 4.55e-02 |  |
| NF1 | MSC | Prostate | BPH | CCDC102B,NARS2,CADPS, etc. | 2.75e-03 |  |
| NF1 | FIB | Prostate | Healthy | CCDC102B,NARS2,CADPS, etc. | 7.69e-03 |  |
| NF1 | MSC | Prostate | Tumor | CCDC102B,NARS2,CADPS, etc. | 1.59e-02 |  |
| Hugo Symbol | Variant Class | Variant Classification | dbSNP RS | HGVSc | HGVSp | HGVSp Short | SWISSPROT | BIOTYPE | SIFT | PolyPhen | Tumor Sample Barcode | Tissue | Histology | Sex | Age | Stage | Therapy Types | Drugs | Outcome |
| NF1 | SNV | Missense_Mutation | | c.1570N>C | p.Glu524Gln | p.E524Q | P21359 | protein_coding | tolerated(0.1) | possibly_damaging(0.732) | TCGA-A2-A0YK-01 | Breast | breast invasive carcinoma | Female | <65 | I/II | Chemotherapy | cytoxan | SD |
| NF1 | SNV | Missense_Mutation | novel | c.374N>C | p.Arg125Pro | p.R125P | P21359 | protein_coding | tolerated(0.21) | possibly_damaging(0.567) | TCGA-A7-A6VY-01 | Breast | breast invasive carcinoma | Female | <65 | I/II | Chemotherapy | cyclophosphamide | CR |
| NF1 | SNV | Missense_Mutation | | c.4054N>G | p.Ser1352Gly | p.S1352G | P21359 | protein_coding | tolerated(0.21) | benign(0.012) | TCGA-A8-A06X-01 | Breast | breast invasive carcinoma | Female | >=65 | I/II | Unknown | Unknown | SD |
| NF1 | SNV | Missense_Mutation | | c.3917G>A | p.Arg1306Gln | p.R1306Q | P21359 | protein_coding | tolerated(0.65) | benign(0.19) | TCGA-A8-A083-01 | Breast | breast invasive carcinoma | Female | >=65 | I/II | Unknown | Unknown | SD |
| NF1 | SNV | Missense_Mutation | | c.2147A>T | p.Glu716Val | p.E716V | P21359 | protein_coding | deleterious(0) | probably_damaging(0.983) | TCGA-AC-A23C-01 | Breast | breast invasive carcinoma | Female | <65 | I/II | Chemotherapy | chemo | CR |
| NF1 | SNV | Missense_Mutation | | c.7053N>G | p.Phe2351Leu | p.F2351L | P21359 | protein_coding | tolerated(0.08) | benign(0.063) | TCGA-AN-A0XW-01 | Breast | breast invasive carcinoma | Female | <65 | III/IV | Unknown | Unknown | SD |
| NF1 | SNV | Missense_Mutation | | c.3748C>T | p.Arg1250Trp | p.R1250W | P21359 | protein_coding | deleterious(0) | probably_damaging(0.973) | TCGA-AO-A12H-01 | Breast | breast invasive carcinoma | Female | >=65 | I/II | Hormone Therapy | arimidex | SD |
| NF1 | SNV | Missense_Mutation | rs876660206 | c.4341G>C | p.Gln1447His | p.Q1447H | P21359 | protein_coding | deleterious(0.01) | possibly_damaging(0.905) | TCGA-AR-A1AW-01 | Breast | breast invasive carcinoma | Female | >=65 | I/II | Chemotherapy | docetaxel | SD |
| NF1 | SNV | Missense_Mutation | novel | c.5713A>C | p.Thr1905Pro | p.T1905P | P21359 | protein_coding | deleterious(0) | probably_damaging(0.961) | TCGA-AR-A1AY-01 | Breast | breast invasive carcinoma | Female | >=65 | I/II | Unspecific | Doxorubicin | SD |
| NF1 | SNV | Missense_Mutation | rs774893767 | c.5680G>C | p.Glu1894Gln | p.E1894Q | P21359 | protein_coding | deleterious(0.02) | possibly_damaging(0.867) | TCGA-B6-A0IB-01 | Breast | breast invasive carcinoma | Female | <65 | III/IV | Unknown | Unknown | PD |
| Entrez ID | Symbol | Category | Interaction Types | Drug Claim Name | Drug Name | PMIDs |
| 4763 | NF1 | CLINICALLY ACTIONABLE, DRUG RESISTANCE | | MEK162 | BINIMETINIB | |
| 4763 | NF1 | CLINICALLY ACTIONABLE, DRUG RESISTANCE | | VEMURAFENIB | VEMURAFENIB | 23288408 |
| 4763 | NF1 | CLINICALLY ACTIONABLE, DRUG RESISTANCE | | PD-325901 | | |
| 4763 | NF1 | CLINICALLY ACTIONABLE, DRUG RESISTANCE | | SELUMETINIB | SELUMETINIB | |
| 4763 | NF1 | CLINICALLY ACTIONABLE, DRUG RESISTANCE | | MEK INHIBITOR PD0325901 | | 23171796 |
| 4763 | NF1 | CLINICALLY ACTIONABLE, DRUG RESISTANCE | | JQ1 COMPOUND | | 24373973 |
| 4763 | NF1 | CLINICALLY ACTIONABLE, DRUG RESISTANCE | | SIROLIMUS | SIROLIMUS | 23171796 |
| 4763 | NF1 | CLINICALLY ACTIONABLE, DRUG RESISTANCE | | TRAMETINIB | TRAMETINIB | 29127119 |
| 4763 | NF1 | CLINICALLY ACTIONABLE, DRUG RESISTANCE | | Trametinib | TRAMETINIB | |
| 4763 | NF1 | CLINICALLY ACTIONABLE, DRUG RESISTANCE | | Cobimetinib | COBIMETINIB | |


