
|
|||||
|
 | |
| |
| |
| |
| |
| |
|
Gene: ZNF3 |
Gene summary for ZNF3 |
| Gene information | Species | Human | Gene symbol | ZNF3 | Gene ID | 7551 |
| Gene name | zinc finger protein 3 | |
| Gene Alias | A8-51 | |
| Cytomap | 7q22.1 | |
| Gene Type | protein-coding | GO ID | GO:0000122 | UniProtAcc | P17036 |
Top |
Malignant transformation analysis |
| Identification of the aberrant gene expression in precancerous and cancerous lesions by comparing the gene expression of stem-like cells in diseased tissues with normal stem cells |
| Entrez ID | Symbol | Replicates | Species | Organ | Tissue | Adj P-value | Log2FC | Malignancy |
| 7551 | ZNF3 | LZE7T | Human | Esophagus | ESCC | 1.22e-02 | 2.54e-01 | 0.0667 |
| 7551 | ZNF3 | LZE20T | Human | Esophagus | ESCC | 8.69e-06 | 1.93e-01 | 0.0662 |
| 7551 | ZNF3 | LZE22T | Human | Esophagus | ESCC | 3.38e-05 | 3.93e-01 | 0.068 |
| 7551 | ZNF3 | LZE24T | Human | Esophagus | ESCC | 2.72e-11 | 2.95e-01 | 0.0596 |
| 7551 | ZNF3 | P1T-E | Human | Esophagus | ESCC | 8.00e-06 | 3.01e-01 | 0.0875 |
| 7551 | ZNF3 | P2T-E | Human | Esophagus | ESCC | 4.88e-33 | 5.73e-01 | 0.1177 |
| 7551 | ZNF3 | P4T-E | Human | Esophagus | ESCC | 1.76e-13 | 3.04e-01 | 0.1323 |
| 7551 | ZNF3 | P5T-E | Human | Esophagus | ESCC | 1.59e-09 | 9.91e-02 | 0.1327 |
| 7551 | ZNF3 | P8T-E | Human | Esophagus | ESCC | 1.99e-27 | 2.50e-01 | 0.0889 |
| 7551 | ZNF3 | P9T-E | Human | Esophagus | ESCC | 5.88e-13 | 3.03e-01 | 0.1131 |
| 7551 | ZNF3 | P10T-E | Human | Esophagus | ESCC | 1.48e-35 | 5.92e-01 | 0.116 |
| 7551 | ZNF3 | P11T-E | Human | Esophagus | ESCC | 1.47e-12 | 4.91e-01 | 0.1426 |
| 7551 | ZNF3 | P12T-E | Human | Esophagus | ESCC | 2.39e-35 | 6.93e-01 | 0.1122 |
| 7551 | ZNF3 | P15T-E | Human | Esophagus | ESCC | 1.73e-29 | 6.51e-01 | 0.1149 |
| 7551 | ZNF3 | P16T-E | Human | Esophagus | ESCC | 1.20e-52 | 8.99e-01 | 0.1153 |
| 7551 | ZNF3 | P17T-E | Human | Esophagus | ESCC | 1.15e-06 | 3.54e-01 | 0.1278 |
| 7551 | ZNF3 | P20T-E | Human | Esophagus | ESCC | 3.54e-32 | 7.22e-01 | 0.1124 |
| 7551 | ZNF3 | P21T-E | Human | Esophagus | ESCC | 1.88e-16 | 2.43e-01 | 0.1617 |
| 7551 | ZNF3 | P22T-E | Human | Esophagus | ESCC | 1.07e-17 | 2.77e-01 | 0.1236 |
| 7551 | ZNF3 | P23T-E | Human | Esophagus | ESCC | 1.36e-24 | 6.31e-01 | 0.108 |
| Page: 1 2 3 4 |
| Tissue | Expression Dynamics | Abbreviation |
| Esophagus | 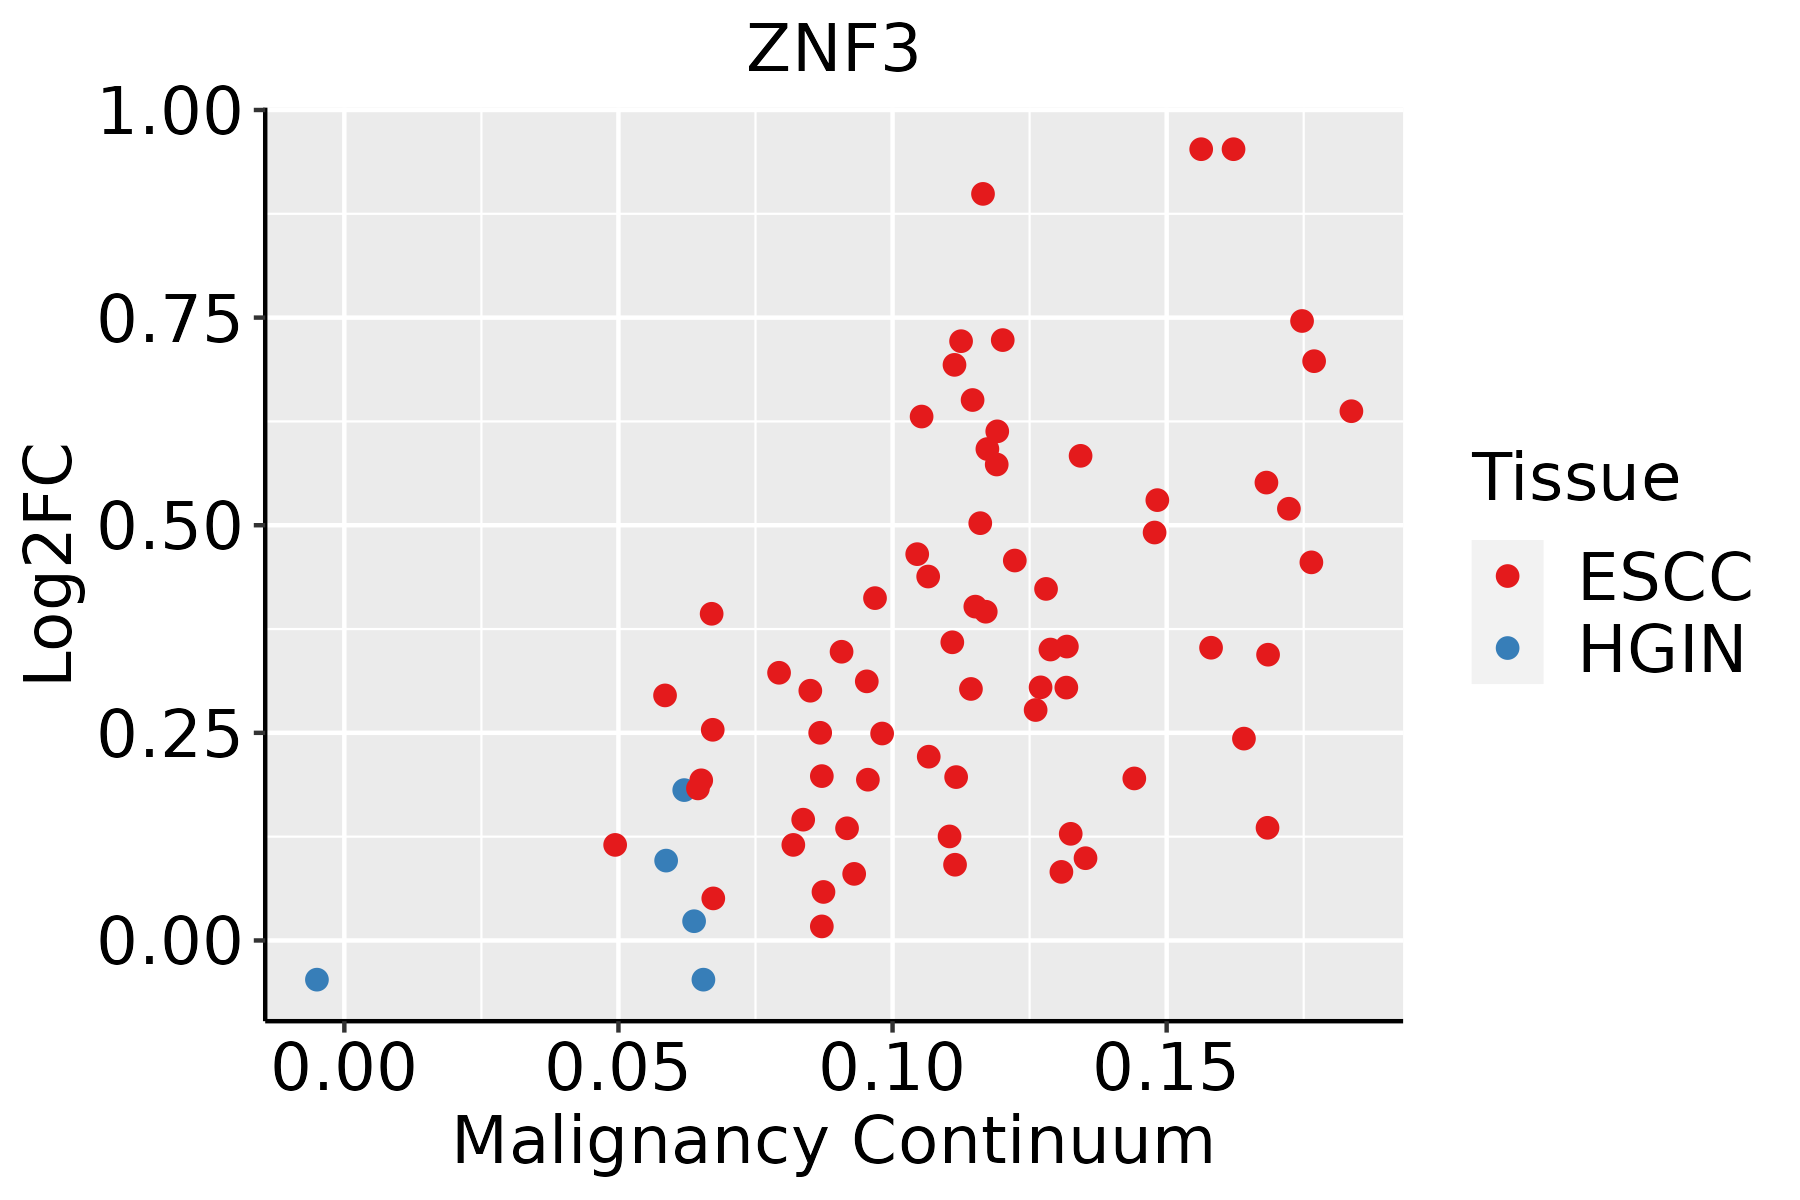 | ESCC: Esophageal squamous cell carcinoma |
| HGIN: High-grade intraepithelial neoplasias | ||
| LGIN: Low-grade intraepithelial neoplasias | ||
| Liver | 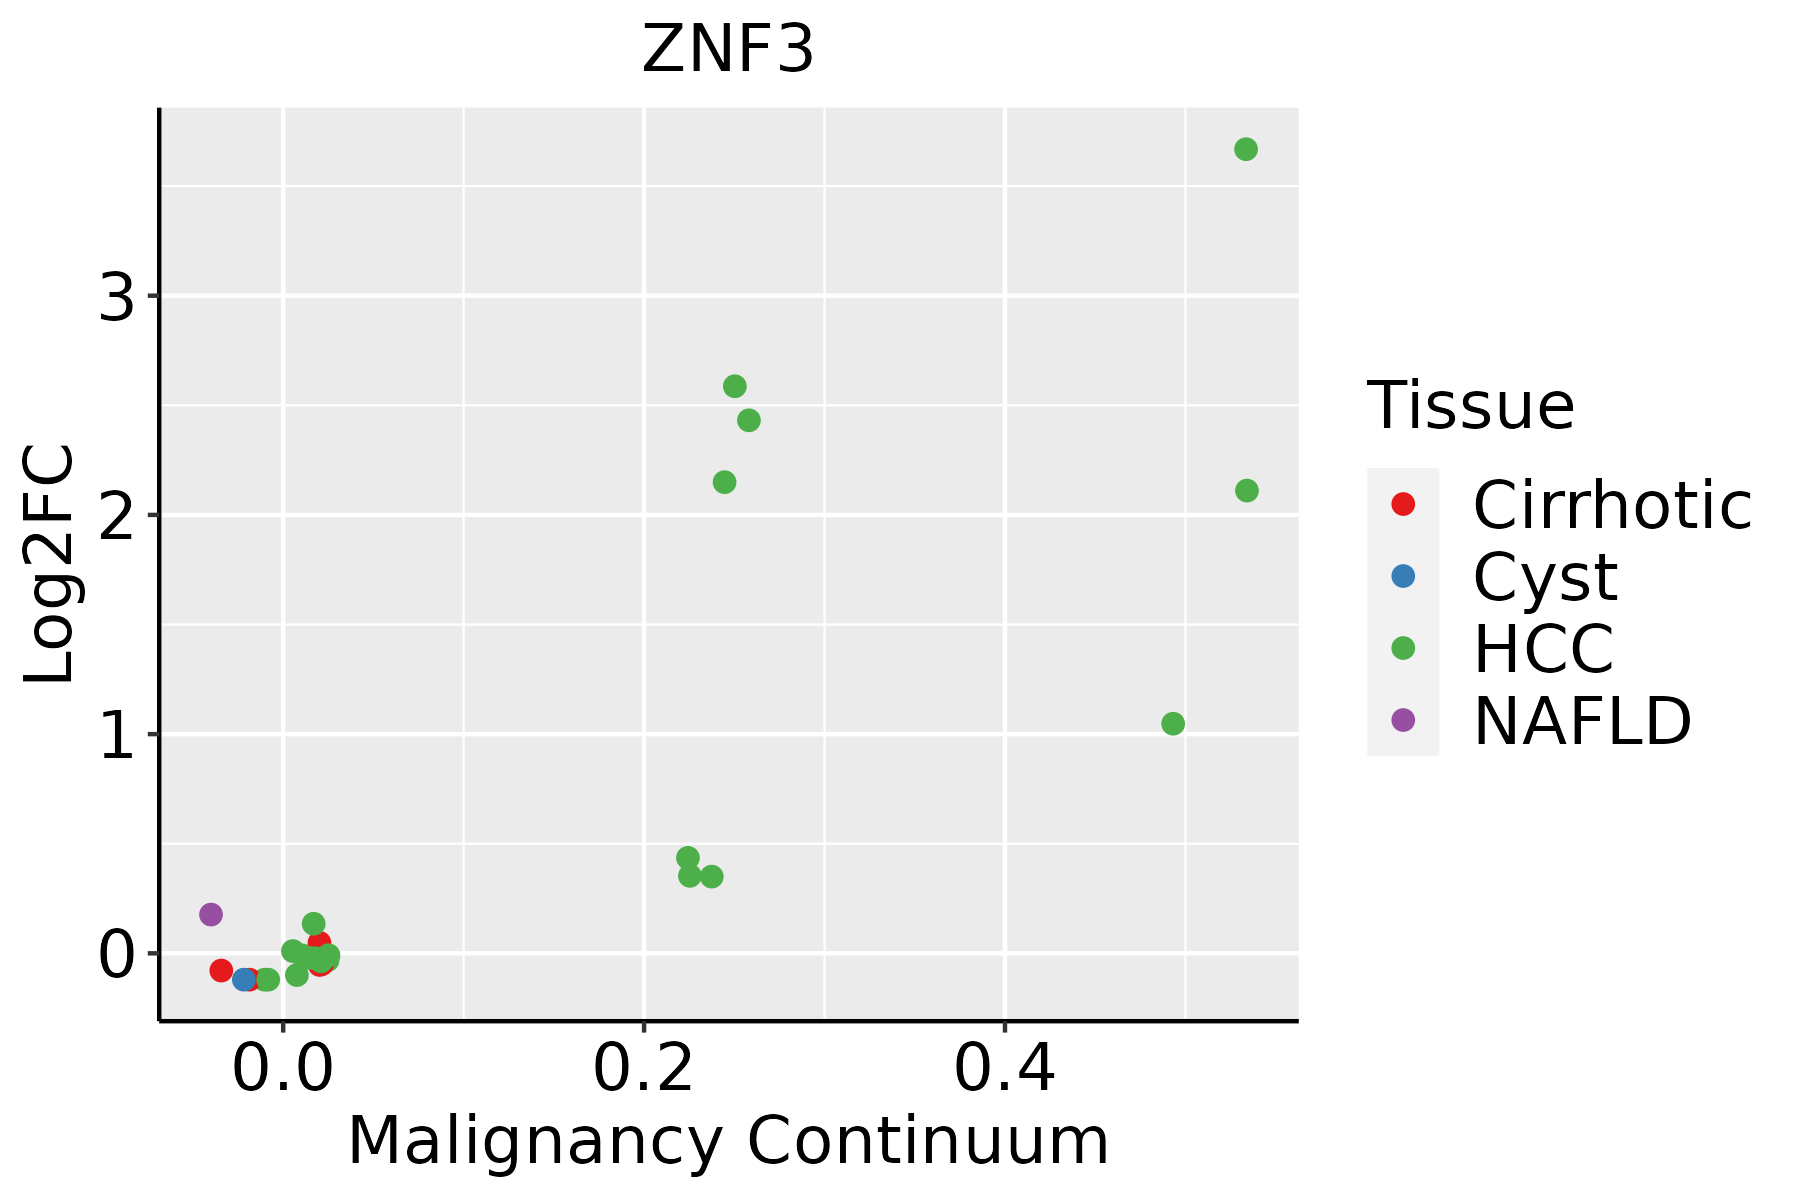 | HCC: Hepatocellular carcinoma |
| NAFLD: Non-alcoholic fatty liver disease | ||
| Oral Cavity |  | EOLP: Erosive Oral lichen planus |
| LP: leukoplakia | ||
| NEOLP: Non-erosive oral lichen planus | ||
| OSCC: Oral squamous cell carcinoma |
| ∗log2FC in expression of this searched gene in stem-like cells from each diseased tissue sample relative to stem-like cells in normal samples in each tissue plotted against the malignancy continuum. Samples are colored based on if they are from different disease stage. |
Top |
Malignant transformation related pathway analysis |
| Find out the enriched GO biological processes and KEGG pathways involved in transition from healthy to precancer to cancer |
| Tissue | Disease Stage | Enriched GO biological Processes |
| Colorectum | AD |  |
| Colorectum | SER |  |
| Colorectum | MSS |  |
| Colorectum | MSI-H |  |
| Colorectum | FAP |  |
| ∗Top 15 enriched GO BP terms are showed in the bar plot of each disease state in each tissue. Each row represents a significant GO biological process which is colored according to the -log10(p.adjust). |
| Page: 1 2 3 4 5 6 7 8 9 |
| GO ID | Tissue | Disease Stage | Description | Gene Ratio | Bg Ratio | pvalue | p.adjust | Count |
| GO:2001020112 | Thyroid | PTC | regulation of response to DNA damage stimulus | 113/5968 | 219/18723 | 9.37e-10 | 2.77e-08 | 113 |
| GO:1901796113 | Thyroid | PTC | regulation of signal transduction by p53 class mediator | 58/5968 | 93/18723 | 1.38e-09 | 3.95e-08 | 58 |
| GO:2001243113 | Thyroid | PTC | negative regulation of intrinsic apoptotic signaling pathway | 60/5968 | 98/18723 | 2.05e-09 | 5.77e-08 | 60 |
| GO:00327846 | Thyroid | PTC | regulation of DNA-templated transcription, elongation | 38/5968 | 53/18723 | 3.07e-09 | 8.43e-08 | 38 |
| GO:0072332113 | Thyroid | PTC | intrinsic apoptotic signaling pathway by p53 class mediator | 48/5968 | 76/18723 | 1.99e-08 | 4.61e-07 | 48 |
| GO:0042771112 | Thyroid | PTC | intrinsic apoptotic signaling pathway in response to DNA damage by p53 class mediator | 30/5968 | 43/18723 | 3.79e-07 | 6.32e-06 | 30 |
| GO:002191514 | Thyroid | PTC | neural tube development | 76/5968 | 152/18723 | 2.40e-06 | 3.17e-05 | 76 |
| GO:0008630112 | Thyroid | PTC | intrinsic apoptotic signaling pathway in response to DNA damage | 54/5968 | 99/18723 | 2.46e-06 | 3.22e-05 | 54 |
| GO:0030099113 | Thyroid | PTC | myeloid cell differentiation | 160/5968 | 381/18723 | 1.75e-05 | 1.82e-04 | 160 |
| GO:004277010 | Thyroid | PTC | signal transduction in response to DNA damage | 81/5968 | 172/18723 | 2.07e-05 | 2.08e-04 | 81 |
| GO:20010216 | Thyroid | PTC | negative regulation of response to DNA damage stimulus | 44/5968 | 81/18723 | 2.34e-05 | 2.33e-04 | 44 |
| GO:004544418 | Thyroid | PTC | fat cell differentiation | 102/5968 | 229/18723 | 3.66e-05 | 3.40e-04 | 102 |
| GO:1901798113 | Thyroid | PTC | positive regulation of signal transduction by p53 class mediator | 18/5968 | 25/18723 | 4.48e-05 | 4.05e-04 | 18 |
| GO:1902253112 | Thyroid | PTC | regulation of intrinsic apoptotic signaling pathway by p53 class mediator | 20/5968 | 29/18723 | 4.54e-05 | 4.09e-04 | 20 |
| GO:20010229 | Thyroid | PTC | positive regulation of response to DNA damage stimulus | 53/5968 | 105/18723 | 5.51e-05 | 4.89e-04 | 53 |
| GO:00082985 | Thyroid | PTC | intracellular mRNA localization | 11/5968 | 13/18723 | 1.34e-04 | 1.05e-03 | 11 |
| GO:009872710 | Thyroid | PTC | maintenance of cell number | 63/5968 | 134/18723 | 1.73e-04 | 1.32e-03 | 63 |
| GO:0030330112 | Thyroid | PTC | DNA damage response, signal transduction by p53 class mediator | 38/5968 | 72/18723 | 1.85e-04 | 1.40e-03 | 38 |
| GO:00603486 | Thyroid | PTC | bone development | 90/5968 | 205/18723 | 1.89e-04 | 1.42e-03 | 90 |
| GO:190222918 | Thyroid | PTC | regulation of intrinsic apoptotic signaling pathway in response to DNA damage | 22/5968 | 36/18723 | 2.85e-04 | 2.02e-03 | 22 |
| Page: 1 2 3 4 5 6 7 8 9 10 11 12 13 14 15 16 17 18 |
| Pathway ID | Tissue | Disease Stage | Description | Gene Ratio | Bg Ratio | pvalue | p.adjust | qvalue | Count |
| Page: 1 |
Top |
Cell-cell communication analysis |
| Identification of potential cell-cell interactions between two cell types and their ligand-receptor pairs for different disease states |
| Ligand | Receptor | LRpair | Pathway | Tissue | Disease Stage |
| Page: 1 |
Top |
Single-cell gene regulatory network inference analysis |
| Find out the significant the regulons (TFs) and the target genes of each regulon across cell types for different disease states |
| TF | Cell Type | Tissue | Disease Stage | Target Gene | RSS | Regulon Activity |
| ∗The dot plots of a searched regulon are shown for all cell subpopulations in each disease state of each tissue based on the regulon specific score inferred using pySCENIC and by calculating the average expression. |
| Page: 1 |
Top |
Somatic mutation of malignant transformation related genes |
| Annotation of somatic variants for genes involved in malignant transformation |
| Hugo Symbol | Variant Class | Variant Classification | dbSNP RS | HGVSc | HGVSp | HGVSp Short | SWISSPROT | BIOTYPE | SIFT | PolyPhen | Tumor Sample Barcode | Tissue | Histology | Sex | Age | Stage | Therapy Types | Drugs | Outcome |
| ZNF3 | SNV | Missense_Mutation | c.116N>G | p.Ala39Gly | p.A39G | P17036 | protein_coding | tolerated(0.06) | benign(0.116) | TCGA-B6-A0IE-01 | Breast | breast invasive carcinoma | Female | <65 | III/IV | Unknown | Unknown | PD | |
| ZNF3 | insertion | In_Frame_Ins | novel | c.1181_1182insTGCTGTTTTGTTTCATGATTTCGTTAATTATGGAAATTT | p.Asn394_Pro395insAlaValLeuPheHisAspPheValAsnTyrGlyAsnPhe | p.N394_P395insAVLFHDFVNYGNF | P17036 | protein_coding | TCGA-A8-A07P-01 | Breast | breast invasive carcinoma | Female | >=65 | I/II | Chemotherapy | 5-fluorouracil | SD | ||
| ZNF3 | insertion | Frame_Shift_Ins | novel | c.275_276insAACTTCAGACC | p.Glu93ThrfsTer48 | p.E93Tfs*48 | P17036 | protein_coding | TCGA-AO-A0JB-01 | Breast | breast invasive carcinoma | Female | <65 | III/IV | Chemotherapy | cyclophosphamide | SD | ||
| ZNF3 | insertion | In_Frame_Ins | novel | c.273_274insGAATGTAGCAAGAGCTTTAAT | p.Asp91_Arg92insGluCysSerLysSerPheAsn | p.D91_R92insECSKSFN | P17036 | protein_coding | TCGA-AO-A0JB-01 | Breast | breast invasive carcinoma | Female | <65 | III/IV | Chemotherapy | cyclophosphamide | SD | ||
| ZNF3 | SNV | Missense_Mutation | c.481G>A | p.Glu161Lys | p.E161K | P17036 | protein_coding | tolerated(0.62) | benign(0.13) | TCGA-EK-A2IP-01 | Cervix | cervical & endocervical cancer | Female | <65 | I/II | Unknown | Unknown | SD | |
| ZNF3 | SNV | Missense_Mutation | rs199648870 | c.632N>A | p.Arg211Gln | p.R211Q | P17036 | protein_coding | tolerated(0.92) | benign(0.109) | TCGA-AA-3510-01 | Colorectum | colon adenocarcinoma | Male | >=65 | I/II | Unknown | Unknown | SD |
| ZNF3 | SNV | Missense_Mutation | novel | c.496C>T | p.Pro166Ser | p.P166S | P17036 | protein_coding | tolerated(0.2) | benign(0.081) | TCGA-AA-3877-01 | Colorectum | colon adenocarcinoma | Female | >=65 | I/II | Unknown | Unknown | SD |
| ZNF3 | SNV | Missense_Mutation | c.1247G>T | p.Arg416Ile | p.R416I | P17036 | protein_coding | deleterious(0) | benign(0.31) | TCGA-AA-3977-01 | Colorectum | colon adenocarcinoma | Male | >=65 | I/II | Unknown | Unknown | SD | |
| ZNF3 | SNV | Missense_Mutation | novel | c.180C>A | p.Phe60Leu | p.F60L | P17036 | protein_coding | tolerated(0.43) | benign(0.019) | TCGA-CA-6717-01 | Colorectum | colon adenocarcinoma | Male | <65 | I/II | Chemotherapy | oxaliplatin | CR |
| ZNF3 | SNV | Missense_Mutation | novel | c.1237C>T | p.Arg413Cys | p.R413C | P17036 | protein_coding | deleterious(0) | probably_damaging(0.927) | TCGA-F4-6570-01 | Colorectum | colon adenocarcinoma | Female | >=65 | I/II | Unknown | Unknown | SD |
| Page: 1 2 3 4 5 6 |
Top |
Related drugs of malignant transformation related genes |
| Identification of chemicals and drugs interact with genes involved in malignant transfromation |
| (DGIdb 4.0) |
| Entrez ID | Symbol | Category | Interaction Types | Drug Claim Name | Drug Name | PMIDs |
| Page: 1 |

Copyright 2023-Present -The University of Texas Health Science Center at Houston |