Schematic overview of the cellular and molecular mechanisms involved in the cancer progression, including the proposed cellular and molecular mechanisms in cancer cells trajectory. AT1: alveolar type 1 cells; AT2: alveolar type 2 cells; AAH: atypical adenomatous hyperplasia; AIS: adenocarcinoma in situ; MIA: minimally invasive adenocarcinoma; IA: invasive adenocarcinoma; EMT: epithelial-mesenchymal transition

Home

Download

Statistics

Help

Contact

Center for Computational Systems Medicine
leaf

Gene summary

leaf

Malignant transformation analysis

leaf

Malignant transformation related pathway analysis

leaf

Cell-cell communication analysis

leaf

Single-cell gene regulatory network inference analysis

leaf

Somatic mutation of malignant transformation related genes

leaf

Related drugs of malignant transformation related genes

Gene: YTHDC1

Gene summary for YTHDC1

check button Gene summary.

Gene informationSpeciesHuman
Gene symbol

YTHDC1

Gene ID

91746

Gene nameYTH domain containing 1
Gene AliasYT521
Cytomap4q13.2
Gene Typeprotein-coding
GO ID

GO:0000003

UniProtAcc

Q96MU7


Top

Malignant transformation analysis

check button Identification of the aberrant gene expression in precancerous and cancerous lesions by comparing the gene expression of stem-like cells in diseased tissues with normal stem cells
check button Malignant transformation involving gene list.
Entrez IDSymbolReplicatesSpeciesOrganTissueAdj P-valueLog2FCMalignancy
91746YTHDC1LZE4THumanEsophagusESCC1.17e-236.48e-010.0811
91746YTHDC1LZE7THumanEsophagusESCC9.51e-077.92e-010.0667
91746YTHDC1LZE8THumanEsophagusESCC1.52e-123.57e-010.067
91746YTHDC1LZE20THumanEsophagusESCC5.53e-065.02e-010.0662
91746YTHDC1LZE24THumanEsophagusESCC1.74e-145.77e-010.0596
91746YTHDC1LZE21THumanEsophagusESCC1.38e-057.44e-010.0655
91746YTHDC1LZE6THumanEsophagusESCC5.29e-101.41e-010.0845
91746YTHDC1P1T-EHumanEsophagusESCC1.68e-179.90e-010.0875
91746YTHDC1P2T-EHumanEsophagusESCC1.05e-519.08e-010.1177
91746YTHDC1P4T-EHumanEsophagusESCC1.20e-288.49e-010.1323
91746YTHDC1P5T-EHumanEsophagusESCC1.18e-214.85e-010.1327
91746YTHDC1P8T-EHumanEsophagusESCC3.82e-447.93e-010.0889
91746YTHDC1P9T-EHumanEsophagusESCC4.11e-145.30e-010.1131
91746YTHDC1P10T-EHumanEsophagusESCC2.53e-398.01e-010.116
91746YTHDC1P11T-EHumanEsophagusESCC2.08e-128.46e-010.1426
91746YTHDC1P12T-EHumanEsophagusESCC5.35e-407.66e-010.1122
91746YTHDC1P15T-EHumanEsophagusESCC2.21e-318.24e-010.1149
91746YTHDC1P16T-EHumanEsophagusESCC1.66e-407.08e-010.1153
91746YTHDC1P17T-EHumanEsophagusESCC3.48e-096.15e-010.1278
91746YTHDC1P19T-EHumanEsophagusESCC4.16e-076.50e-010.1662
Page: 1 2 3 4 5 6 7 8 

check button Transcriptomic changes along malignancy continuum.
TissueExpression DynamicsAbbreviation
EsophagusThe image shows the transcriptomic changes along malignancy continuum.log2FC in expression of this searched gene in stem-like cells from each diseased tissue sample relative to stem-like cells in normal samples in each tissue plotted against the malignancy continuum. Samples are colored based on if they are from different disease stage.ESCC: Esophageal squamous cell carcinoma
HGIN: High-grade intraepithelial neoplasias
LGIN: Low-grade intraepithelial neoplasias
LiverThe image shows the transcriptomic changes along malignancy continuum.log2FC in expression of this searched gene in stem-like cells from each diseased tissue sample relative to stem-like cells in normal samples in each tissue plotted against the malignancy continuum. Samples are colored based on if they are from different disease stage.
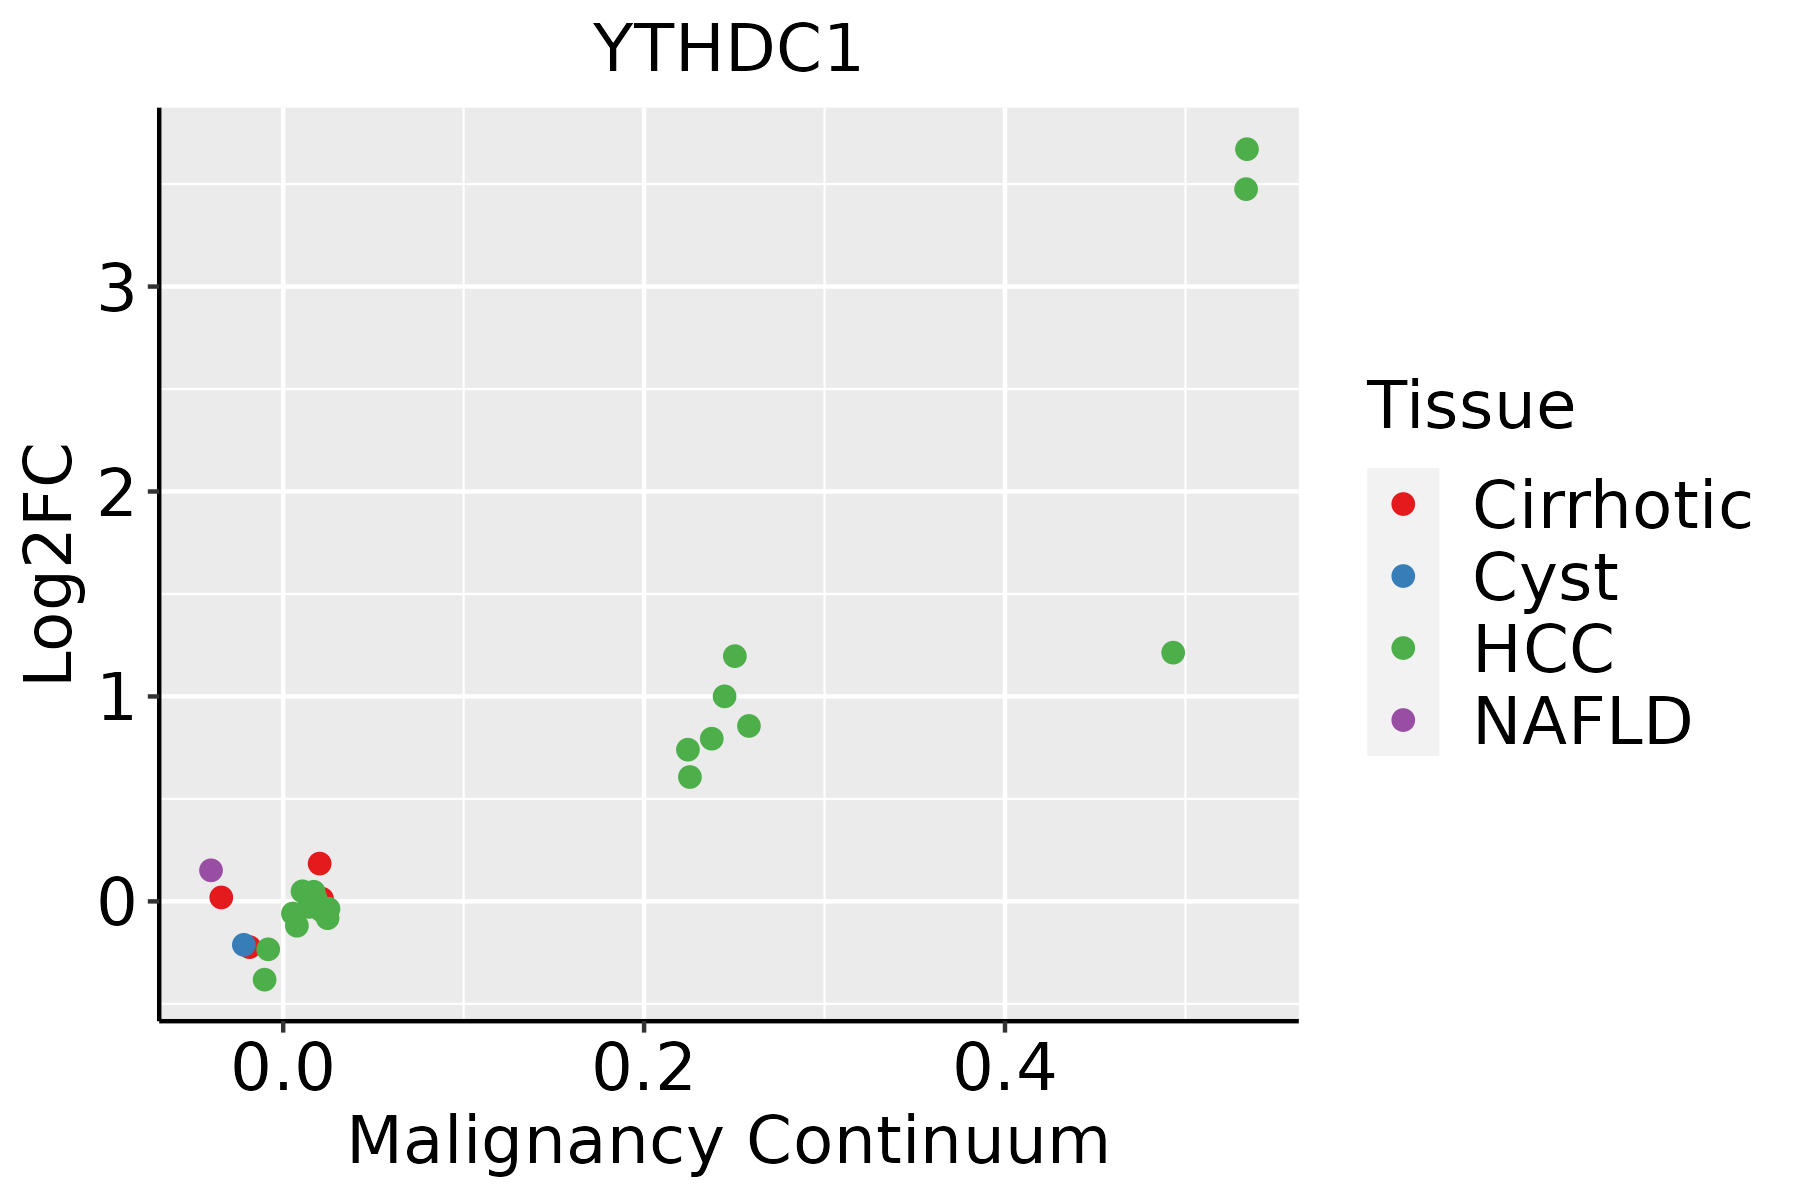
HCC: Hepatocellular carcinoma
NAFLD: Non-alcoholic fatty liver disease
LungThe image shows the transcriptomic changes along malignancy continuum.log2FC in expression of this searched gene in stem-like cells from each diseased tissue sample relative to stem-like cells in normal samples in each tissue plotted against the malignancy continuum. Samples are colored based on if they are from different disease stage.
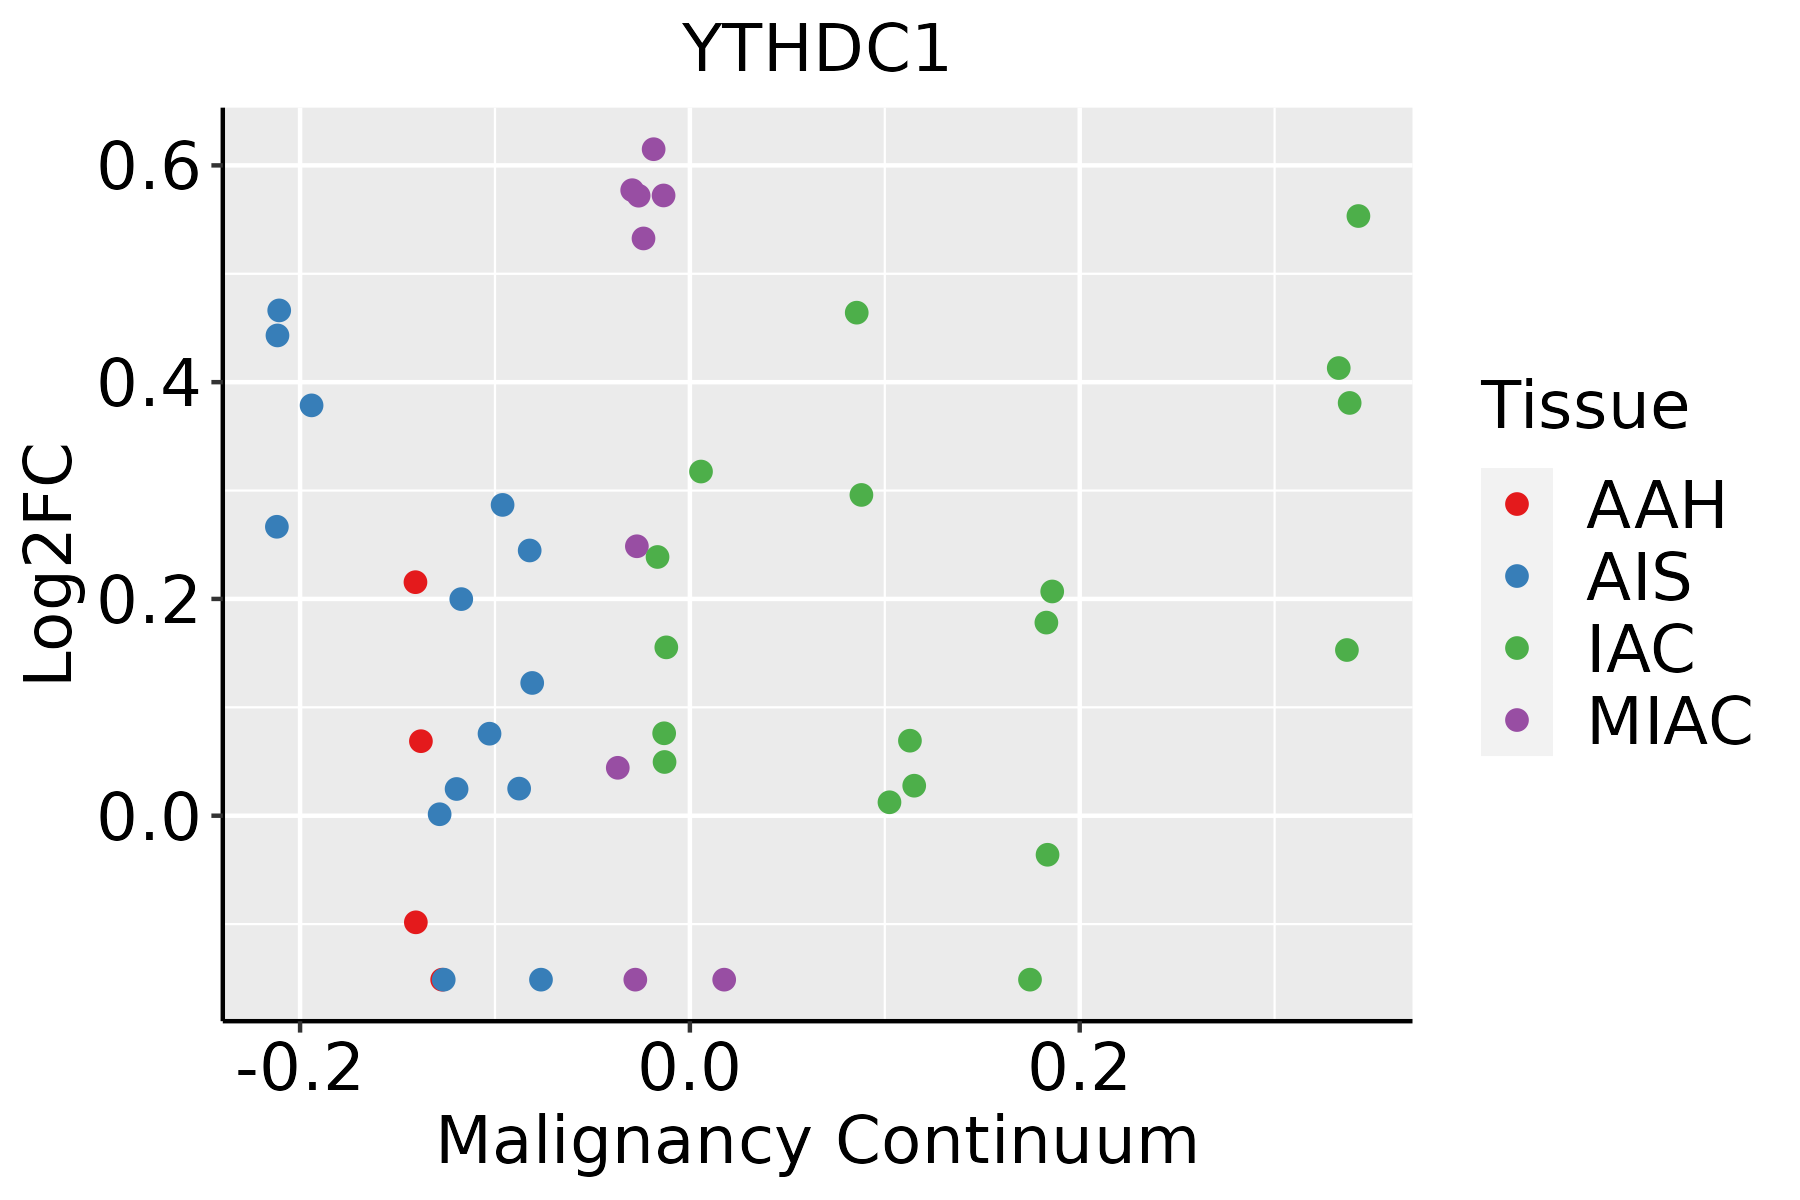
AAH: Atypical adenomatous hyperplasia
AIS: Adenocarcinoma in situ
IAC: Invasive lung adenocarcinoma
MIA: Minimally invasive adenocarcinoma
Oral CavityThe image shows the transcriptomic changes along malignancy continuum.log2FC in expression of this searched gene in stem-like cells from each diseased tissue sample relative to stem-like cells in normal samples in each tissue plotted against the malignancy continuum. Samples are colored based on if they are from different disease stage.EOLP: Erosive Oral lichen planus
LP: leukoplakia
NEOLP: Non-erosive oral lichen planus
OSCC: Oral squamous cell carcinoma
ProstateThe image shows the transcriptomic changes along malignancy continuum.log2FC in expression of this searched gene in stem-like cells from each diseased tissue sample relative to stem-like cells in normal samples in each tissue plotted against the malignancy continuum. Samples are colored based on if they are from different disease stage.
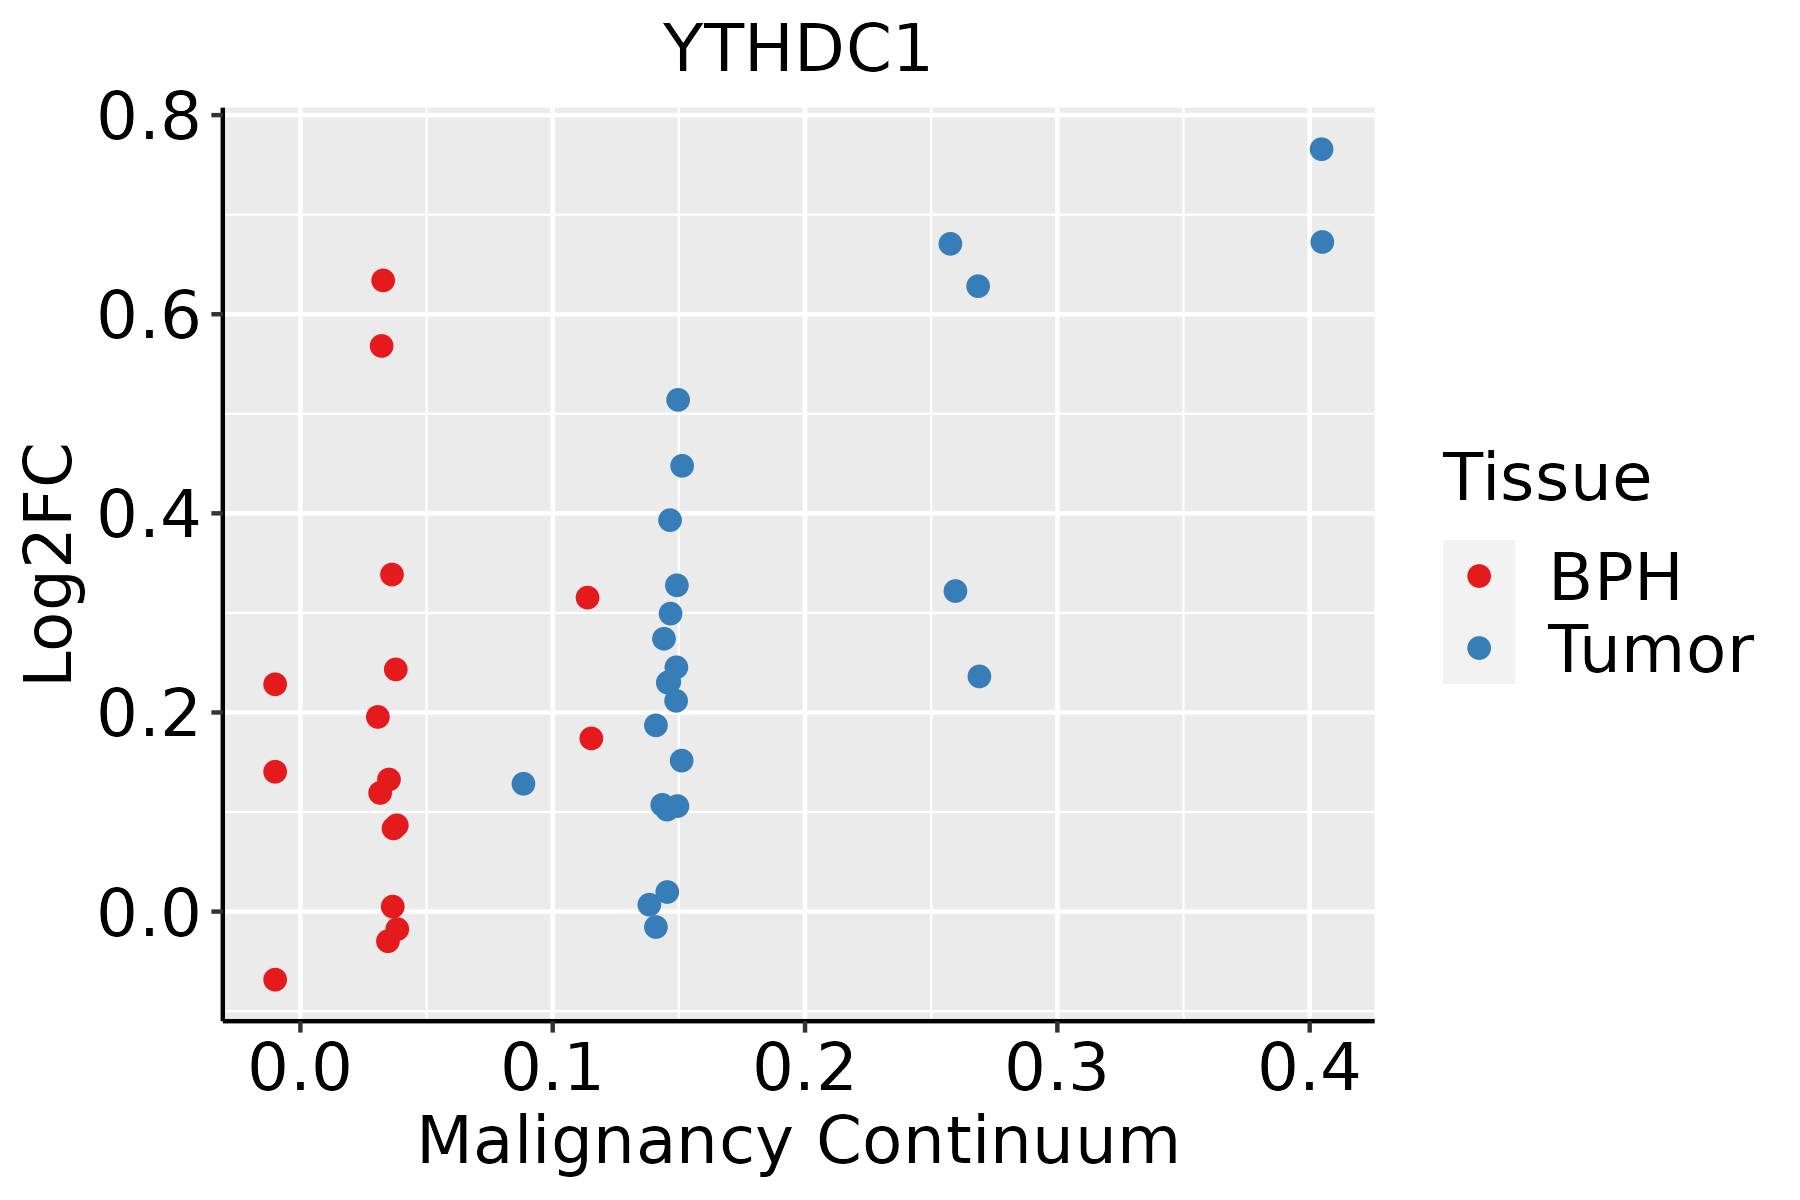
BPH: Benign Prostatic Hyperplasia
SkinThe image shows the transcriptomic changes along malignancy continuum.log2FC in expression of this searched gene in stem-like cells from each diseased tissue sample relative to stem-like cells in normal samples in each tissue plotted against the malignancy continuum. Samples are colored based on if they are from different disease stage.AK: Actinic keratosis
cSCC: Cutaneous squamous cell carcinoma
SCCIS:squamous cell carcinoma in situ
ThyroidThe image shows the transcriptomic changes along malignancy continuum.log2FC in expression of this searched gene in stem-like cells from each diseased tissue sample relative to stem-like cells in normal samples in each tissue plotted against the malignancy continuum. Samples are colored based on if they are from different disease stage.
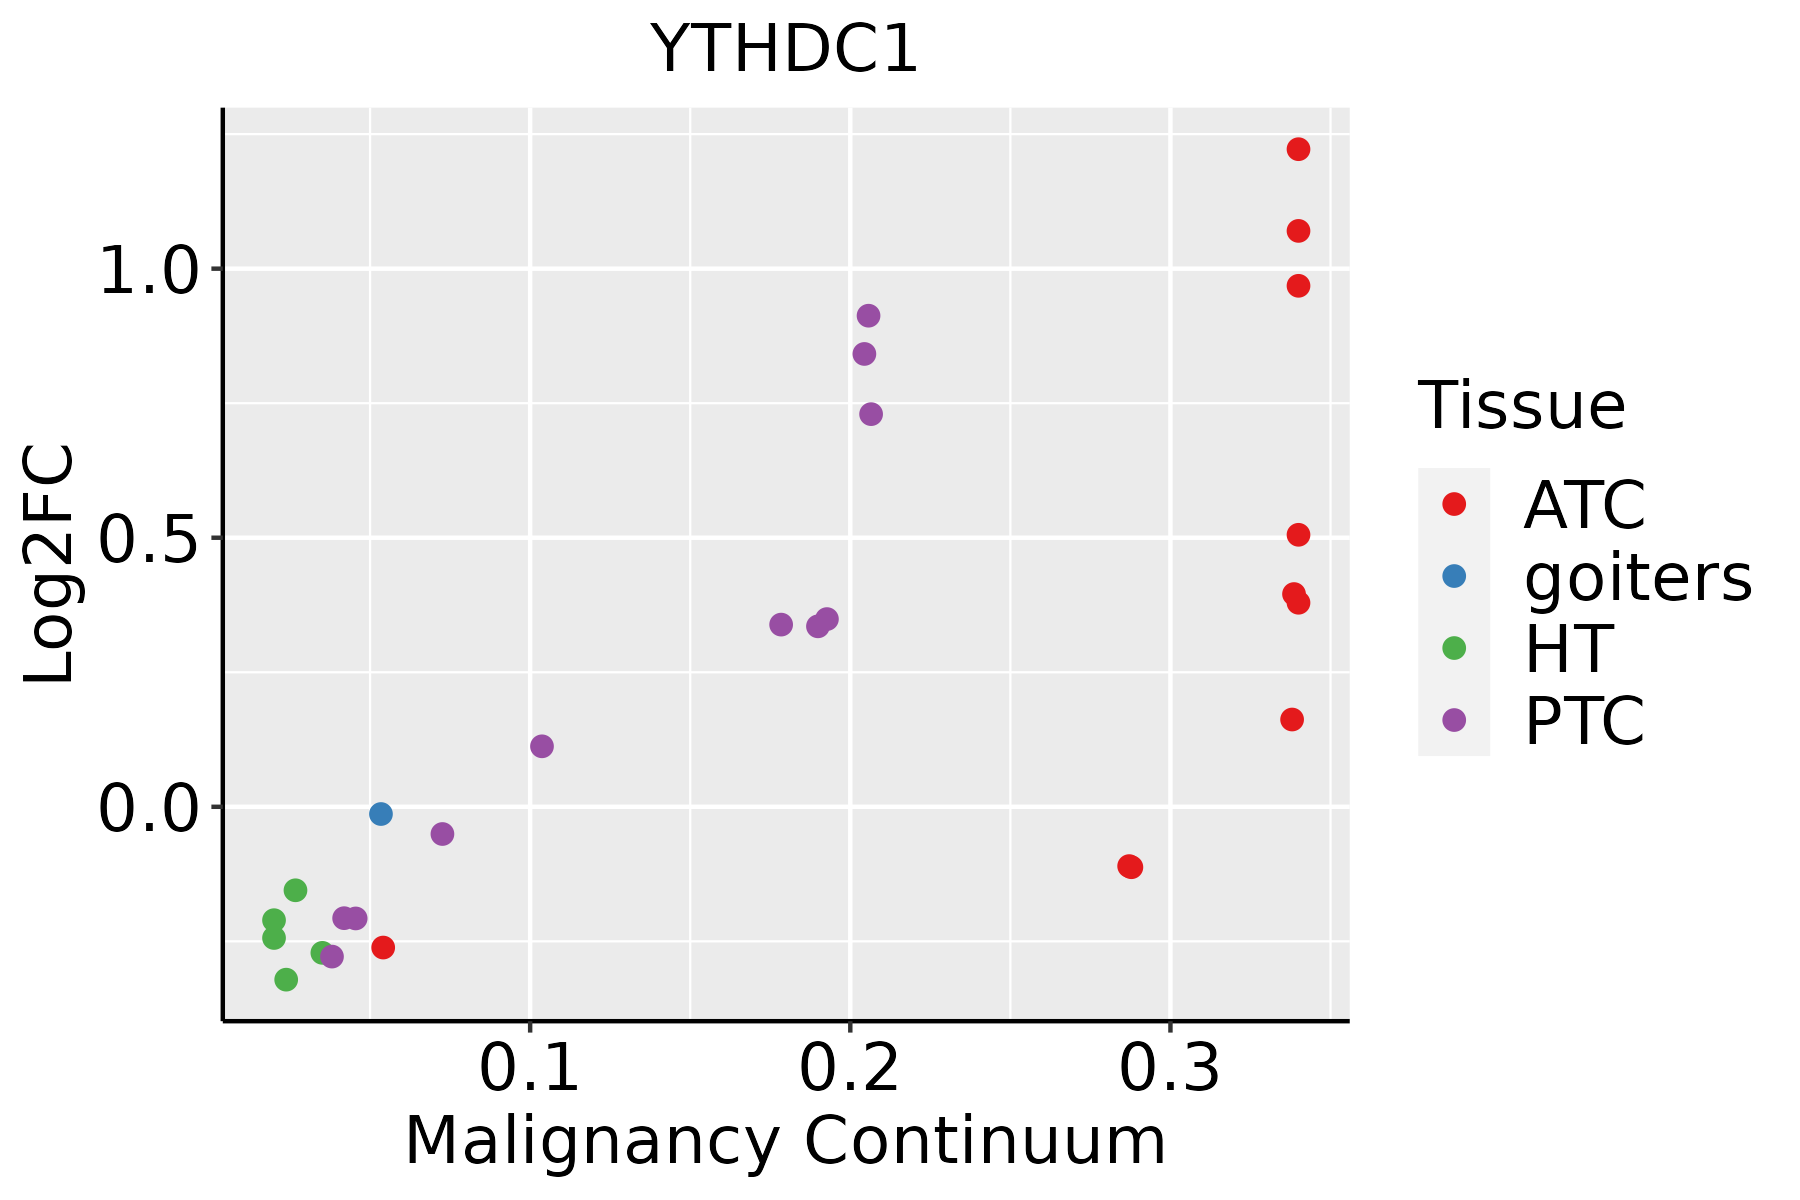
ATC: Anaplastic thyroid cancer
HT: Hashimoto's thyroiditis
PTC: Papillary thyroid cancer
∗log2FC in expression of this searched gene in stem-like cells from each diseased tissue sample relative to stem-like cells in normal samples in each tissue plotted against the malignancy continuum. Samples are colored based on if they are from different disease stage.

Top

Malignant transformation related pathway analysis

check buttonFind out the enriched GO biological processes and KEGG pathways involved in transition from healthy to precancer to cancer
check button Figure of enriched GO biological processes.
TissueDisease StageEnriched GO biological Processes
ColorectumADGO analysis - Figure of enriched GO biological processes: Top 15 enriched GO BP terms are showed in the bar plot of each disease state in each tissue. Each row represents a significant GO biological process which is colored according to the -log10(p.adjust).
ColorectumSERGO analysis - Figure of enriched GO biological processes: Top 15 enriched GO BP terms are showed in the bar plot of each disease state in each tissue. Each row represents a significant GO biological process which is colored according to the -log10(p.adjust).
ColorectumMSSGO analysis - Figure of enriched GO biological processes: Top 15 enriched GO BP terms are showed in the bar plot of each disease state in each tissue. Each row represents a significant GO biological process which is colored according to the -log10(p.adjust).
ColorectumMSI-HGO analysis - Figure of enriched GO biological processes: Top 15 enriched GO BP terms are showed in the bar plot of each disease state in each tissue. Each row represents a significant GO biological process which is colored according to the -log10(p.adjust).
ColorectumFAPGO analysis - Figure of enriched GO biological processes: Top 15 enriched GO BP terms are showed in the bar plot of each disease state in each tissue. Each row represents a significant GO biological process which is colored according to the -log10(p.adjust).
∗Top 15 enriched GO BP terms are showed in the bar plot of each disease state in each tissue. Each row represents a significant GO biological process which is colored according to the -log10(p.adjust).
Page: 1 2 3 4 5 6 7 8 9 

check button Enriched GO biological processes.
GO IDTissueDisease StageDescriptionGene RatioBg Ratiopvaluep.adjustCount
GO:000838033Oral cavityNEOLPRNA splicing110/2005434/187232.29e-182.72e-15110
GO:004802433Oral cavityNEOLPregulation of mRNA splicing, via spliceosome44/2005101/187232.43e-172.06e-1444
GO:000037733Oral cavityNEOLPRNA splicing, via transesterification reactions with bulged adenosine as nucleophile81/2005320/187237.96e-142.63e-1181
GO:000039833Oral cavityNEOLPmRNA splicing, via spliceosome81/2005320/187237.96e-142.63e-1181
GO:000037533Oral cavityNEOLPRNA splicing, via transesterification reactions81/2005324/187231.64e-135.13e-1181
GO:000691331Oral cavityNEOLPnucleocytoplasmic transport75/2005301/187231.56e-123.20e-1075
GO:005116931Oral cavityNEOLPnuclear transport75/2005301/187231.56e-123.20e-1075
GO:007182634Oral cavityNEOLPribonucleoprotein complex subunit organization60/2005227/187231.98e-112.81e-0960
GO:000038031Oral cavityNEOLPalternative mRNA splicing, via spliceosome30/200577/187238.63e-119.32e-0930
GO:002261834Oral cavityNEOLPribonucleoprotein complex assembly57/2005220/187231.46e-101.43e-0857
GO:002261333Oral cavityNEOLPribonucleoprotein complex biogenesis93/2005463/187231.34e-099.49e-0893
GO:000038132Oral cavityNEOLPregulation of alternative mRNA splicing, via spliceosome24/200560/187233.51e-092.04e-0724
GO:000640331Oral cavityNEOLPRNA localization50/2005201/187238.49e-094.39e-0750
GO:000170132Oral cavityNEOLPin utero embryonic development76/2005367/187231.11e-085.44e-0776
GO:005116832Oral cavityNEOLPnuclear export41/2005154/187232.35e-081.03e-0641
GO:005065731Oral cavityNEOLPnucleic acid transport40/2005163/187233.74e-071.15e-0540
GO:005065831Oral cavityNEOLPRNA transport40/2005163/187233.74e-071.15e-0540
GO:005123631Oral cavityNEOLPestablishment of RNA localization40/2005166/187236.24e-071.82e-0540
GO:001593131Oral cavityNEOLPnucleobase-containing compound transport48/2005222/187231.51e-063.77e-0548
GO:005102831Oral cavityNEOLPmRNA transport31/2005130/187231.38e-052.43e-0431
Page: 1 2 3 4 5 6 7 8 9 10 11 12 13 14 15 16 17 18 19 20 21 22 23 24 25 26 

check button Enriched KEGG pathways.
Pathway IDTissueDisease StageDescriptionGene RatioBg Ratiopvaluep.adjustqvalueCount
Page: 1 

Top

Cell-cell communication analysis

check buttonIdentification of potential cell-cell interactions between two cell types and their ligand-receptor pairs for different disease states
LigandReceptorLRpairPathwayTissueDisease Stage
Page: 1 

Top

Single-cell gene regulatory network inference analysis

check buttonFind out the significant the regulons (TFs) and the target genes of each regulon across cell types for different disease states
TFCell TypeTissueDisease StageTarget GeneRSSRegulon Activity
∗The dot plots of a searched regulon are shown for all cell subpopulations in each disease state of each tissue based on the regulon specific score inferred using pySCENIC and by calculating the average expression.
Page: 1 

Top

Somatic mutation of malignant transformation related genes

check buttonAnnotation of somatic variants for genes involved in malignant transformation
Hugo SymbolVariant ClassVariant ClassificationdbSNP RSHGVScHGVSpHGVSp ShortSWISSPROTBIOTYPESIFTPolyPhenTumor Sample BarcodeTissueHistologySexAgeStageTherapy TypesDrugsOutcome
YTHDC1SNVMissense_Mutationnovelc.1038N>Ap.Ser346Argp.S346Rprotein_codingtolerated(0.3)benign(0.157)TCGA-AC-A3QQ-01Breastbreast invasive carcinomaFemale<65I/IIUnknownUnknownSD
YTHDC1SNVMissense_Mutationc.485N>Ap.Arg162Hisp.R162Hprotein_codingtolerated_low_confidence(0.08)benign(0.361)TCGA-AN-A0AK-01Breastbreast invasive carcinomaFemale>=65I/IIUnknownUnknownSD
YTHDC1SNVMissense_Mutationc.937N>Tp.Asp313Tyrp.D313Yprotein_codingdeleterious(0)probably_damaging(0.947)TCGA-AQ-A1H2-01Breastbreast invasive carcinomaFemale>=65III/IVChemotherapyherceptinSD
YTHDC1SNVMissense_Mutationrs766073192c.561N>Gp.Ser187Argp.S187Rprotein_codingdeleterious_low_confidence(0)benign(0.191)TCGA-AQ-A1H3-01Breastbreast invasive carcinomaFemale<65III/IVChemotherapyadriamycinSD
YTHDC1SNVMissense_Mutationc.92A>Gp.Tyr31Cysp.Y31Cprotein_codingtolerated_low_confidence(0.26)probably_damaging(0.996)TCGA-AR-A2LQ-01Breastbreast invasive carcinomaFemale<65I/IIChemotherapydocetaxelSD
YTHDC1SNVMissense_Mutationc.1165N>Ap.Leu389Ilep.L389Iprotein_codingdeleterious(0.05)benign(0.174)TCGA-D8-A1JG-01Breastbreast invasive carcinomaFemale<65I/IIChemotherapydoxorubicinSD
YTHDC1SNVMissense_Mutationrs756562328c.2044N>Tp.Arg682Trpp.R682Wprotein_codingdeleterious_low_confidence(0)possibly_damaging(0.649)TCGA-E2-A1LA-01Breastbreast invasive carcinomaFemale<65I/IIHormone TherapyarimidexSD
YTHDC1SNVMissense_Mutationnovelc.713A>Tp.Glu238Valp.E238Vprotein_codingtolerated_low_confidence(0.08)benign(0.006)TCGA-E9-A243-01Breastbreast invasive carcinomaFemale<65I/IIChemotherapy5-fluorouracilPD
YTHDC1insertionNonsense_Mutationnovelc.260_261insCCAATTCTCTGATGTTTAAAGAp.Lys88GlnfsTer6p.K88Qfs*6protein_codingTCGA-AR-A0U0-01Breastbreast invasive carcinomaFemale>=65I/IIUnknownUnknownSD
YTHDC1SNVMissense_Mutationnovelc.280G>Ap.Glu94Lysp.E94Kprotein_codingdeleterious_low_confidence(0.01)benign(0.051)TCGA-2W-A8YY-01Cervixcervical & endocervical cancerFemale<65I/IIChemotherapycisplatinCR
Page: 1 2 3 4 5 6 7 8 9 10 11 12 

Top

Related drugs of malignant transformation related genes

check buttonIdentification of chemicals and drugs interact with genes involved in malignant transfromation
(DGIdb 4.0)
Entrez IDSymbolCategoryInteraction TypesDrug Claim NameDrug NamePMIDs
Page: 1