
|
|||||
|
 | |
| |
| |
| |
| |
| |
|
Gene: TRA2A |
Gene summary for TRA2A |
| Gene information | Species | Human | Gene symbol | TRA2A | Gene ID | 29896 |
| Gene name | transformer 2 alpha homolog | |
| Gene Alias | AWMS1 | |
| Cytomap | 7p15.3 | |
| Gene Type | protein-coding | GO ID | GO:0000375 | UniProtAcc | Q13595 |
Top |
Malignant transformation analysis |
| Identification of the aberrant gene expression in precancerous and cancerous lesions by comparing the gene expression of stem-like cells in diseased tissues with normal stem cells |
| Entrez ID | Symbol | Replicates | Species | Organ | Tissue | Adj P-value | Log2FC | Malignancy |
| 29896 | TRA2A | CA_HPV_1 | Human | Cervix | CC | 1.02e-06 | 1.24e-01 | 0.0264 |
| 29896 | TRA2A | CCI_1 | Human | Cervix | CC | 6.44e-05 | 1.07e+00 | 0.528 |
| 29896 | TRA2A | CCI_3 | Human | Cervix | CC | 3.85e-05 | 5.84e-01 | 0.516 |
| 29896 | TRA2A | L1 | Human | Cervix | CC | 4.50e-02 | -5.06e-02 | 0.0802 |
| 29896 | TRA2A | HTA11_3410_2000001011 | Human | Colorectum | AD | 3.31e-18 | -6.66e-01 | 0.0155 |
| 29896 | TRA2A | HTA11_2487_2000001011 | Human | Colorectum | SER | 2.22e-08 | -5.82e-01 | -0.1808 |
| 29896 | TRA2A | HTA11_3361_2000001011 | Human | Colorectum | AD | 7.22e-07 | -6.44e-01 | -0.1207 |
| 29896 | TRA2A | HTA11_83_2000001011 | Human | Colorectum | SER | 6.54e-05 | -5.63e-01 | -0.1526 |
| 29896 | TRA2A | HTA11_696_2000001011 | Human | Colorectum | AD | 1.78e-05 | -4.05e-01 | -0.1464 |
| 29896 | TRA2A | HTA11_866_2000001011 | Human | Colorectum | AD | 1.85e-08 | -3.98e-01 | -0.1001 |
| 29896 | TRA2A | HTA11_5212_2000001011 | Human | Colorectum | AD | 1.03e-02 | -7.07e-01 | -0.2061 |
| 29896 | TRA2A | HTA11_99999970781_79442 | Human | Colorectum | MSS | 2.04e-04 | -3.00e-01 | 0.294 |
| 29896 | TRA2A | HTA11_99999971662_82457 | Human | Colorectum | MSS | 2.30e-03 | -3.22e-01 | 0.3859 |
| 29896 | TRA2A | HTA11_99999974143_84620 | Human | Colorectum | MSS | 2.95e-16 | -4.86e-01 | 0.3005 |
| 29896 | TRA2A | A015-C-203 | Human | Colorectum | FAP | 1.76e-28 | -1.31e-01 | -0.1294 |
| 29896 | TRA2A | A015-C-204 | Human | Colorectum | FAP | 2.98e-03 | -7.72e-02 | -0.0228 |
| 29896 | TRA2A | A014-C-040 | Human | Colorectum | FAP | 5.38e-05 | -3.86e-01 | -0.1184 |
| 29896 | TRA2A | A002-C-201 | Human | Colorectum | FAP | 2.84e-11 | -3.31e-02 | 0.0324 |
| 29896 | TRA2A | A002-C-203 | Human | Colorectum | FAP | 3.17e-02 | 1.52e-01 | 0.2786 |
| 29896 | TRA2A | A001-C-119 | Human | Colorectum | FAP | 1.41e-14 | 4.28e-01 | -0.1557 |
| Page: 1 2 3 4 5 6 7 8 9 10 11 12 |
| Tissue | Expression Dynamics | Abbreviation |
| Cervix | 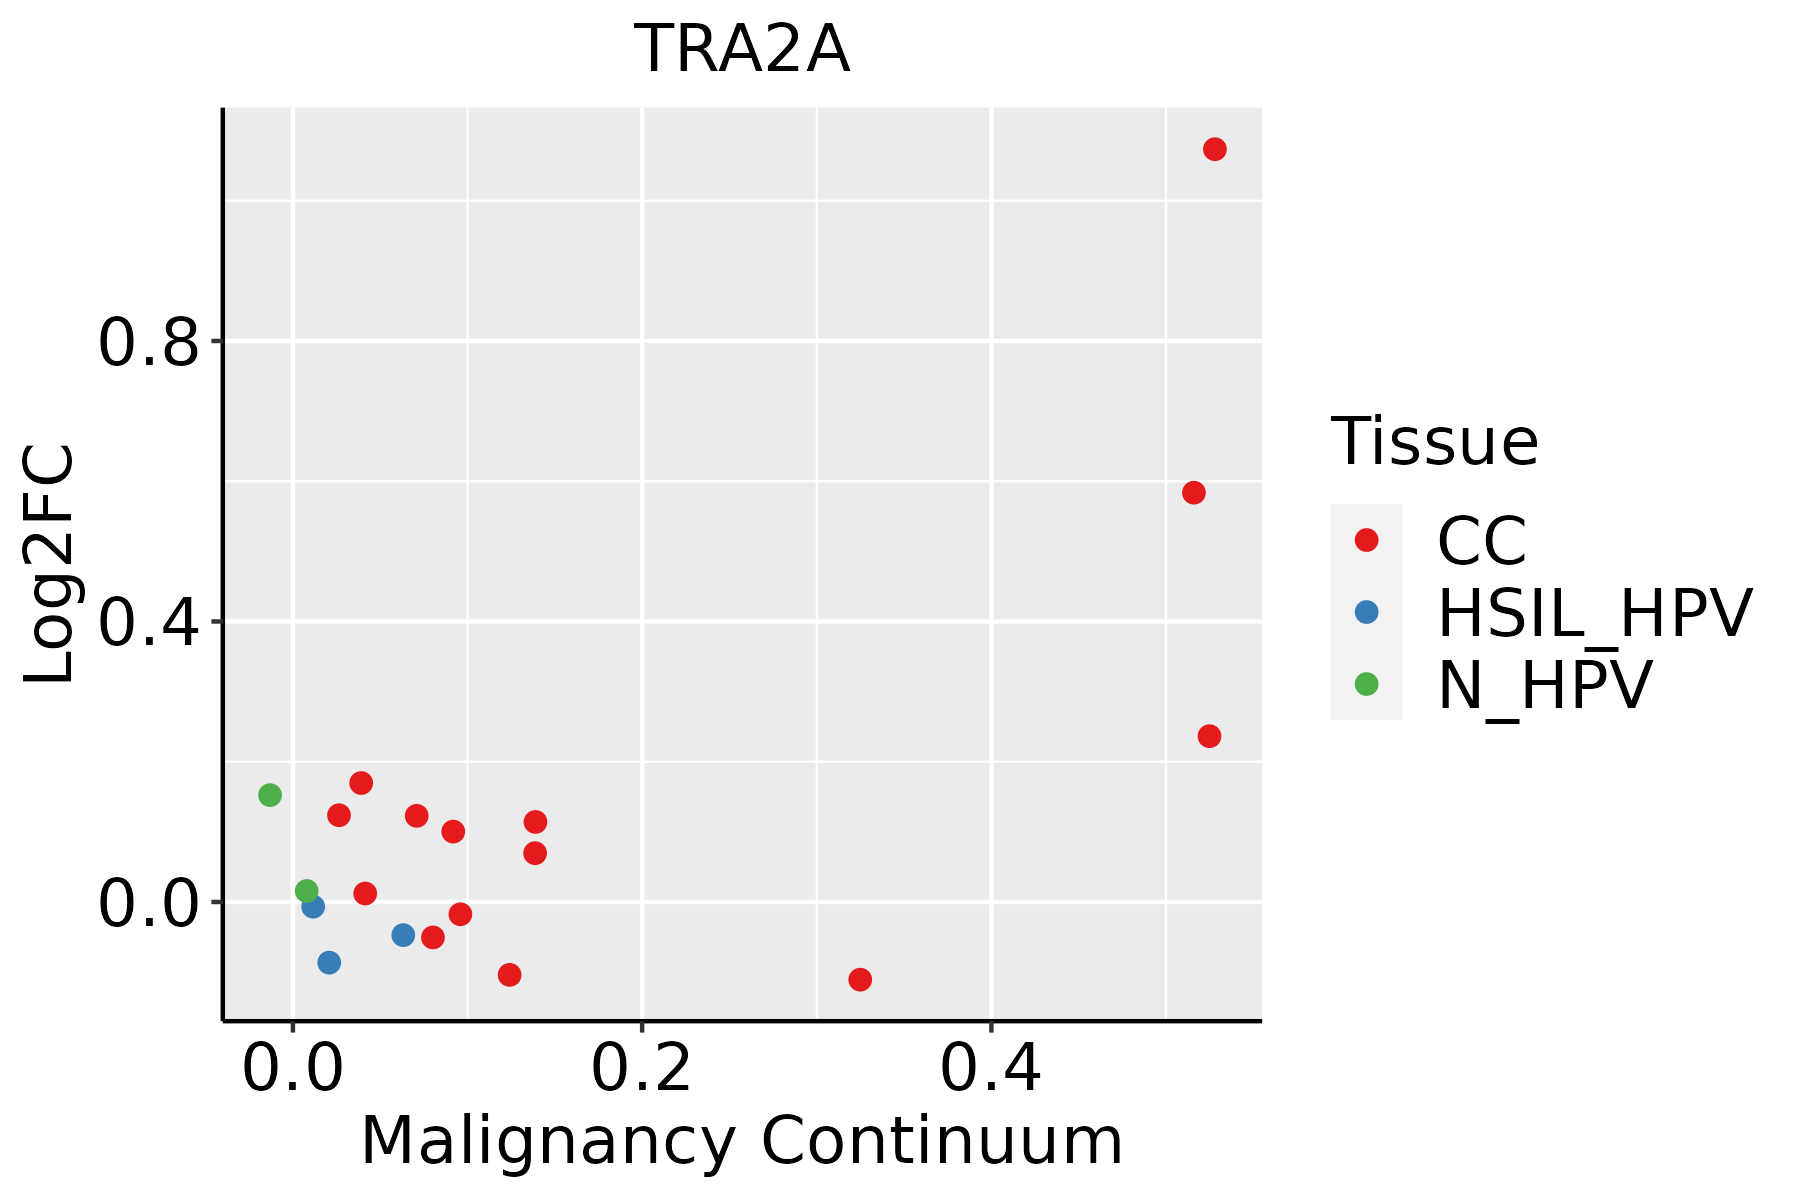 | CC: Cervix cancer |
| HSIL_HPV: HPV-infected high-grade squamous intraepithelial lesions | ||
| N_HPV: HPV-infected normal cervix | ||
| Colorectum (GSE201348) | 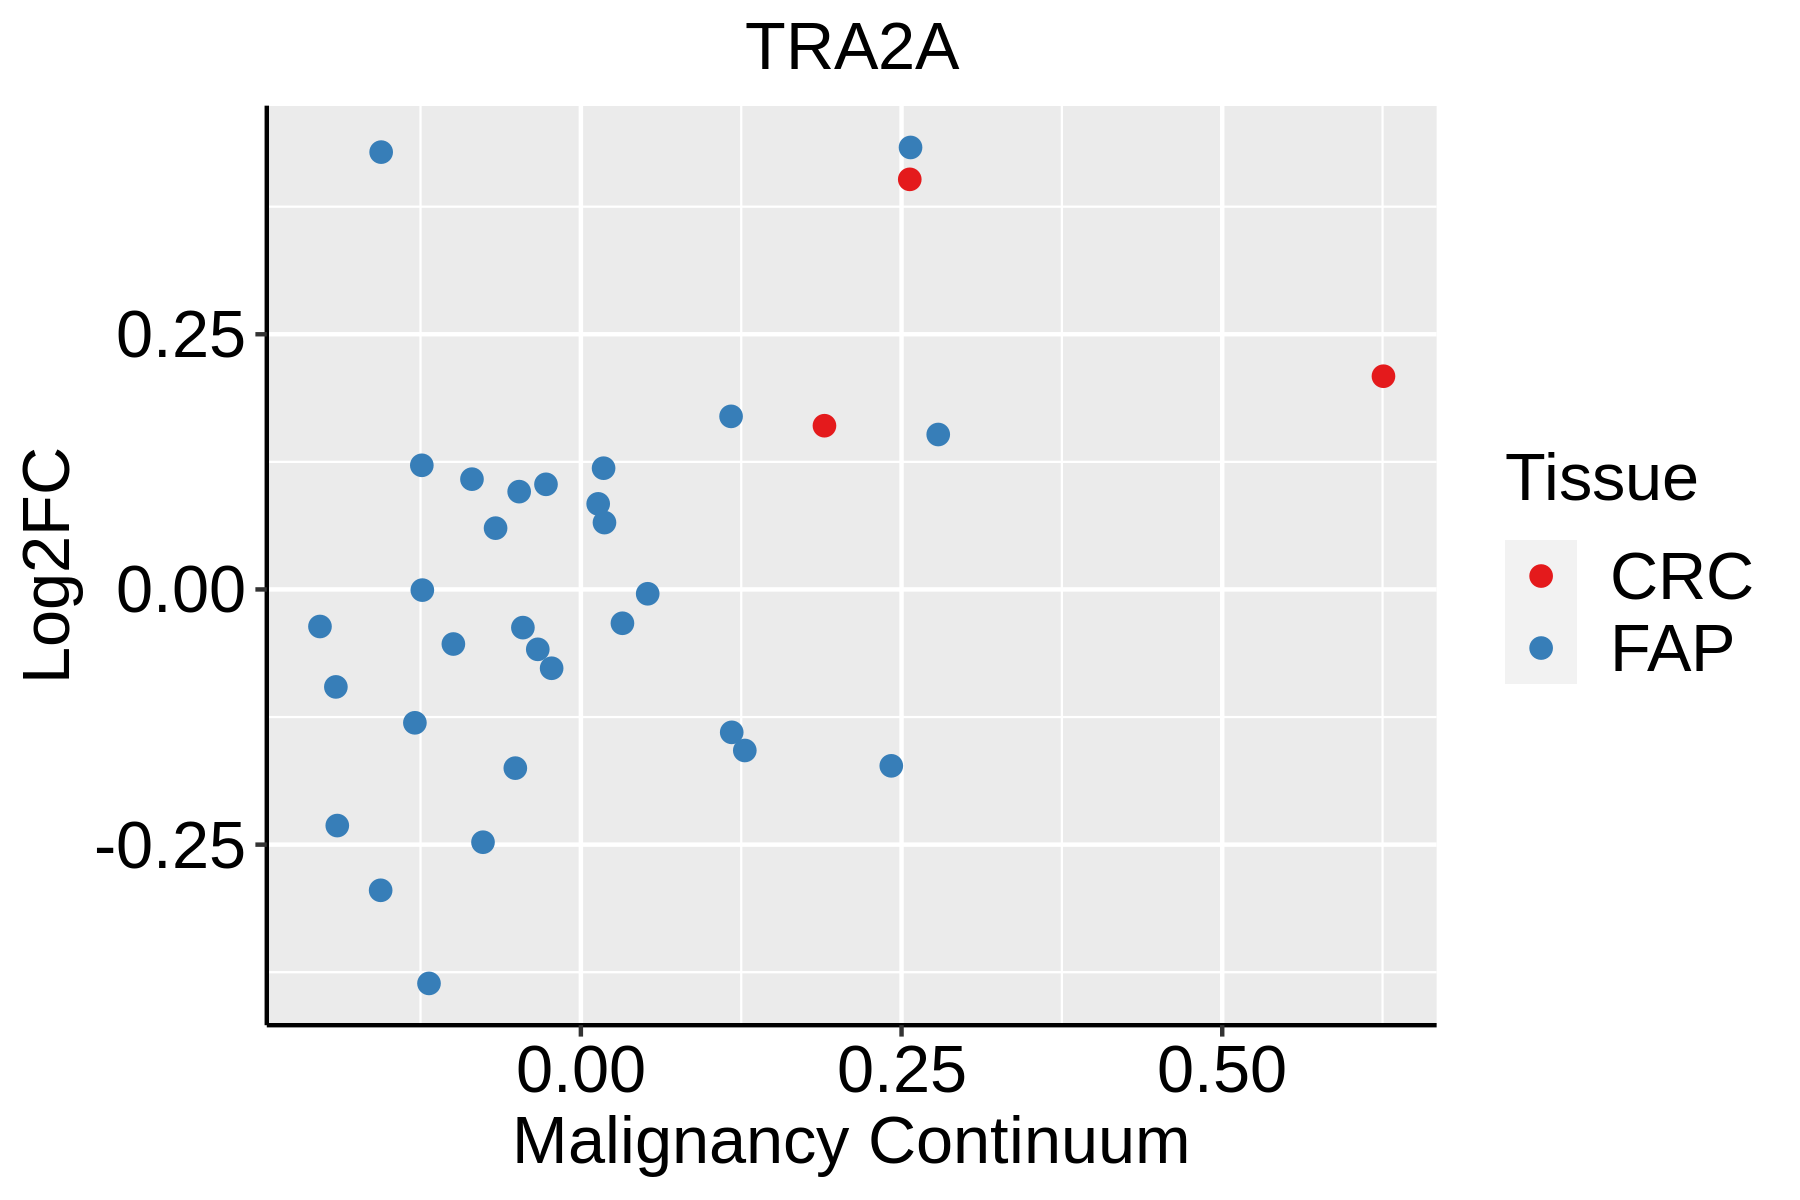 | FAP: Familial adenomatous polyposis |
| CRC: Colorectal cancer | ||
| Colorectum (HTA11) |  | AD: Adenomas |
| SER: Sessile serrated lesions | ||
| MSI-H: Microsatellite-high colorectal cancer | ||
| MSS: Microsatellite stable colorectal cancer | ||
| Endometrium | 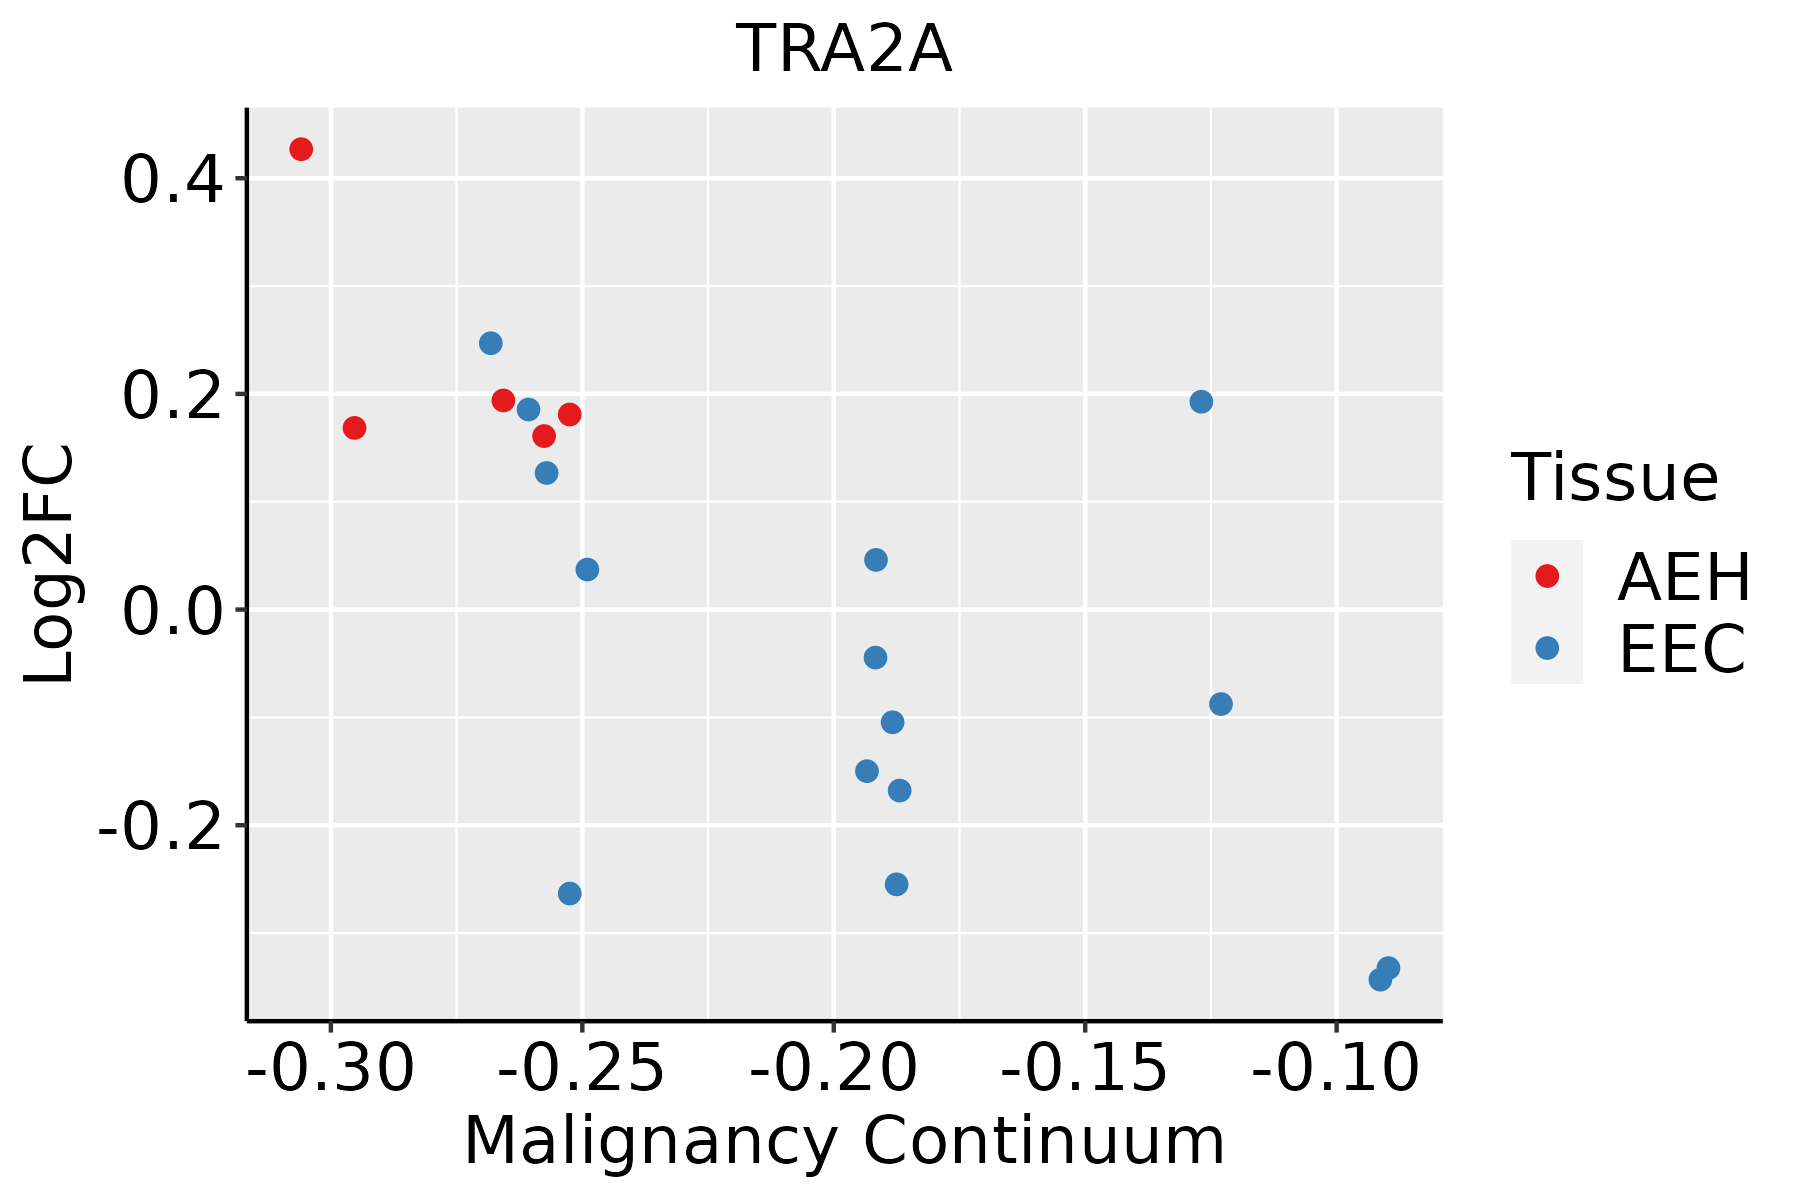 | AEH: Atypical endometrial hyperplasia |
| EEC: Endometrioid Cancer | ||
| Esophagus | 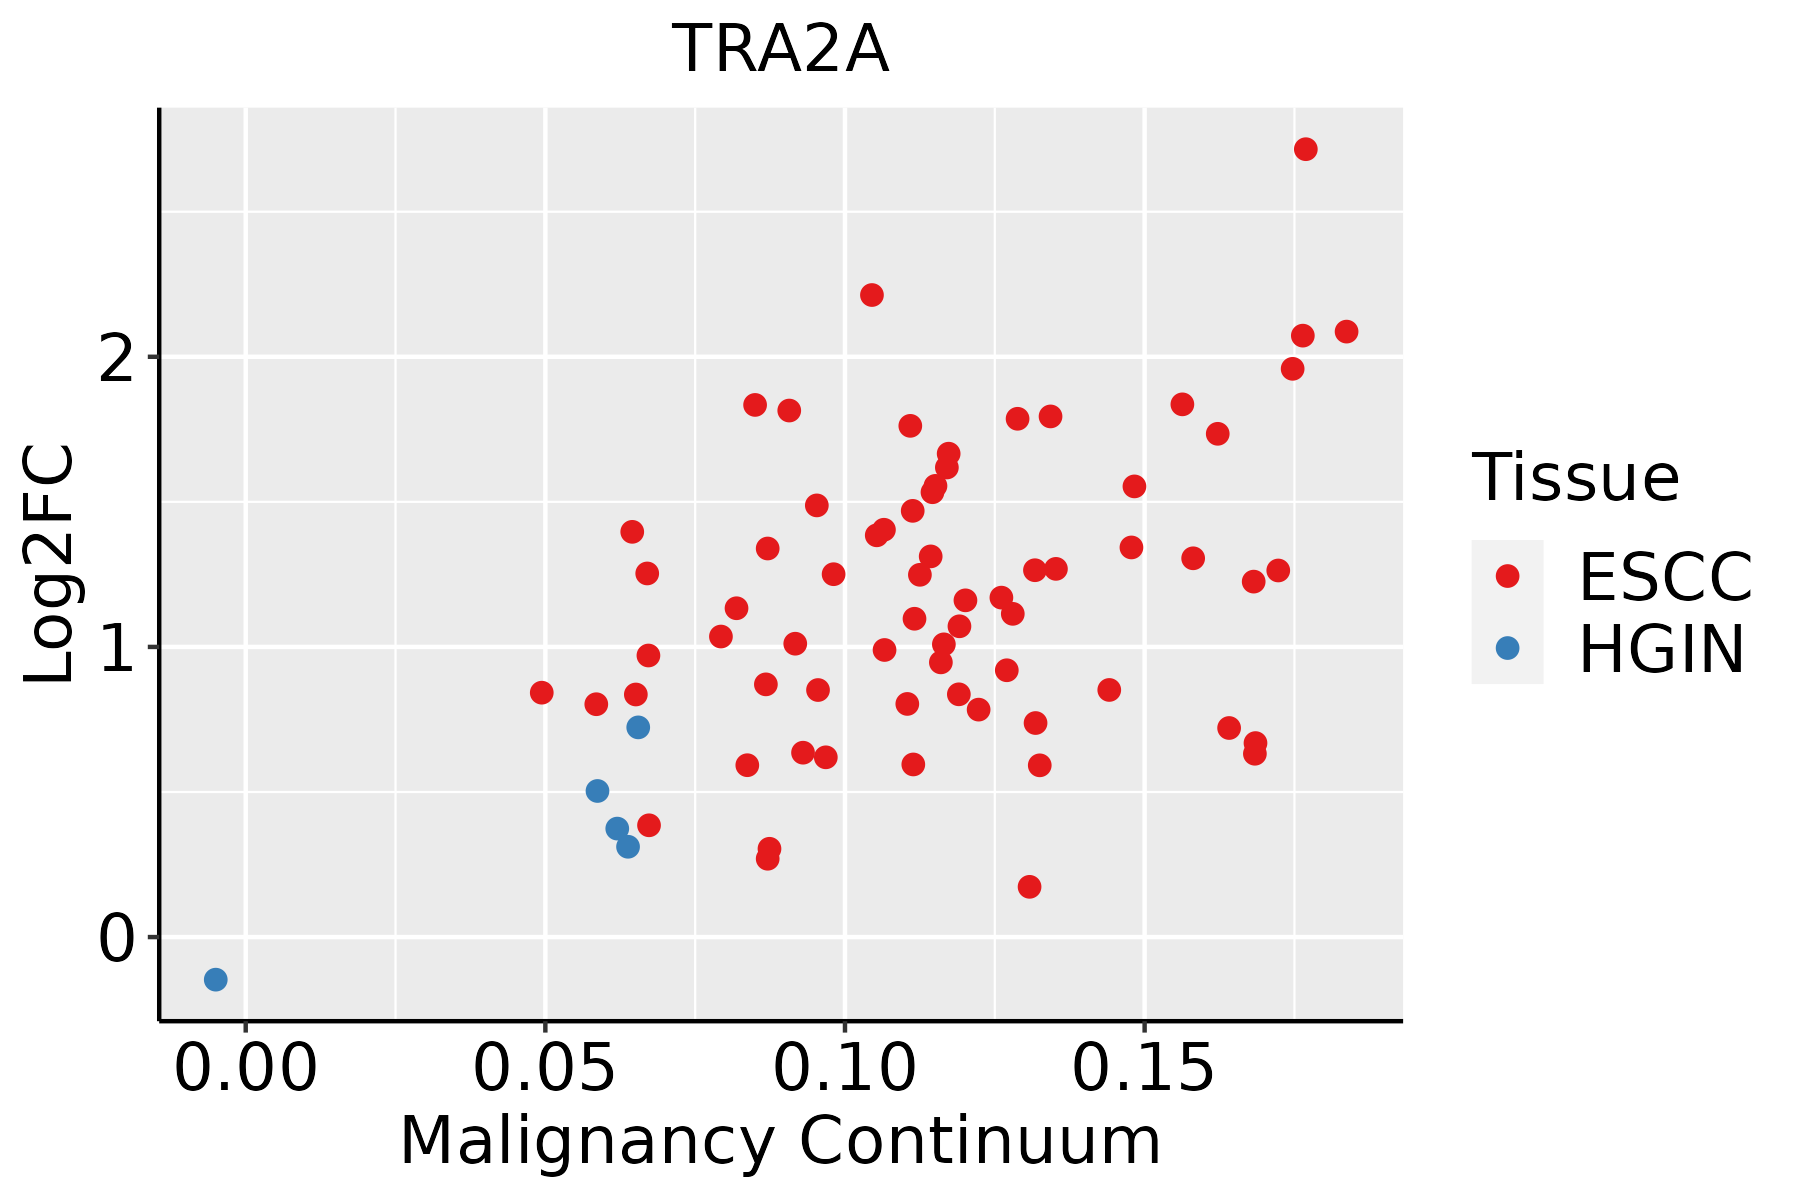 | ESCC: Esophageal squamous cell carcinoma |
| HGIN: High-grade intraepithelial neoplasias | ||
| LGIN: Low-grade intraepithelial neoplasias | ||
| GC |  | CAG: Chronic atrophic gastritis |
| CAG with IM: Chronic atrophic gastritis with intestinal metaplasia | ||
| CSG: Chronic superficial gastritis | ||
| GC: Gastric cancer | ||
| SIM: Severe intestinal metaplasia | ||
| WIM: Wild intestinal metaplasia | ||
| Liver | 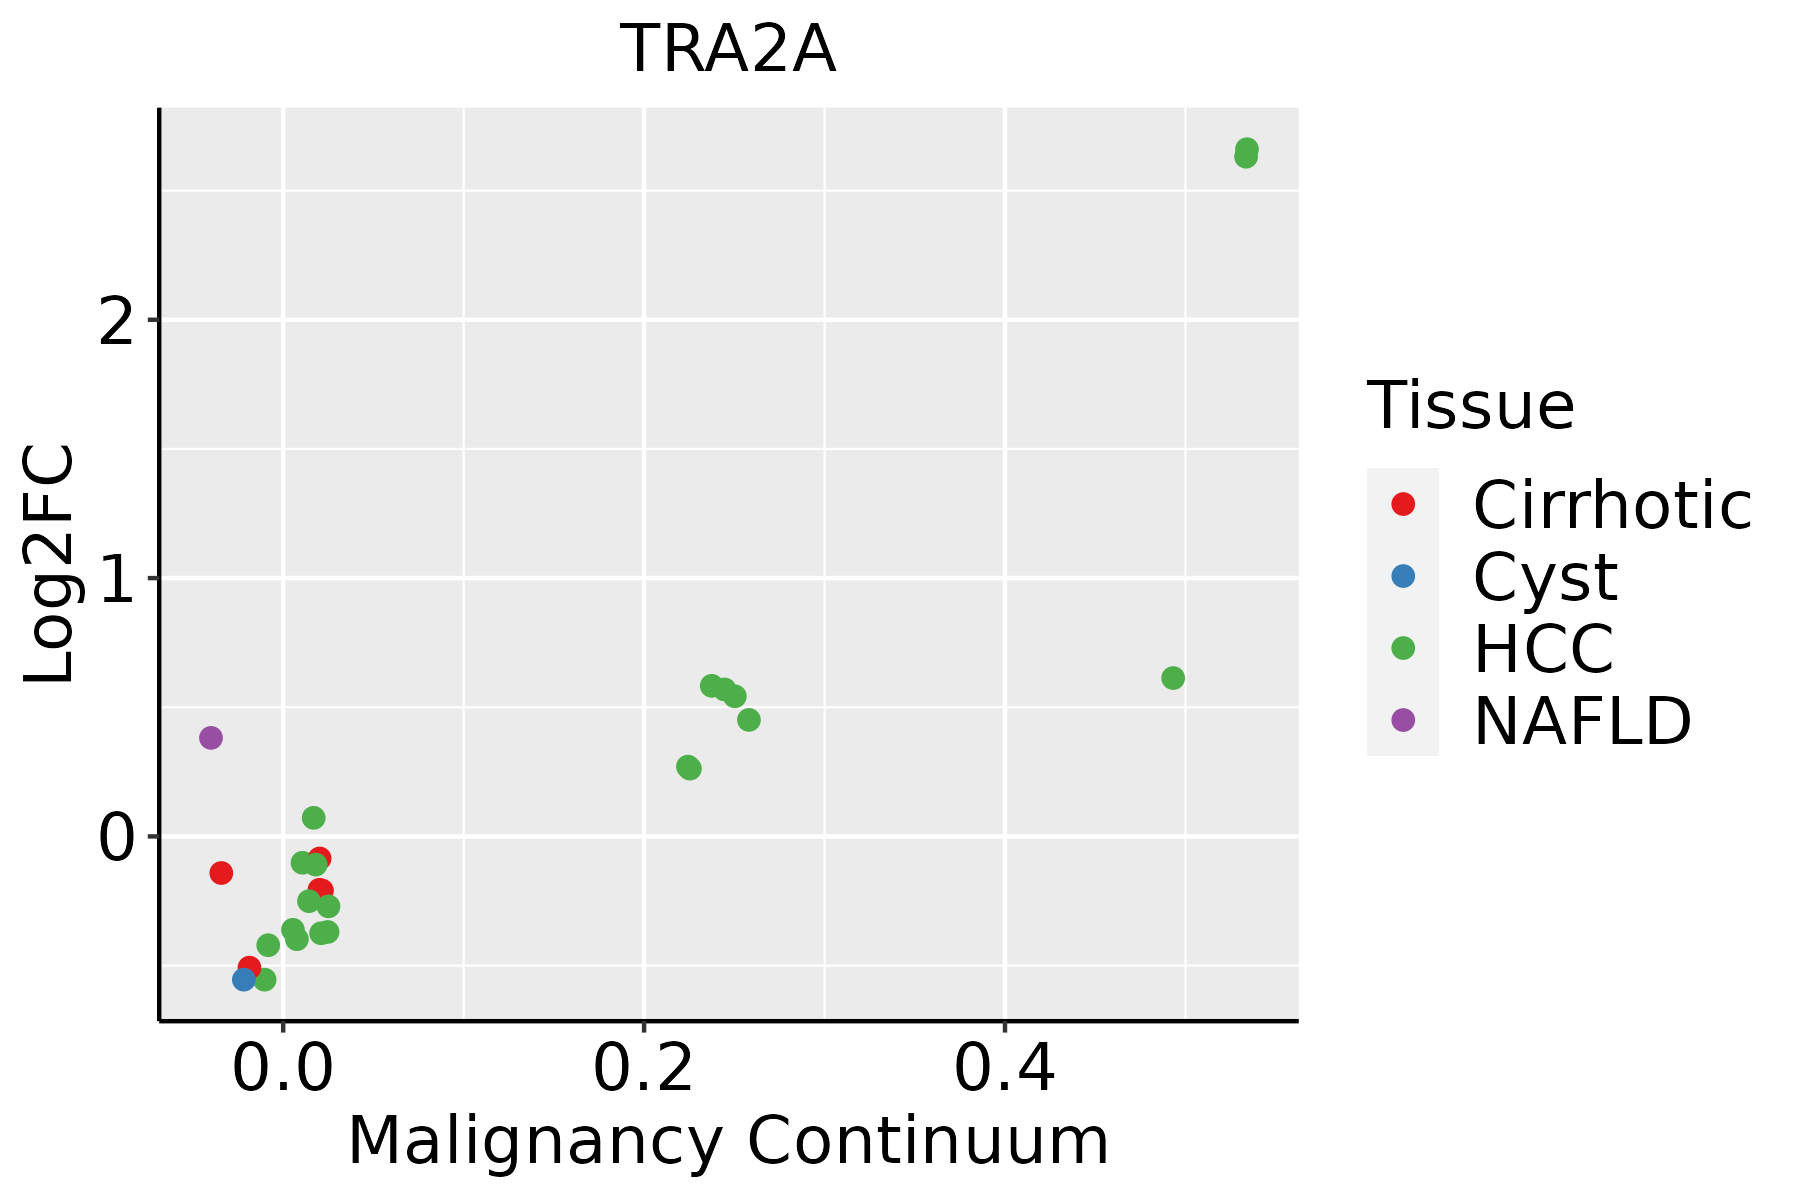 | HCC: Hepatocellular carcinoma |
| NAFLD: Non-alcoholic fatty liver disease | ||
| Lung | 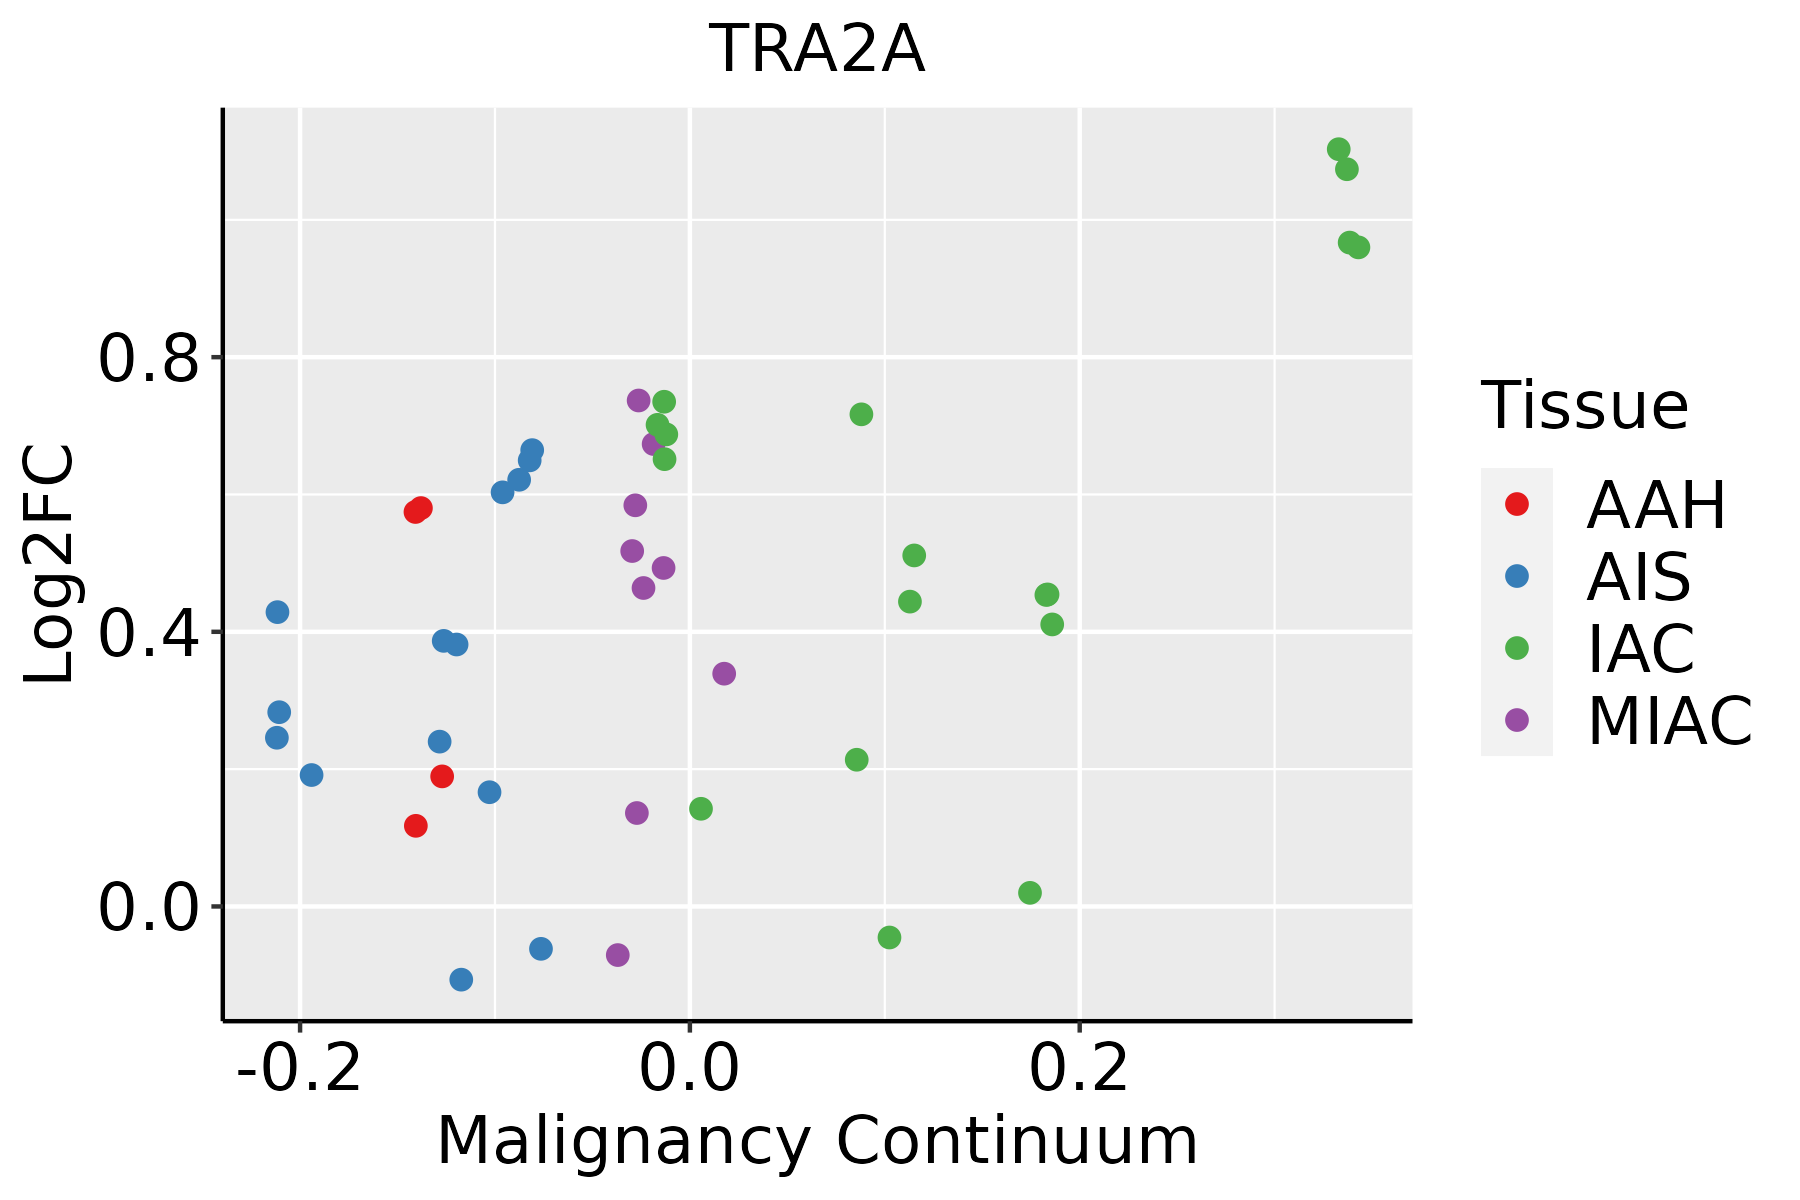 | AAH: Atypical adenomatous hyperplasia |
| AIS: Adenocarcinoma in situ | ||
| IAC: Invasive lung adenocarcinoma | ||
| MIA: Minimally invasive adenocarcinoma | ||
| Oral Cavity | 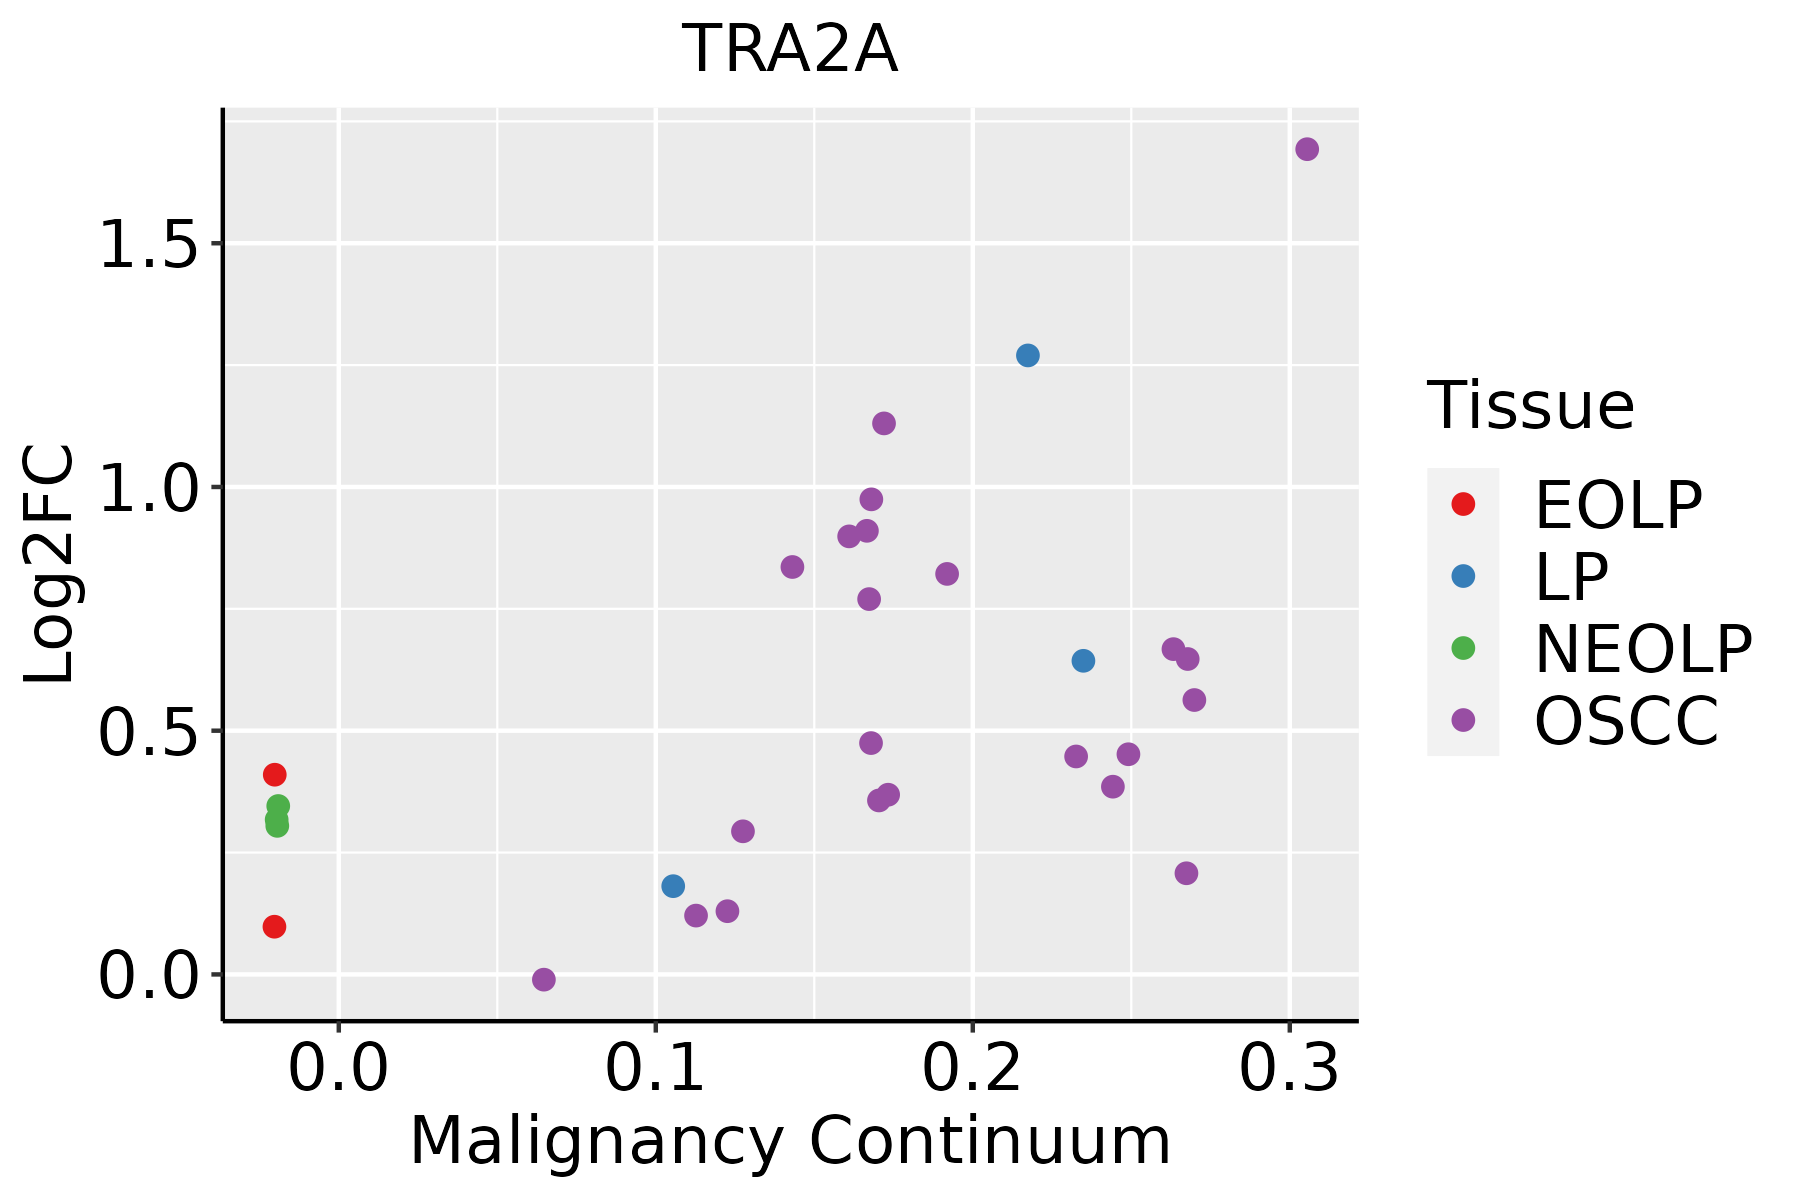 | EOLP: Erosive Oral lichen planus |
| LP: leukoplakia | ||
| NEOLP: Non-erosive oral lichen planus | ||
| OSCC: Oral squamous cell carcinoma | ||
| Prostate | 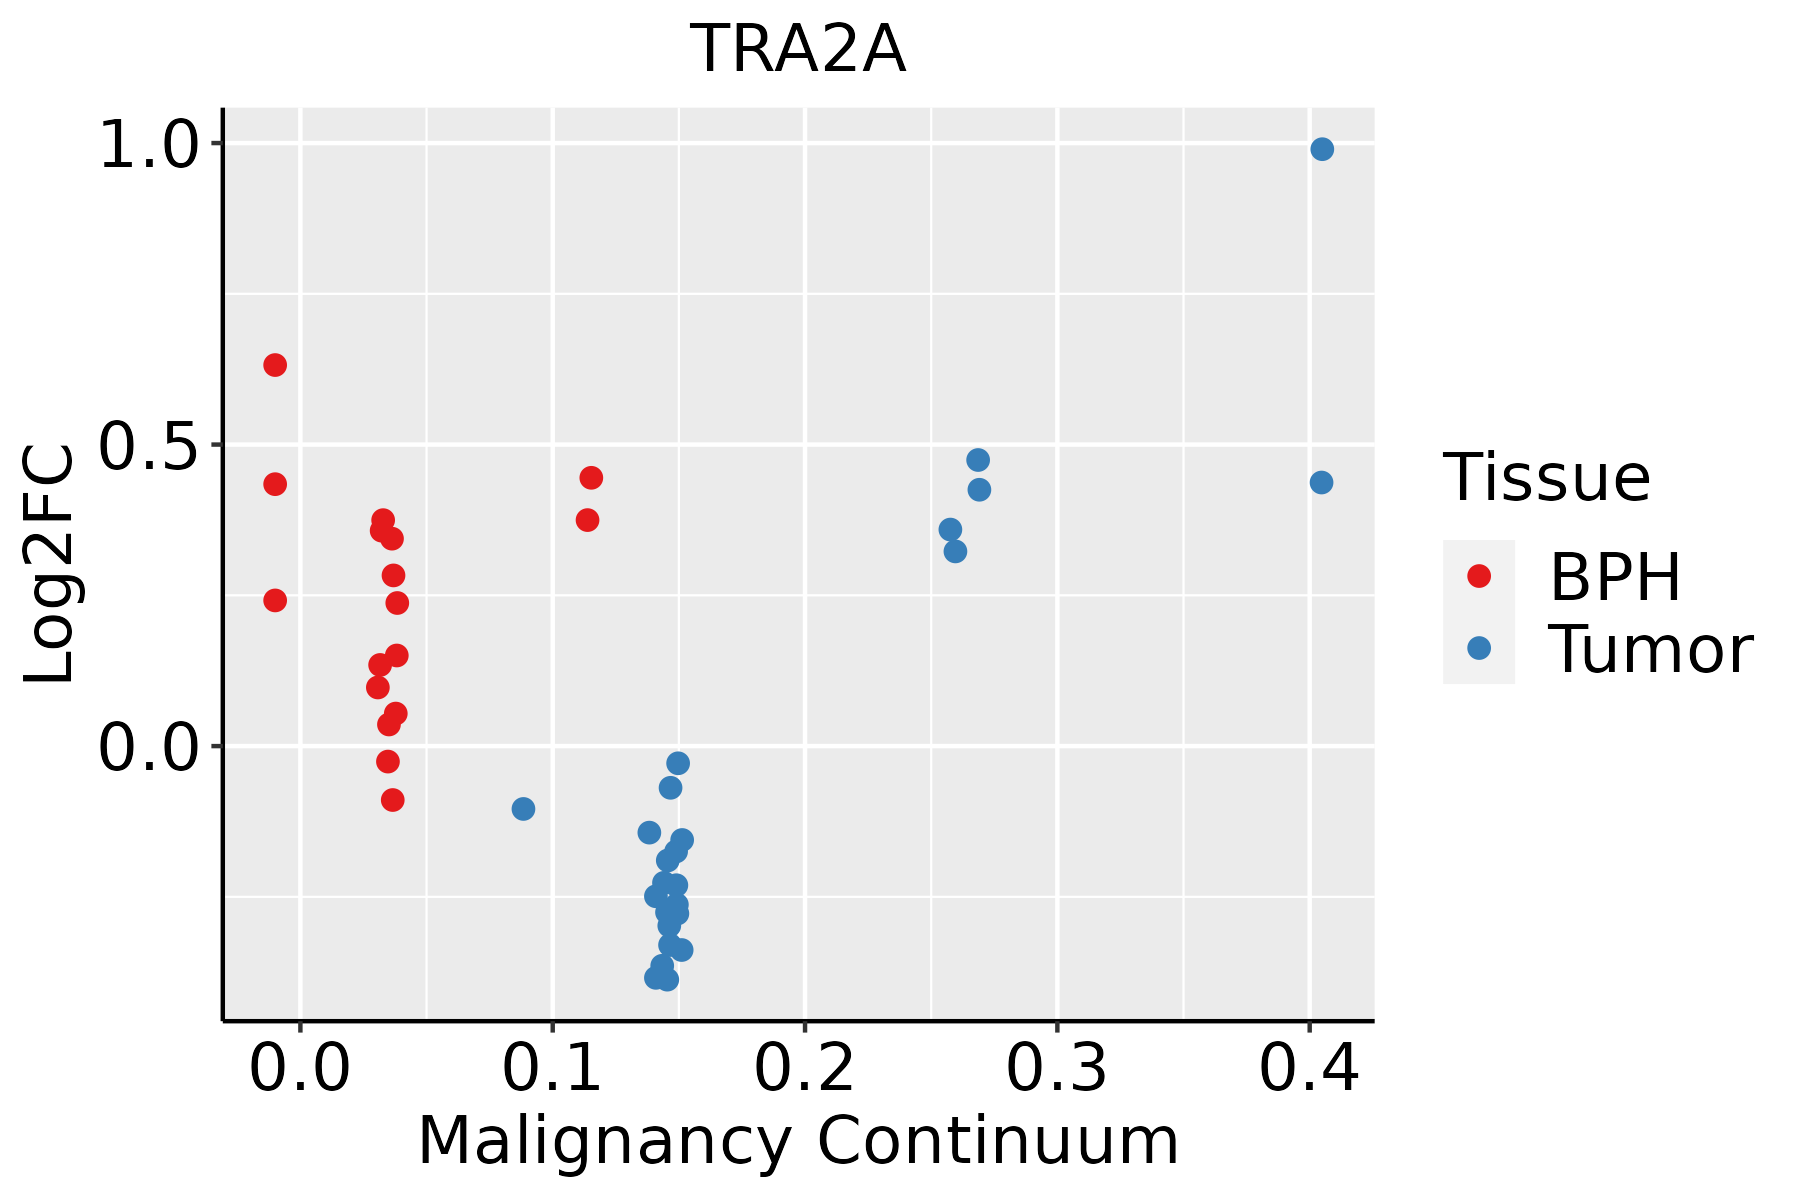 | BPH: Benign Prostatic Hyperplasia |
| Skin | 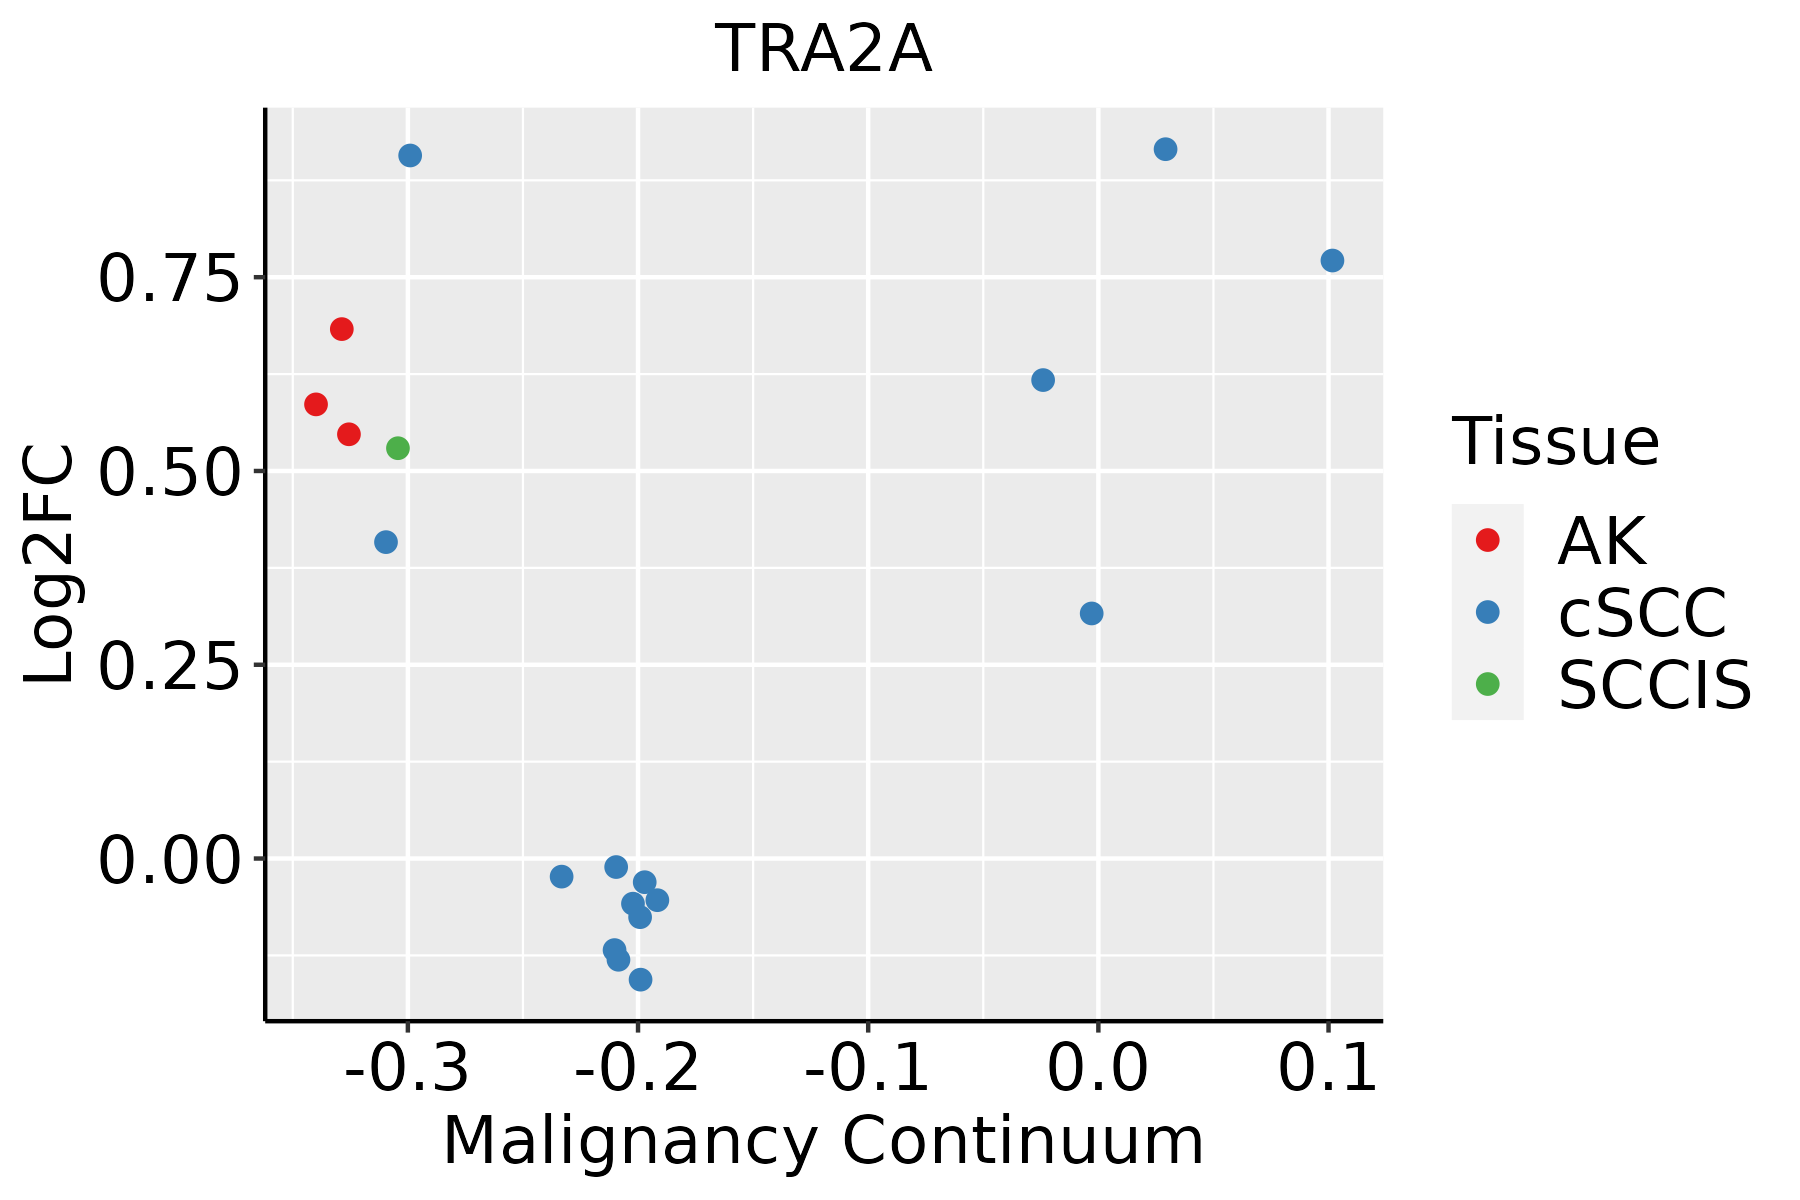 | AK: Actinic keratosis |
| cSCC: Cutaneous squamous cell carcinoma | ||
| SCCIS:squamous cell carcinoma in situ | ||
| Thyroid | 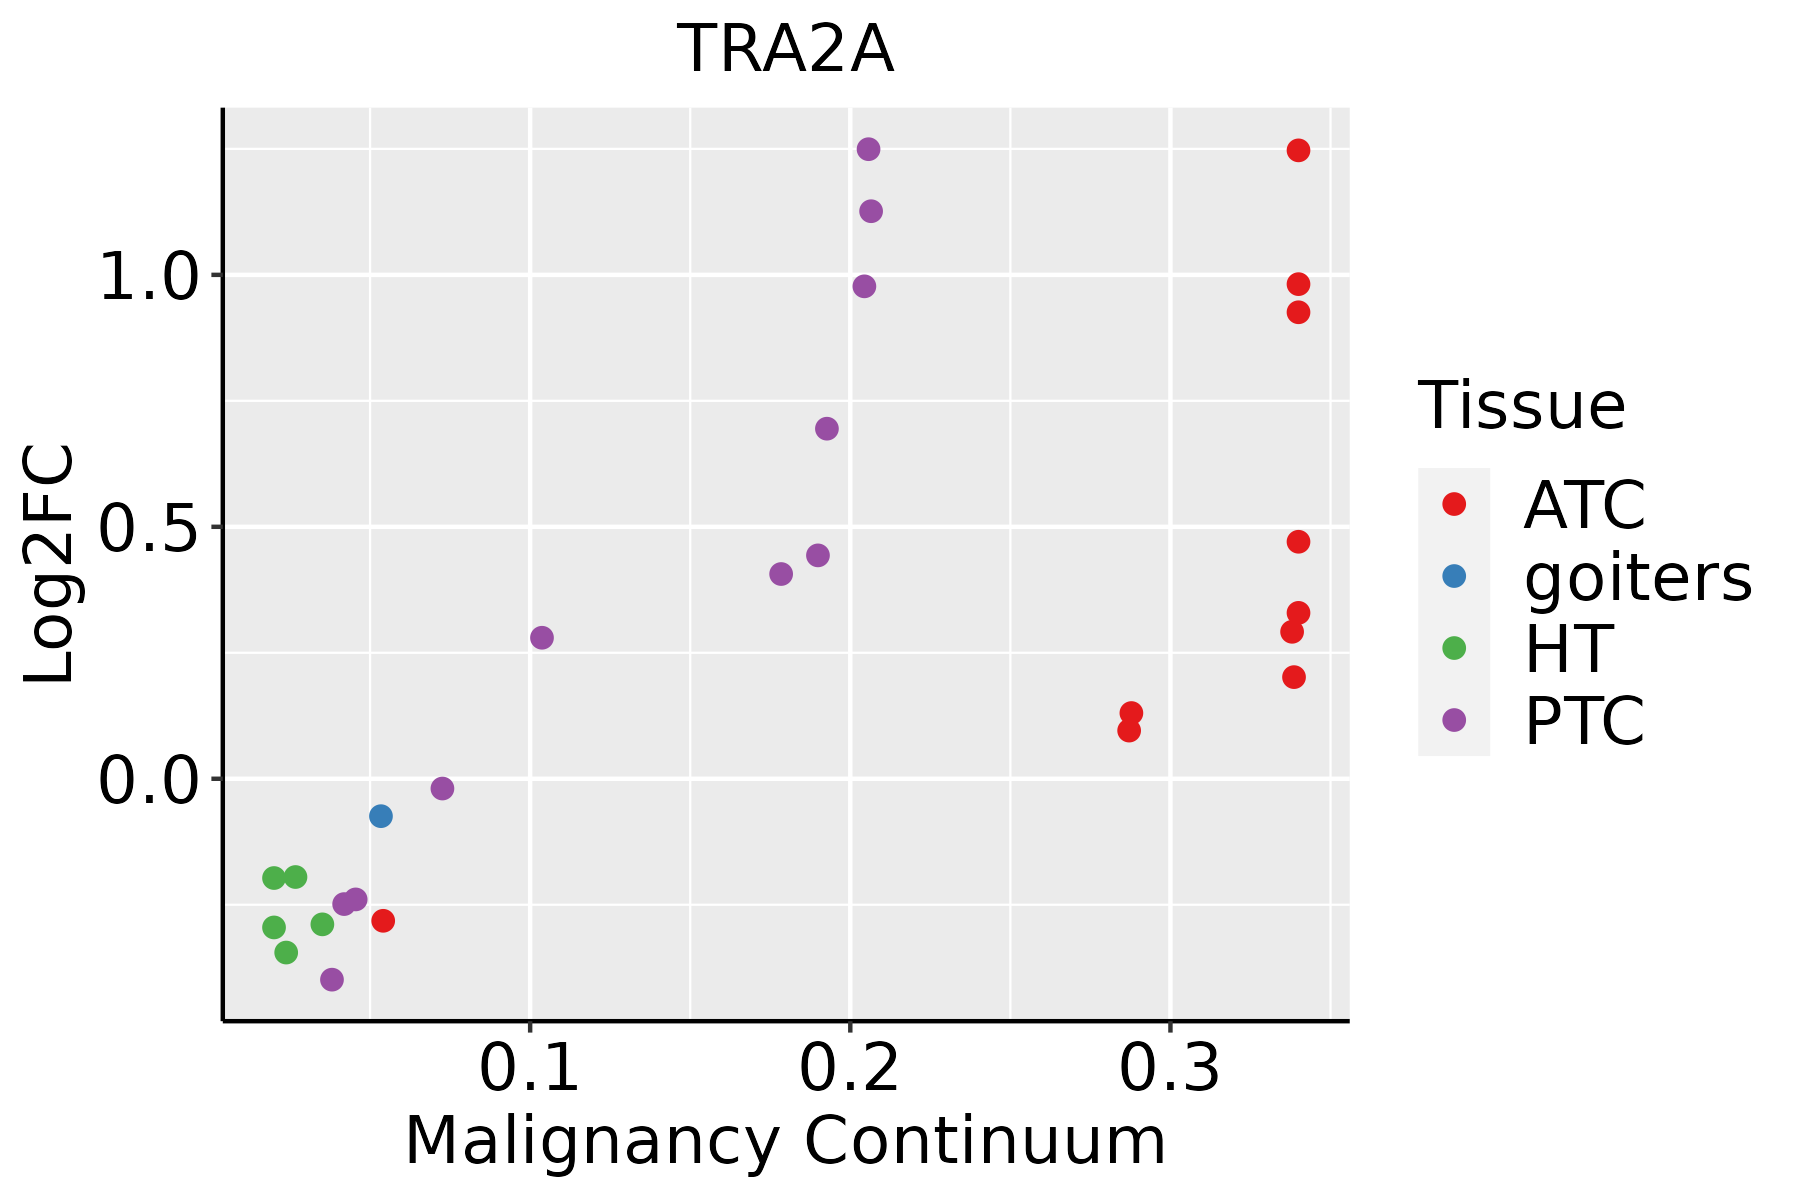 | ATC: Anaplastic thyroid cancer |
| HT: Hashimoto's thyroiditis | ||
| PTC: Papillary thyroid cancer |
| ∗log2FC in expression of this searched gene in stem-like cells from each diseased tissue sample relative to stem-like cells in normal samples in each tissue plotted against the malignancy continuum. Samples are colored based on if they are from different disease stage. |
Top |
Malignant transformation related pathway analysis |
| Find out the enriched GO biological processes and KEGG pathways involved in transition from healthy to precancer to cancer |
| Tissue | Disease Stage | Enriched GO biological Processes |
| Colorectum | AD |  |
| Colorectum | SER |  |
| Colorectum | MSS |  |
| Colorectum | MSI-H |  |
| Colorectum | FAP |  |
| ∗Top 15 enriched GO BP terms are showed in the bar plot of each disease state in each tissue. Each row represents a significant GO biological process which is colored according to the -log10(p.adjust). |
| Page: 1 2 3 4 5 6 7 8 9 |
| GO ID | Tissue | Disease Stage | Description | Gene Ratio | Bg Ratio | pvalue | p.adjust | Count |
| GO:00083806 | Stomach | CAG with IM | RNA splicing | 39/1050 | 434/18723 | 2.55e-03 | 2.49e-02 | 39 |
| GO:003312011 | Stomach | CAG with IM | positive regulation of RNA splicing | 7/1050 | 37/18723 | 4.01e-03 | 3.47e-02 | 7 |
| GO:00003776 | Stomach | CAG with IM | RNA splicing, via transesterification reactions with bulged adenosine as nucleophile | 30/1050 | 320/18723 | 4.15e-03 | 3.56e-02 | 30 |
| GO:00003986 | Stomach | CAG with IM | mRNA splicing, via spliceosome | 30/1050 | 320/18723 | 4.15e-03 | 3.56e-02 | 30 |
| GO:00480246 | Stomach | CAG with IM | regulation of mRNA splicing, via spliceosome | 13/1050 | 101/18723 | 4.19e-03 | 3.57e-02 | 13 |
| GO:00003756 | Stomach | CAG with IM | RNA splicing, via transesterification reactions | 30/1050 | 324/18723 | 4.95e-03 | 4.01e-02 | 30 |
| GO:004802621 | Stomach | CSG | positive regulation of mRNA splicing, via spliceosome | 6/1034 | 22/18723 | 9.71e-04 | 1.25e-02 | 6 |
| GO:000838011 | Stomach | CSG | RNA splicing | 40/1034 | 434/18723 | 1.07e-03 | 1.35e-02 | 40 |
| GO:004348421 | Stomach | CSG | regulation of RNA splicing | 18/1034 | 148/18723 | 1.36e-03 | 1.58e-02 | 18 |
| GO:000037711 | Stomach | CSG | RNA splicing, via transesterification reactions with bulged adenosine as nucleophile | 31/1034 | 320/18723 | 1.74e-03 | 1.89e-02 | 31 |
| GO:000039811 | Stomach | CSG | mRNA splicing, via spliceosome | 31/1034 | 320/18723 | 1.74e-03 | 1.89e-02 | 31 |
| GO:000037511 | Stomach | CSG | RNA splicing, via transesterification reactions | 31/1034 | 324/18723 | 2.11e-03 | 2.17e-02 | 31 |
| GO:003312021 | Stomach | CSG | positive regulation of RNA splicing | 7/1034 | 37/18723 | 3.68e-03 | 3.27e-02 | 7 |
| GO:004802411 | Stomach | CSG | regulation of mRNA splicing, via spliceosome | 13/1034 | 101/18723 | 3.68e-03 | 3.27e-02 | 13 |
| GO:004348430 | Thyroid | HT | regulation of RNA splicing | 46/1272 | 148/18723 | 4.82e-19 | 6.71e-16 | 46 |
| GO:000838028 | Thyroid | HT | RNA splicing | 84/1272 | 434/18723 | 1.23e-18 | 1.14e-15 | 84 |
| GO:000037527 | Thyroid | HT | RNA splicing, via transesterification reactions | 66/1272 | 324/18723 | 4.86e-16 | 2.08e-13 | 66 |
| GO:000037727 | Thyroid | HT | RNA splicing, via transesterification reactions with bulged adenosine as nucleophile | 65/1272 | 320/18723 | 9.43e-16 | 3.50e-13 | 65 |
| GO:000039827 | Thyroid | HT | mRNA splicing, via spliceosome | 65/1272 | 320/18723 | 9.43e-16 | 3.50e-13 | 65 |
| GO:004802429 | Thyroid | HT | regulation of mRNA splicing, via spliceosome | 34/1272 | 101/18723 | 1.32e-15 | 4.57e-13 | 34 |
| Page: 1 2 3 4 5 6 7 8 9 10 11 12 13 14 15 16 17 |
| Pathway ID | Tissue | Disease Stage | Description | Gene Ratio | Bg Ratio | pvalue | p.adjust | qvalue | Count |
| hsa03040 | Colorectum | AD | Spliceosome | 73/2092 | 217/8465 | 1.73e-03 | 9.68e-03 | 6.18e-03 | 73 |
| hsa030401 | Colorectum | AD | Spliceosome | 73/2092 | 217/8465 | 1.73e-03 | 9.68e-03 | 6.18e-03 | 73 |
| hsa030402 | Colorectum | MSS | Spliceosome | 66/1875 | 217/8465 | 2.58e-03 | 1.27e-02 | 7.81e-03 | 66 |
| hsa030403 | Colorectum | MSS | Spliceosome | 66/1875 | 217/8465 | 2.58e-03 | 1.27e-02 | 7.81e-03 | 66 |
| hsa030409 | Endometrium | AEH | Spliceosome | 54/1197 | 217/8465 | 1.47e-05 | 1.65e-04 | 1.21e-04 | 54 |
| hsa0304014 | Endometrium | AEH | Spliceosome | 54/1197 | 217/8465 | 1.47e-05 | 1.65e-04 | 1.21e-04 | 54 |
| hsa0304024 | Endometrium | EEC | Spliceosome | 54/1237 | 217/8465 | 3.78e-05 | 3.88e-04 | 2.89e-04 | 54 |
| hsa0304034 | Endometrium | EEC | Spliceosome | 54/1237 | 217/8465 | 3.78e-05 | 3.88e-04 | 2.89e-04 | 54 |
| hsa0304018 | Esophagus | HGIN | Spliceosome | 79/1383 | 217/8465 | 3.22e-13 | 7.00e-12 | 5.56e-12 | 79 |
| hsa0304019 | Esophagus | HGIN | Spliceosome | 79/1383 | 217/8465 | 3.22e-13 | 7.00e-12 | 5.56e-12 | 79 |
| hsa0304027 | Esophagus | ESCC | Spliceosome | 128/4205 | 217/8465 | 3.31e-03 | 8.79e-03 | 4.50e-03 | 128 |
| hsa0304037 | Esophagus | ESCC | Spliceosome | 128/4205 | 217/8465 | 3.31e-03 | 8.79e-03 | 4.50e-03 | 128 |
| hsa030407 | Liver | Cirrhotic | Spliceosome | 102/2530 | 217/8465 | 5.69e-08 | 9.47e-07 | 5.84e-07 | 102 |
| hsa04936 | Liver | Cirrhotic | Alcoholic liver disease | 60/2530 | 142/8465 | 1.07e-03 | 5.85e-03 | 3.61e-03 | 60 |
| hsa0304012 | Liver | Cirrhotic | Spliceosome | 102/2530 | 217/8465 | 5.69e-08 | 9.47e-07 | 5.84e-07 | 102 |
| hsa049361 | Liver | Cirrhotic | Alcoholic liver disease | 60/2530 | 142/8465 | 1.07e-03 | 5.85e-03 | 3.61e-03 | 60 |
| hsa049362 | Liver | HCC | Alcoholic liver disease | 89/4020 | 142/8465 | 1.73e-04 | 8.53e-04 | 4.75e-04 | 89 |
| hsa0304022 | Liver | HCC | Spliceosome | 122/4020 | 217/8465 | 5.55e-03 | 1.60e-02 | 8.91e-03 | 122 |
| hsa049363 | Liver | HCC | Alcoholic liver disease | 89/4020 | 142/8465 | 1.73e-04 | 8.53e-04 | 4.75e-04 | 89 |
| hsa0304032 | Liver | HCC | Spliceosome | 122/4020 | 217/8465 | 5.55e-03 | 1.60e-02 | 8.91e-03 | 122 |
| Page: 1 2 |
Top |
Cell-cell communication analysis |
| Identification of potential cell-cell interactions between two cell types and their ligand-receptor pairs for different disease states |
| Ligand | Receptor | LRpair | Pathway | Tissue | Disease Stage |
| Page: 1 |
Top |
Single-cell gene regulatory network inference analysis |
| Find out the significant the regulons (TFs) and the target genes of each regulon across cell types for different disease states |
| TF | Cell Type | Tissue | Disease Stage | Target Gene | RSS | Regulon Activity |
| ∗The dot plots of a searched regulon are shown for all cell subpopulations in each disease state of each tissue based on the regulon specific score inferred using pySCENIC and by calculating the average expression. |
| Page: 1 |
Top |
Somatic mutation of malignant transformation related genes |
| Annotation of somatic variants for genes involved in malignant transformation |
| Hugo Symbol | Variant Class | Variant Classification | dbSNP RS | HGVSc | HGVSp | HGVSp Short | SWISSPROT | BIOTYPE | SIFT | PolyPhen | Tumor Sample Barcode | Tissue | Histology | Sex | Age | Stage | Therapy Types | Drugs | Outcome |
| TRA2A | SNV | Missense_Mutation | rs754412749 | c.764G>A | p.Arg255Gln | p.R255Q | Q13595 | protein_coding | tolerated_low_confidence(0.3) | benign(0.105) | TCGA-AN-A046-01 | Breast | breast invasive carcinoma | Female | >=65 | I/II | Unknown | Unknown | SD |
| TRA2A | SNV | Missense_Mutation | c.757N>A | p.Asp253Asn | p.D253N | Q13595 | protein_coding | deleterious_low_confidence(0.03) | probably_damaging(0.956) | TCGA-EW-A1IW-01 | Breast | breast invasive carcinoma | Female | >=65 | I/II | Hormone Therapy | aromasin | SD | |
| TRA2A | SNV | Missense_Mutation | rs776132151 | c.571C>T | p.Arg191Trp | p.R191W | Q13595 | protein_coding | deleterious(0) | probably_damaging(1) | TCGA-2W-A8YY-01 | Cervix | cervical & endocervical cancer | Female | <65 | I/II | Chemotherapy | cisplatin | CR |
| TRA2A | SNV | Missense_Mutation | c.524N>G | p.Glu175Gly | p.E175G | Q13595 | protein_coding | tolerated(0.06) | benign(0.066) | TCGA-C5-A0TN-01 | Cervix | cervical & endocervical cancer | Female | <65 | I/II | Chemotherapy | cisplatin | PD | |
| TRA2A | SNV | Missense_Mutation | c.230N>G | p.Ser77Cys | p.S77C | Q13595 | protein_coding | deleterious_low_confidence(0.01) | possibly_damaging(0.869) | TCGA-IR-A3LH-01 | Cervix | cervical & endocervical cancer | Female | <65 | I/II | Chemotherapy | cisplatin | CR | |
| TRA2A | SNV | Missense_Mutation | rs200126944 | c.730C>T | p.Arg244Cys | p.R244C | Q13595 | protein_coding | deleterious(0) | benign(0.217) | TCGA-CA-6717-01 | Colorectum | colon adenocarcinoma | Male | <65 | I/II | Chemotherapy | oxaliplatin | CR |
| TRA2A | SNV | Missense_Mutation | c.322N>T | p.His108Tyr | p.H108Y | Q13595 | protein_coding | deleterious(0.04) | benign(0.14) | TCGA-CK-4951-01 | Colorectum | colon adenocarcinoma | Female | >=65 | I/II | Unknown | Unknown | PD | |
| TRA2A | SNV | Missense_Mutation | rs776132151 | c.571C>T | p.Arg191Trp | p.R191W | Q13595 | protein_coding | deleterious(0) | probably_damaging(1) | TCGA-F5-6814-01 | Colorectum | rectum adenocarcinoma | Male | <65 | I/II | Unknown | Unknown | SD |
| TRA2A | SNV | Missense_Mutation | novel | c.199C>T | p.Arg67Cys | p.R67C | Q13595 | protein_coding | deleterious_low_confidence(0) | possibly_damaging(0.586) | TCGA-A5-A1OF-01 | Endometrium | uterine corpus endometrioid carcinoma | Female | <65 | I/II | Unknown | Unknown | SD |
| TRA2A | SNV | Missense_Mutation | novel | c.160T>G | p.Ser54Ala | p.S54A | Q13595 | protein_coding | deleterious_low_confidence(0.04) | possibly_damaging(0.661) | TCGA-AJ-A23O-01 | Endometrium | uterine corpus endometrioid carcinoma | Female | >=65 | I/II | Unknown | Unknown | SD |
| Page: 1 2 3 4 |
Top |
Related drugs of malignant transformation related genes |
| Identification of chemicals and drugs interact with genes involved in malignant transfromation |
| (DGIdb 4.0) |
| Entrez ID | Symbol | Category | Interaction Types | Drug Claim Name | Drug Name | PMIDs |
| Page: 1 |

Copyright 2023-Present -The University of Texas Health Science Center at Houston |