
|
|||||
|
 | |
| |
| |
| |
| |
| |
|
Gene: TMEM59 |
Gene summary for TMEM59 |
| Gene information | Species | Human | Gene symbol | TMEM59 | Gene ID | 9528 |
| Gene name | transmembrane protein 59 | |
| Gene Alias | C1orf8 | |
| Cytomap | 1p32.3 | |
| Gene Type | protein-coding | GO ID | GO:0006464 | UniProtAcc | D3DQ48 |
Top |
Malignant transformation analysis |
| Identification of the aberrant gene expression in precancerous and cancerous lesions by comparing the gene expression of stem-like cells in diseased tissues with normal stem cells |
| Entrez ID | Symbol | Replicates | Species | Organ | Tissue | Adj P-value | Log2FC | Malignancy |
| 9528 | TMEM59 | GSM4909280 | Human | Breast | Precancer | 2.06e-02 | -6.36e-01 | 0.0305 |
| 9528 | TMEM59 | GSM4909282 | Human | Breast | IDC | 7.17e-18 | 4.60e-01 | -0.0288 |
| 9528 | TMEM59 | GSM4909285 | Human | Breast | IDC | 1.01e-03 | 2.86e-01 | 0.21 |
| 9528 | TMEM59 | GSM4909293 | Human | Breast | IDC | 1.94e-05 | -1.45e-01 | 0.1581 |
| 9528 | TMEM59 | GSM4909294 | Human | Breast | IDC | 1.12e-11 | -3.60e-01 | 0.2022 |
| 9528 | TMEM59 | GSM4909296 | Human | Breast | IDC | 3.64e-20 | -4.56e-01 | 0.1524 |
| 9528 | TMEM59 | GSM4909297 | Human | Breast | IDC | 1.24e-24 | -7.56e-02 | 0.1517 |
| 9528 | TMEM59 | GSM4909301 | Human | Breast | IDC | 2.23e-03 | -2.35e-01 | 0.1577 |
| 9528 | TMEM59 | GSM4909305 | Human | Breast | IDC | 1.13e-02 | 2.69e-01 | 0.0436 |
| 9528 | TMEM59 | GSM4909306 | Human | Breast | IDC | 1.71e-02 | 2.59e-01 | 0.1564 |
| 9528 | TMEM59 | GSM4909311 | Human | Breast | IDC | 5.58e-51 | -4.41e-01 | 0.1534 |
| 9528 | TMEM59 | GSM4909312 | Human | Breast | IDC | 6.00e-11 | 9.33e-02 | 0.1552 |
| 9528 | TMEM59 | GSM4909316 | Human | Breast | IDC | 1.76e-03 | -1.55e-01 | 0.21 |
| 9528 | TMEM59 | GSM4909319 | Human | Breast | IDC | 3.39e-61 | -5.19e-01 | 0.1563 |
| 9528 | TMEM59 | GSM4909320 | Human | Breast | IDC | 8.30e-12 | -5.78e-01 | 0.1575 |
| 9528 | TMEM59 | GSM4909321 | Human | Breast | IDC | 3.55e-22 | -2.61e-01 | 0.1559 |
| 9528 | TMEM59 | M2 | Human | Breast | IDC | 6.84e-07 | -5.59e-01 | 0.21 |
| 9528 | TMEM59 | NCCBC14 | Human | Breast | DCIS | 3.69e-21 | -2.14e-01 | 0.2021 |
| 9528 | TMEM59 | NCCBC2 | Human | Breast | DCIS | 3.32e-05 | -1.77e-01 | 0.1554 |
| 9528 | TMEM59 | NCCBC3 | Human | Breast | DCIS | 7.78e-03 | 3.68e-02 | 0.1198 |
| Page: 1 2 3 4 5 6 7 8 9 10 11 12 13 14 |
| Tissue | Expression Dynamics | Abbreviation |
| Breast | 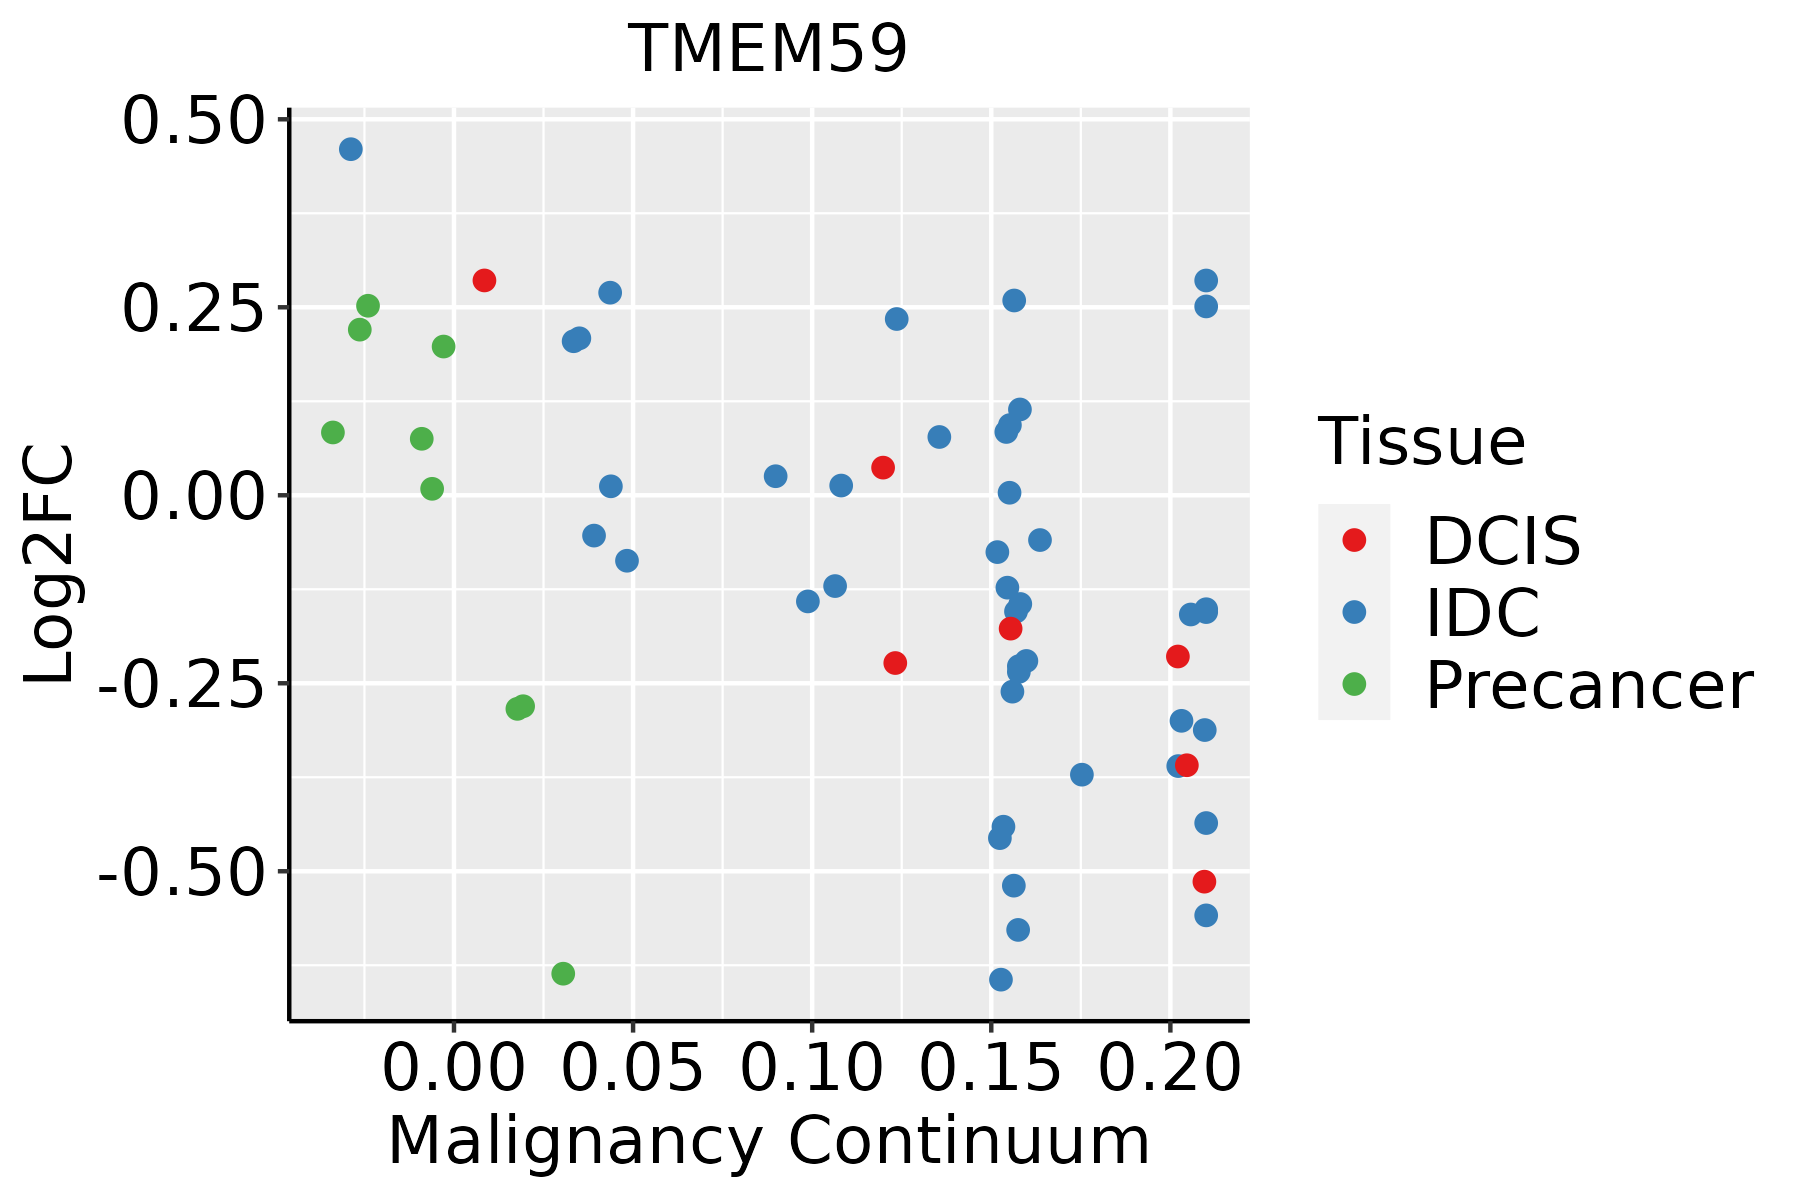 | IDC: Invasive ductal carcinoma |
| DCIS: Ductal carcinoma in situ | ||
| Precancer(BRCA1-mut): Precancerous lesion from BRCA1 mutation carriers | ||
| Cervix | 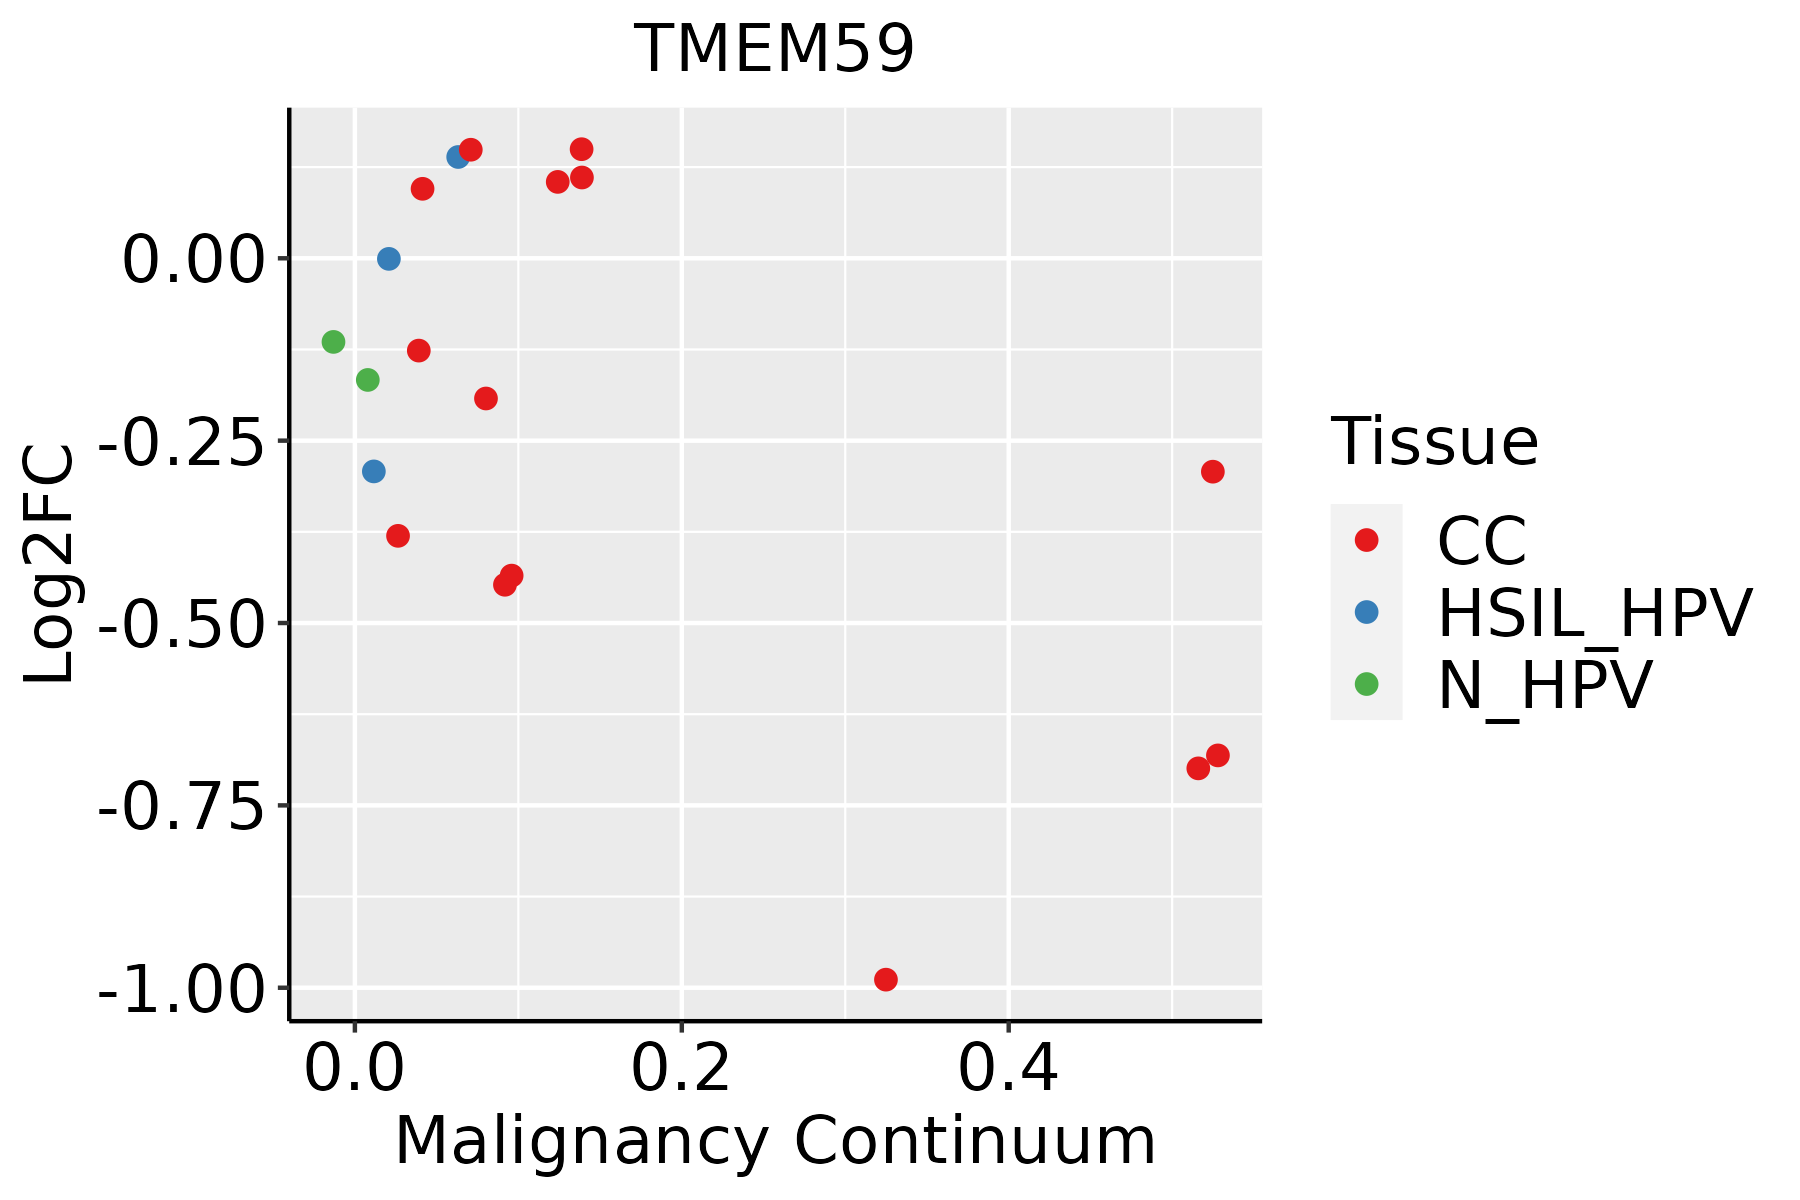 | CC: Cervix cancer |
| HSIL_HPV: HPV-infected high-grade squamous intraepithelial lesions | ||
| N_HPV: HPV-infected normal cervix | ||
| Colorectum (GSE201348) |  | FAP: Familial adenomatous polyposis |
| CRC: Colorectal cancer | ||
| Colorectum (HTA11) | 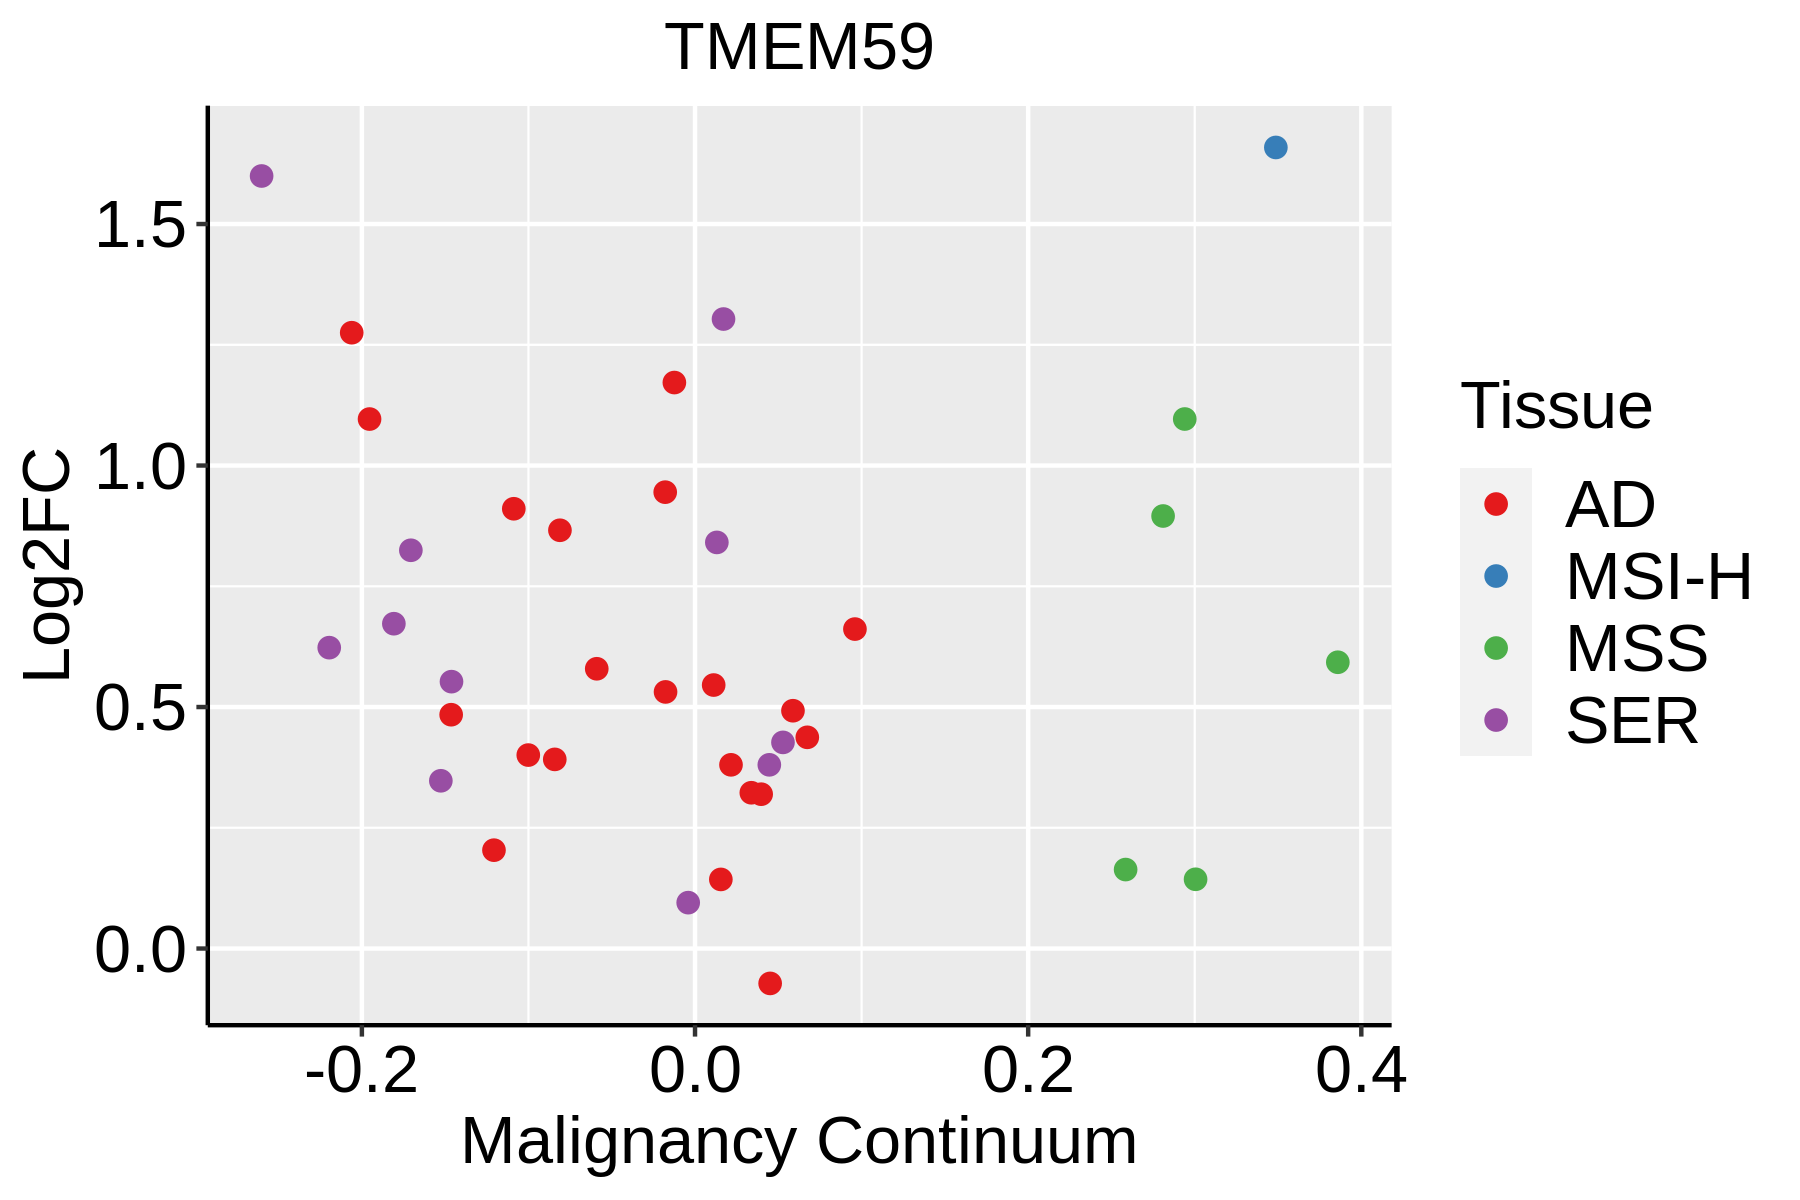 | AD: Adenomas |
| SER: Sessile serrated lesions | ||
| MSI-H: Microsatellite-high colorectal cancer | ||
| MSS: Microsatellite stable colorectal cancer | ||
| Endometrium | 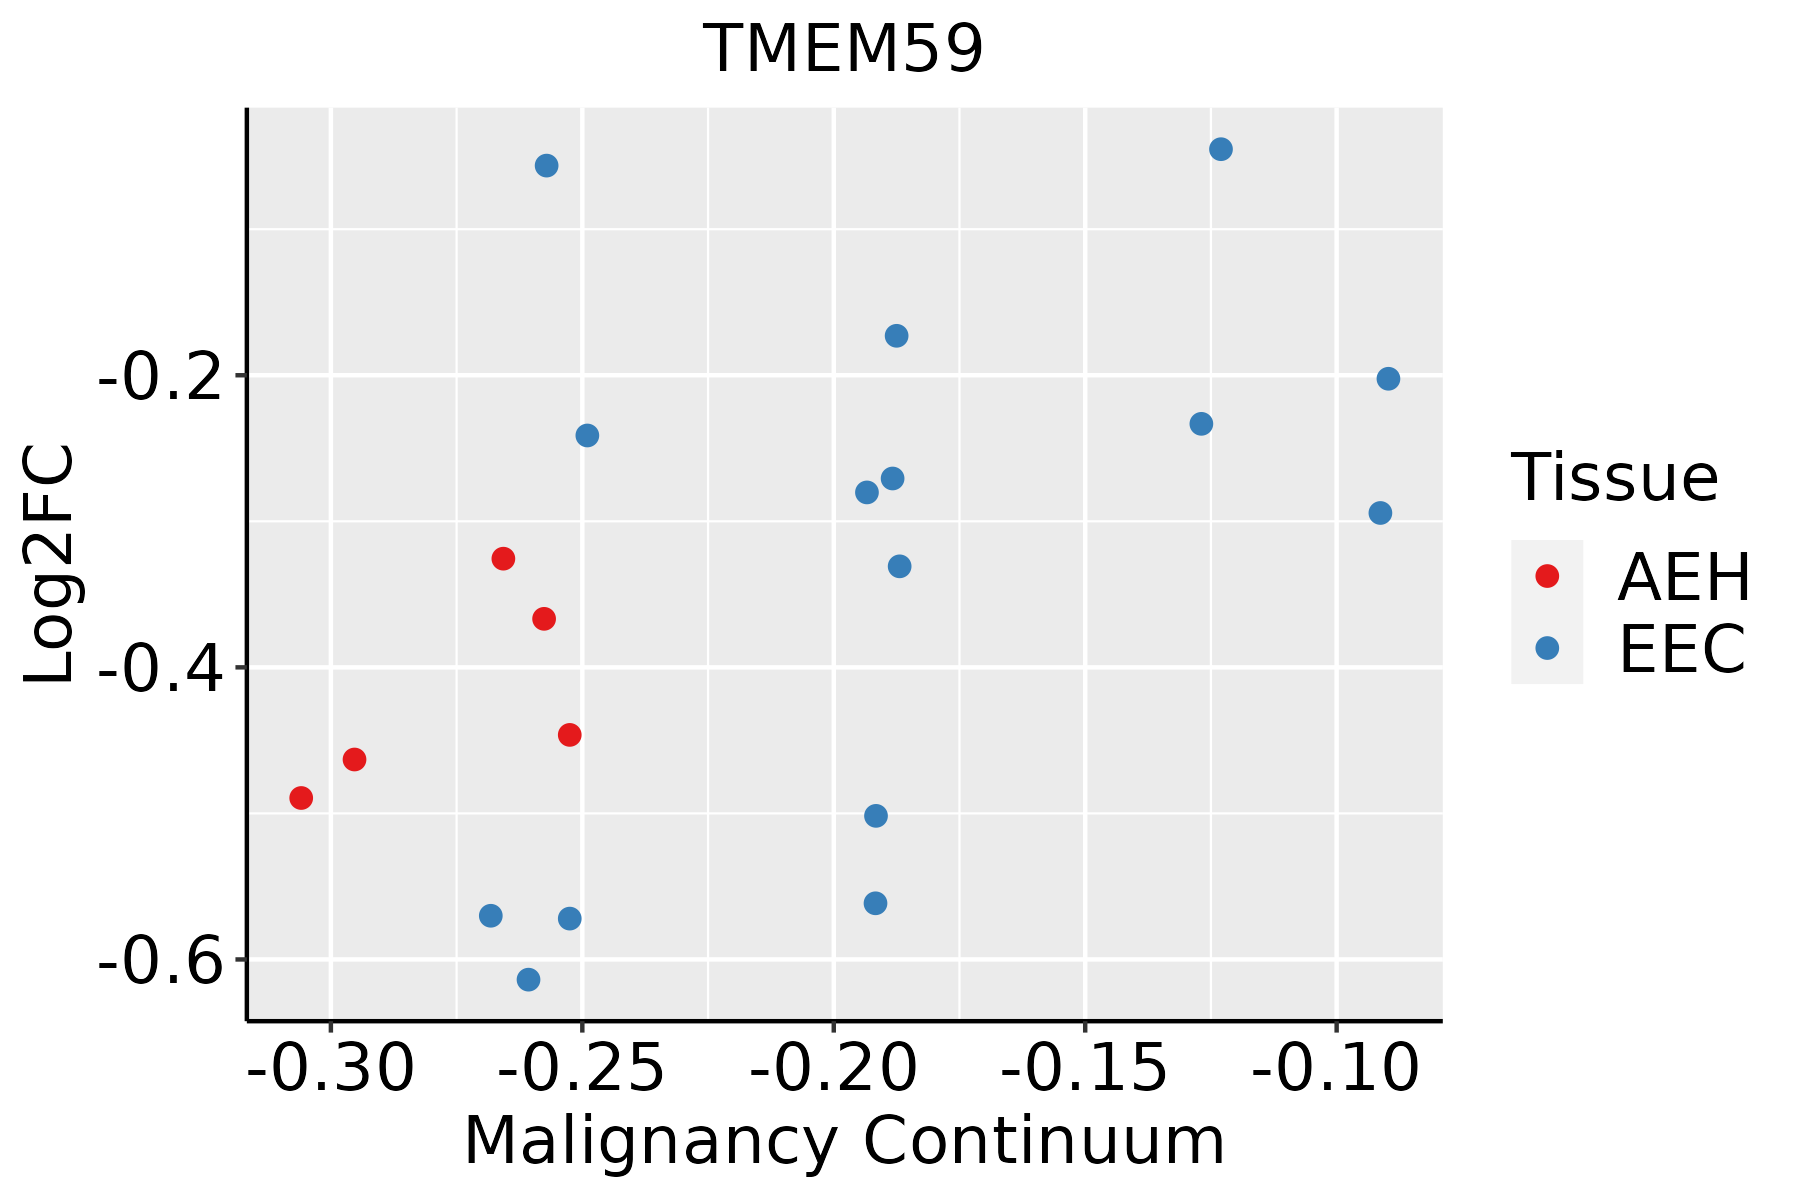 | AEH: Atypical endometrial hyperplasia |
| EEC: Endometrioid Cancer | ||
| Esophagus |  | ESCC: Esophageal squamous cell carcinoma |
| HGIN: High-grade intraepithelial neoplasias | ||
| LGIN: Low-grade intraepithelial neoplasias | ||
| Liver | 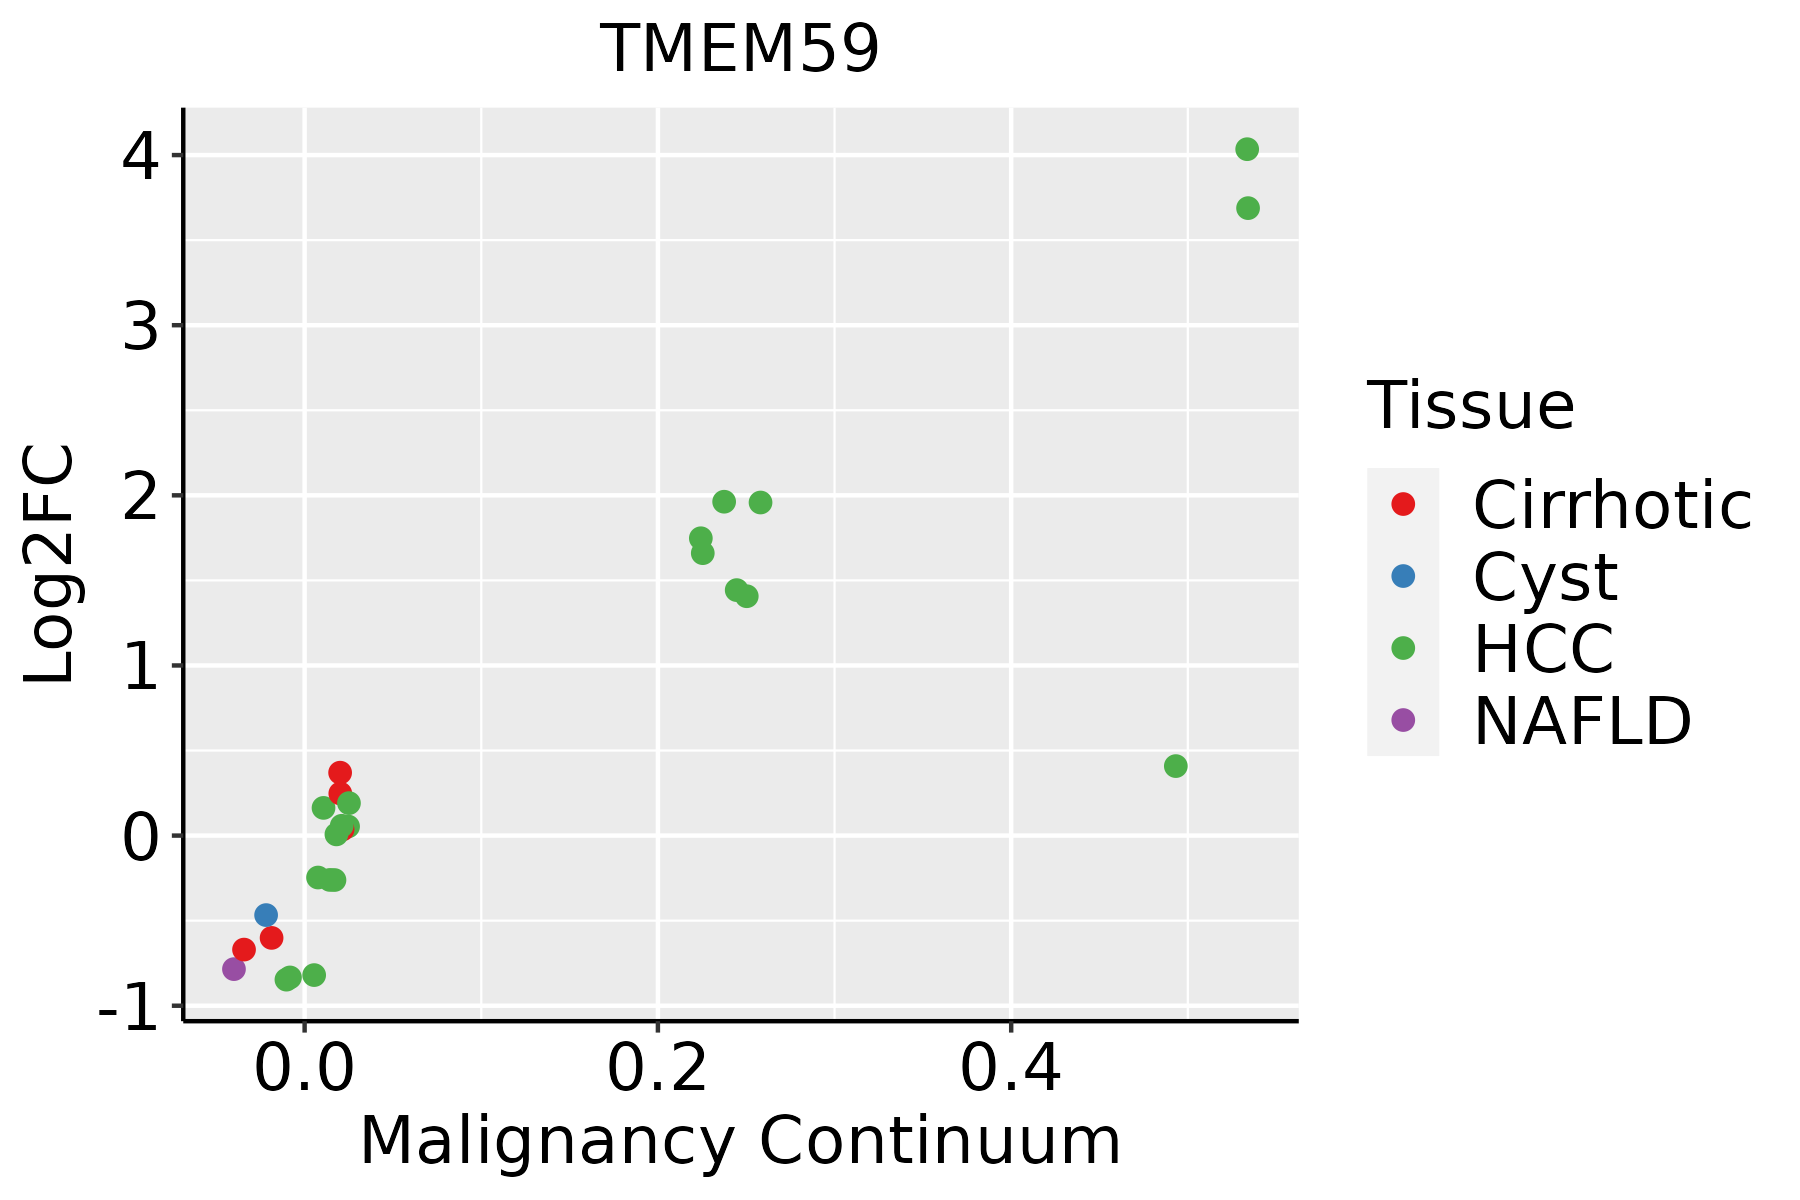 | HCC: Hepatocellular carcinoma |
| NAFLD: Non-alcoholic fatty liver disease | ||
| Oral Cavity | 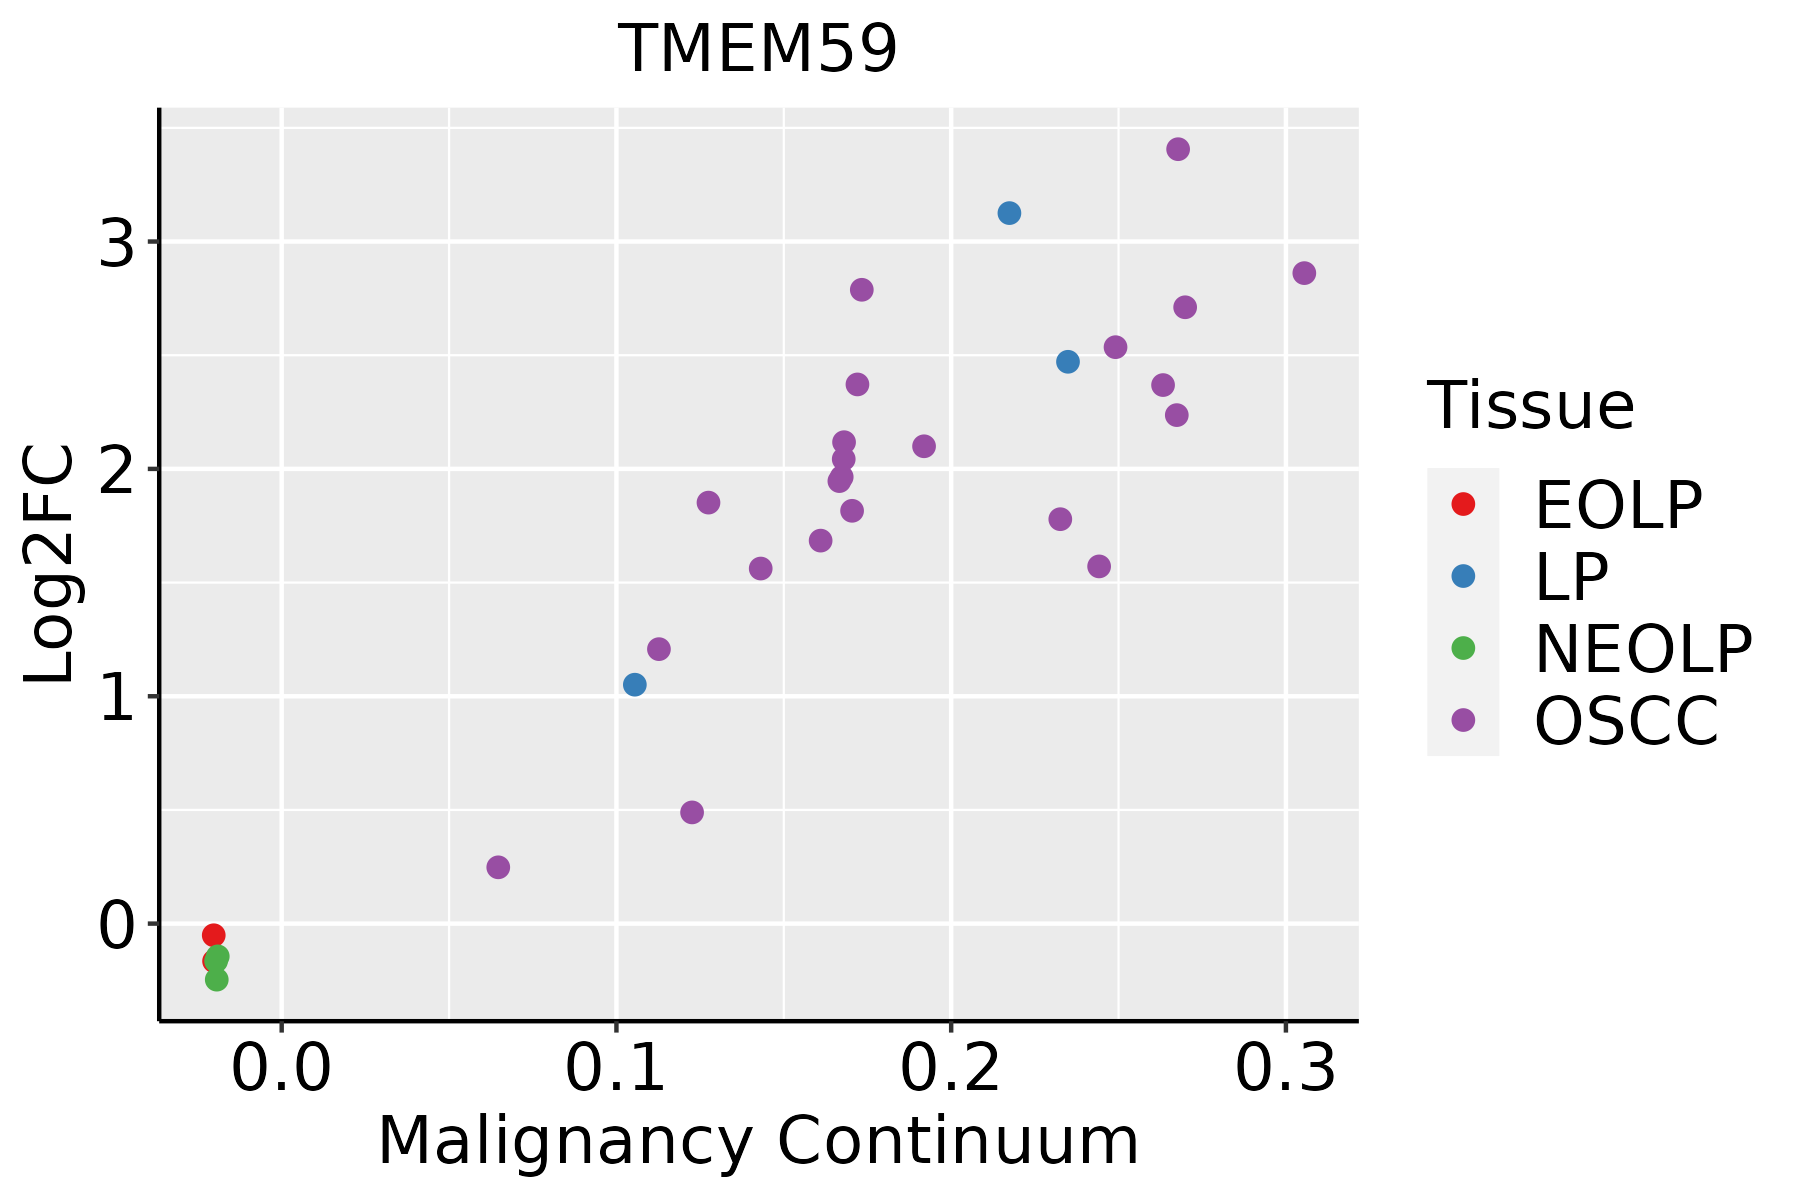 | EOLP: Erosive Oral lichen planus |
| LP: leukoplakia | ||
| NEOLP: Non-erosive oral lichen planus | ||
| OSCC: Oral squamous cell carcinoma | ||
| Prostate | 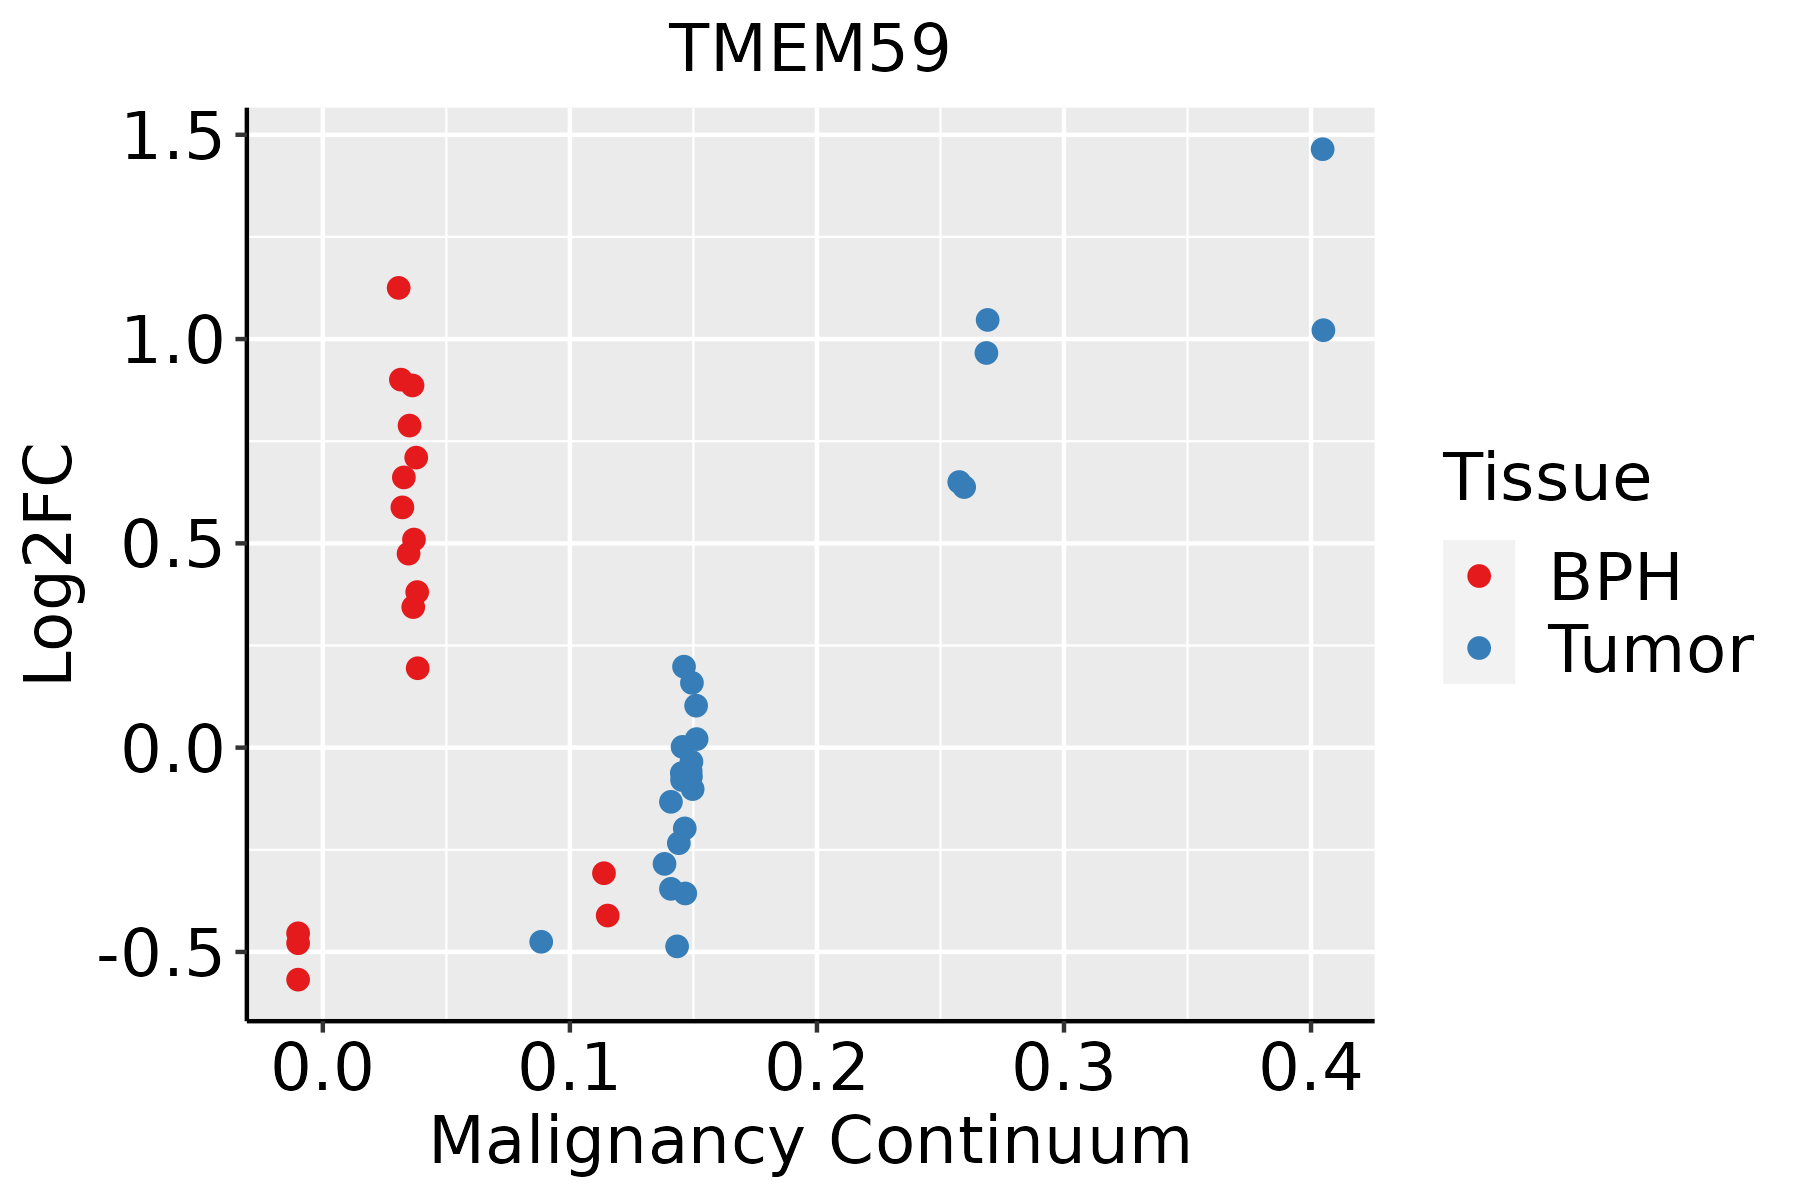 | BPH: Benign Prostatic Hyperplasia |
| Skin | 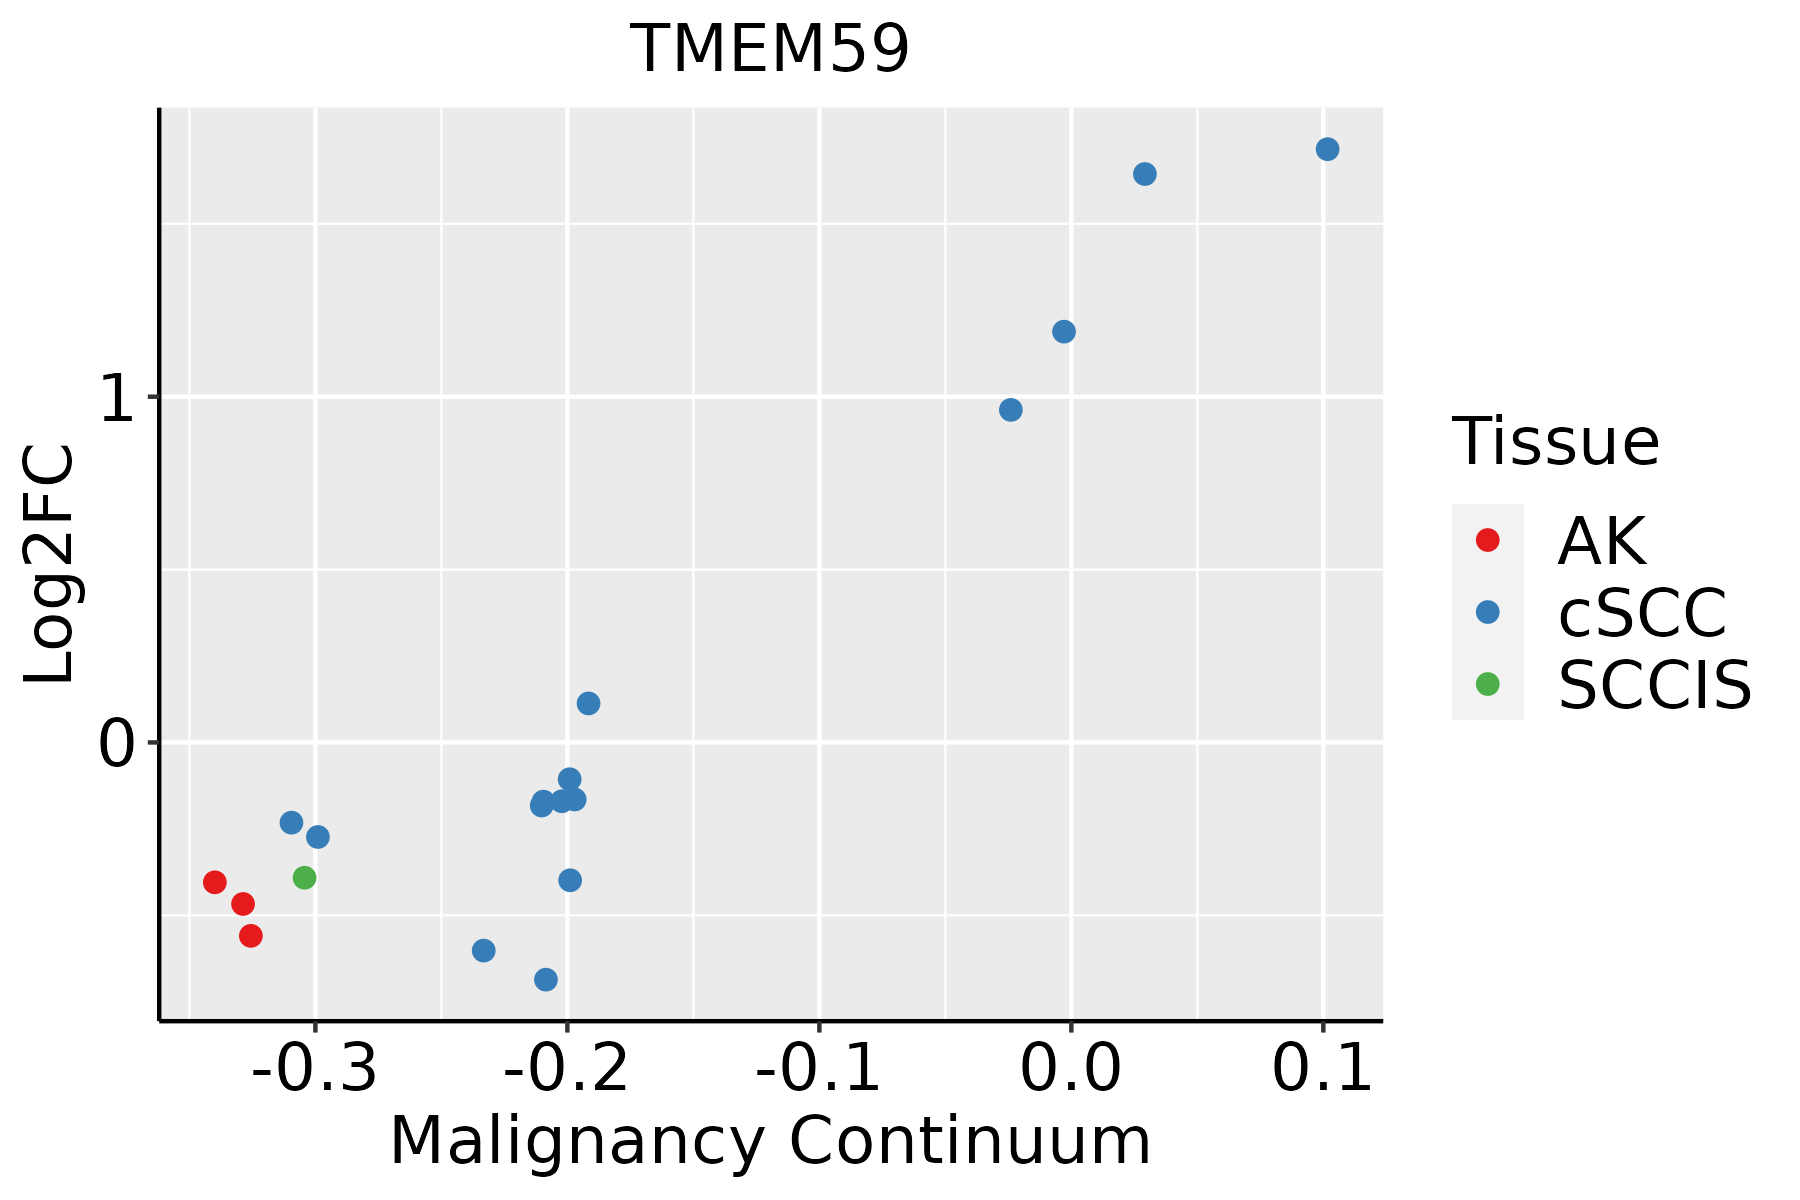 | AK: Actinic keratosis |
| cSCC: Cutaneous squamous cell carcinoma | ||
| SCCIS:squamous cell carcinoma in situ | ||
| Thyroid | 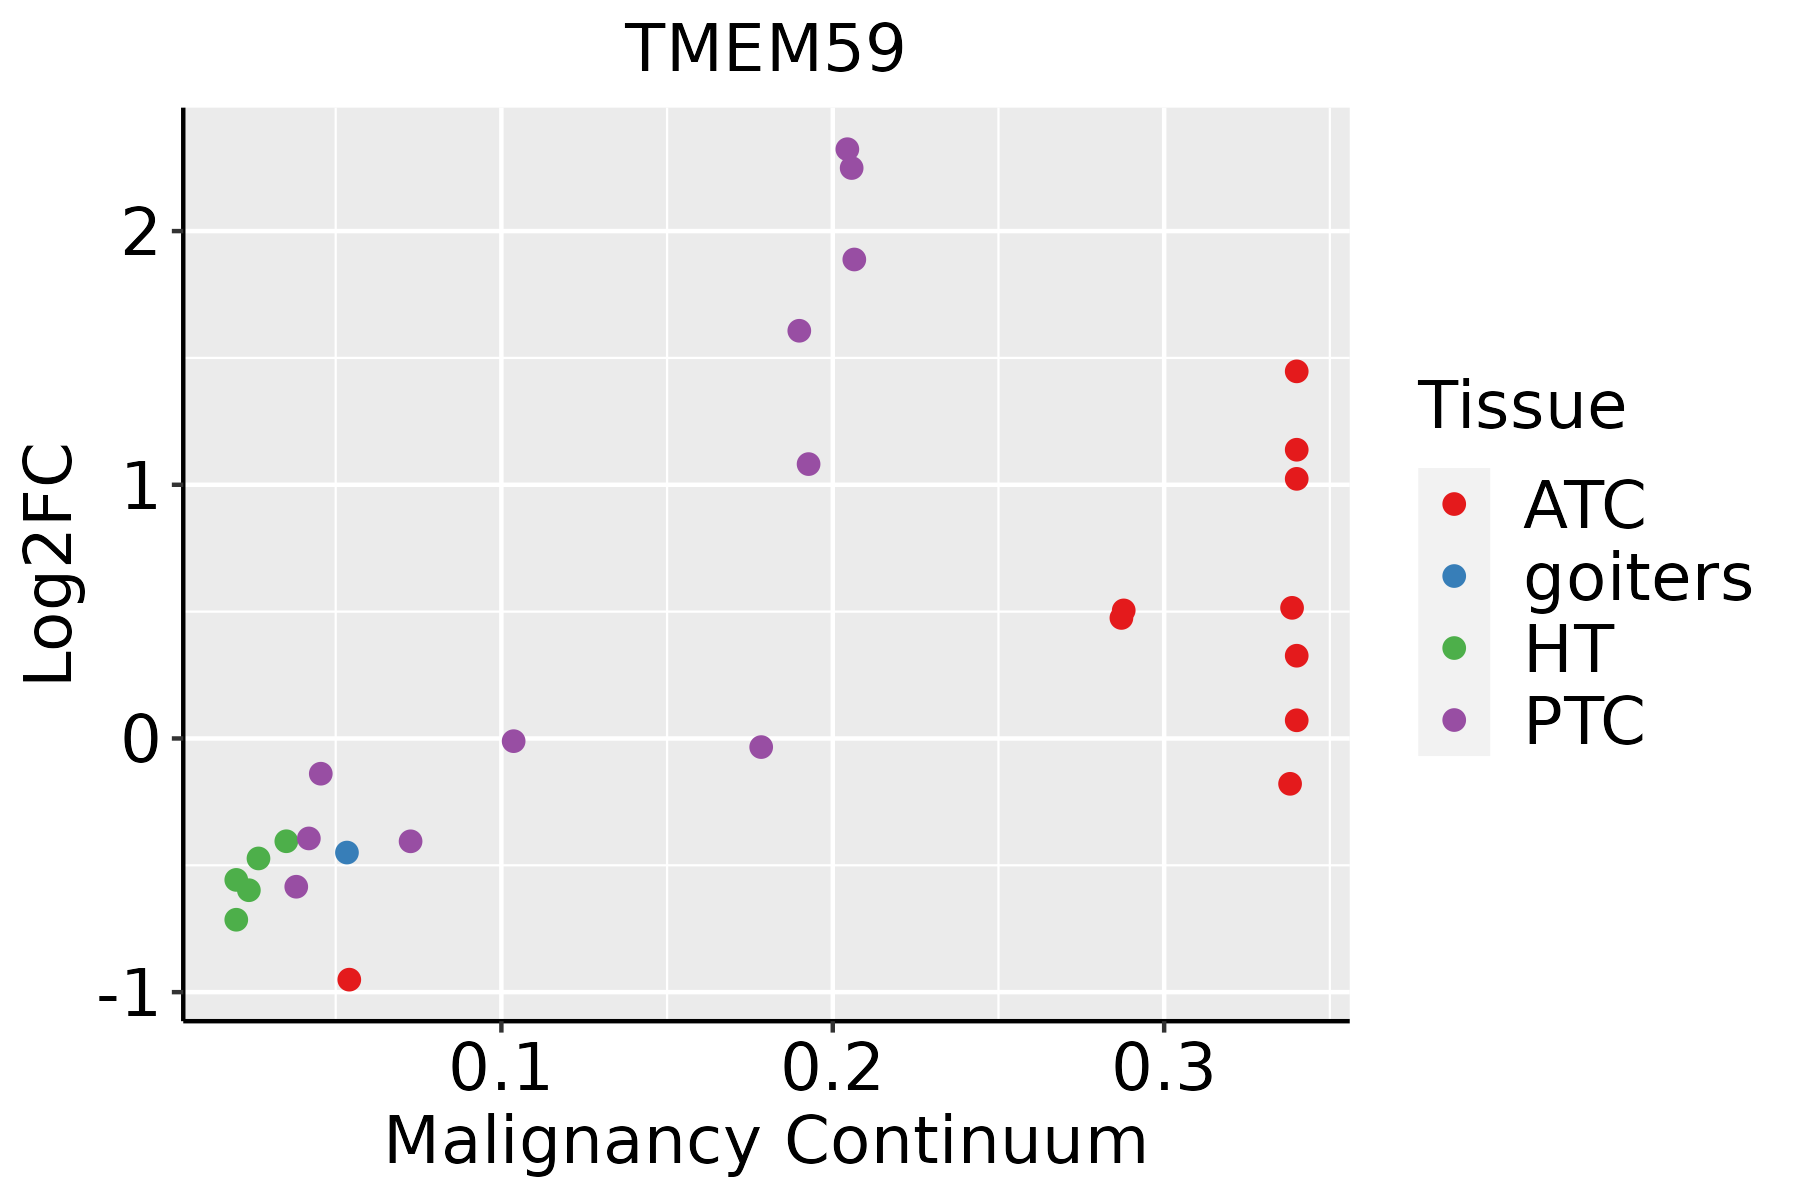 | ATC: Anaplastic thyroid cancer |
| HT: Hashimoto's thyroiditis | ||
| PTC: Papillary thyroid cancer |
| ∗log2FC in expression of this searched gene in stem-like cells from each diseased tissue sample relative to stem-like cells in normal samples in each tissue plotted against the malignancy continuum. Samples are colored based on if they are from different disease stage. |
Top |
Malignant transformation related pathway analysis |
| Find out the enriched GO biological processes and KEGG pathways involved in transition from healthy to precancer to cancer |
| Tissue | Disease Stage | Enriched GO biological Processes |
| Colorectum | AD |  |
| Colorectum | SER |  |
| Colorectum | MSS |  |
| Colorectum | MSI-H |  |
| Colorectum | FAP |  |
| ∗Top 15 enriched GO BP terms are showed in the bar plot of each disease state in each tissue. Each row represents a significant GO biological process which is colored according to the -log10(p.adjust). |
| Page: 1 2 3 4 5 6 7 8 9 |
| GO ID | Tissue | Disease Stage | Description | Gene Ratio | Bg Ratio | pvalue | p.adjust | Count |
| GO:00164855 | Prostate | BPH | protein processing | 62/3107 | 225/18723 | 2.22e-05 | 2.67e-04 | 62 |
| GO:00105086 | Prostate | BPH | positive regulation of autophagy | 39/3107 | 124/18723 | 3.17e-05 | 3.60e-04 | 39 |
| GO:19038287 | Prostate | BPH | negative regulation of cellular protein localization | 36/3107 | 117/18723 | 1.04e-04 | 9.58e-04 | 36 |
| GO:19030776 | Prostate | BPH | negative regulation of protein localization to plasma membrane | 9/3107 | 24/18723 | 1.14e-02 | 4.64e-02 | 9 |
| GO:000989619 | Prostate | Tumor | positive regulation of catabolic process | 155/3246 | 492/18723 | 5.62e-15 | 8.52e-13 | 155 |
| GO:003133119 | Prostate | Tumor | positive regulation of cellular catabolic process | 134/3246 | 427/18723 | 5.54e-13 | 5.84e-11 | 134 |
| GO:007265917 | Prostate | Tumor | protein localization to plasma membrane | 90/3246 | 284/18723 | 2.07e-09 | 8.99e-08 | 90 |
| GO:004586119 | Prostate | Tumor | negative regulation of proteolysis | 102/3246 | 351/18723 | 3.09e-08 | 9.94e-07 | 102 |
| GO:199077815 | Prostate | Tumor | protein localization to cell periphery | 97/3246 | 333/18723 | 5.88e-08 | 1.75e-06 | 97 |
| GO:005160415 | Prostate | Tumor | protein maturation | 81/3246 | 294/18723 | 7.58e-06 | 1.13e-04 | 81 |
| GO:001050614 | Prostate | Tumor | regulation of autophagy | 86/3246 | 317/18723 | 7.77e-06 | 1.16e-04 | 86 |
| GO:190547515 | Prostate | Tumor | regulation of protein localization to membrane | 54/3246 | 175/18723 | 7.84e-06 | 1.16e-04 | 54 |
| GO:190307616 | Prostate | Tumor | regulation of protein localization to plasma membrane | 36/3246 | 104/18723 | 1.61e-05 | 2.16e-04 | 36 |
| GO:001648512 | Prostate | Tumor | protein processing | 63/3246 | 225/18723 | 4.40e-05 | 4.98e-04 | 63 |
| GO:001050814 | Prostate | Tumor | positive regulation of autophagy | 39/3246 | 124/18723 | 8.56e-05 | 8.53e-04 | 39 |
| GO:190437515 | Prostate | Tumor | regulation of protein localization to cell periphery | 39/3246 | 125/18723 | 1.04e-04 | 1.00e-03 | 39 |
| GO:190382812 | Prostate | Tumor | negative regulation of cellular protein localization | 36/3246 | 117/18723 | 2.55e-04 | 2.14e-03 | 36 |
| GO:000989627 | Skin | AK | positive regulation of catabolic process | 94/1910 | 492/18723 | 1.32e-09 | 1.26e-07 | 94 |
| GO:004586127 | Skin | AK | negative regulation of proteolysis | 72/1910 | 351/18723 | 5.40e-09 | 3.90e-07 | 72 |
| GO:003133127 | Skin | AK | positive regulation of cellular catabolic process | 80/1910 | 427/18723 | 5.42e-08 | 2.76e-06 | 80 |
| Page: 1 2 3 4 5 6 7 8 9 10 11 12 13 14 15 16 17 18 19 20 |
| Pathway ID | Tissue | Disease Stage | Description | Gene Ratio | Bg Ratio | pvalue | p.adjust | qvalue | Count |
| Page: 1 |
Top |
Cell-cell communication analysis |
| Identification of potential cell-cell interactions between two cell types and their ligand-receptor pairs for different disease states |
| Ligand | Receptor | LRpair | Pathway | Tissue | Disease Stage |
| Page: 1 |
Top |
Single-cell gene regulatory network inference analysis |
| Find out the significant the regulons (TFs) and the target genes of each regulon across cell types for different disease states |
| TF | Cell Type | Tissue | Disease Stage | Target Gene | RSS | Regulon Activity |
| ∗The dot plots of a searched regulon are shown for all cell subpopulations in each disease state of each tissue based on the regulon specific score inferred using pySCENIC and by calculating the average expression. |
| Page: 1 |
Top |
Somatic mutation of malignant transformation related genes |
| Annotation of somatic variants for genes involved in malignant transformation |
| Hugo Symbol | Variant Class | Variant Classification | dbSNP RS | HGVSc | HGVSp | HGVSp Short | SWISSPROT | BIOTYPE | SIFT | PolyPhen | Tumor Sample Barcode | Tissue | Histology | Sex | Age | Stage | Therapy Types | Drugs | Outcome |
| TMEM59 | SNV | Missense_Mutation | c.545C>A | p.Ser182Tyr | p.S182Y | Q9BXS4 | protein_coding | deleterious(0) | possibly_damaging(0.832) | TCGA-BH-A18G-01 | Breast | breast invasive carcinoma | Female | >=65 | I/II | Unknown | Unknown | SD | |
| TMEM59 | SNV | Missense_Mutation | c.910N>A | p.Glu304Lys | p.E304K | Q9BXS4 | protein_coding | tolerated(0.24) | benign(0.026) | TCGA-C5-A1BK-01 | Cervix | cervical & endocervical cancer | Female | <65 | I/II | Unknown | Unknown | SD | |
| TMEM59 | SNV | Missense_Mutation | c.943A>C | p.Lys315Gln | p.K315Q | Q9BXS4 | protein_coding | deleterious(0) | probably_damaging(0.991) | TCGA-FU-A3HZ-01 | Cervix | cervical & endocervical cancer | Female | <65 | I/II | Chemotherapy | cisplatin | CR | |
| TMEM59 | SNV | Missense_Mutation | rs776175537 | c.272N>A | p.Arg91Gln | p.R91Q | Q9BXS4 | protein_coding | tolerated(0.57) | benign(0.011) | TCGA-CA-6717-01 | Colorectum | colon adenocarcinoma | Male | <65 | I/II | Chemotherapy | oxaliplatin | CR |
| TMEM59 | SNV | Missense_Mutation | c.874C>T | p.Pro292Ser | p.P292S | Q9BXS4 | protein_coding | tolerated(0.21) | possibly_damaging(0.863) | TCGA-CM-6674-01 | Colorectum | colon adenocarcinoma | Male | <65 | I/II | Unknown | Unknown | SD | |
| TMEM59 | SNV | Missense_Mutation | rs776175537 | c.272N>A | p.Arg91Gln | p.R91Q | Q9BXS4 | protein_coding | tolerated(0.57) | benign(0.011) | TCGA-EI-6917-01 | Colorectum | rectum adenocarcinoma | Male | <65 | III/IV | Chemotherapy | 5fluorouracil+oxaciplatina+l-folinian | SD |
| TMEM59 | SNV | Missense_Mutation | novel | c.664C>A | p.Leu222Ile | p.L222I | Q9BXS4 | protein_coding | tolerated(0.32) | benign(0.003) | TCGA-F5-6814-01 | Colorectum | rectum adenocarcinoma | Male | <65 | I/II | Unknown | Unknown | SD |
| TMEM59 | SNV | Missense_Mutation | rs776175537 | c.272G>A | p.Arg91Gln | p.R91Q | Q9BXS4 | protein_coding | tolerated(0.57) | benign(0.011) | TCGA-F5-6814-01 | Colorectum | rectum adenocarcinoma | Male | <65 | I/II | Unknown | Unknown | SD |
| TMEM59 | SNV | Missense_Mutation | novel | c.477N>T | p.Gln159His | p.Q159H | Q9BXS4 | protein_coding | tolerated(0.39) | benign(0.005) | TCGA-A5-A0G2-01 | Endometrium | uterine corpus endometrioid carcinoma | Female | <65 | III/IV | Unknown | Unknown | SD |
| TMEM59 | SNV | Missense_Mutation | c.655N>G | p.Arg219Gly | p.R219G | Q9BXS4 | protein_coding | tolerated(0.06) | benign(0.007) | TCGA-AP-A054-01 | Endometrium | uterine corpus endometrioid carcinoma | Female | <65 | III/IV | Chemotherapy | carboplatin | PD |
| Page: 1 2 3 4 |
Top |
Related drugs of malignant transformation related genes |
| Identification of chemicals and drugs interact with genes involved in malignant transfromation |
| (DGIdb 4.0) |
| Entrez ID | Symbol | Category | Interaction Types | Drug Claim Name | Drug Name | PMIDs |
| Page: 1 |

Copyright 2023-Present -The University of Texas Health Science Center at Houston |