
|
|||||
|
 | |
| |
| |
| |
| |
| |
|
Gene: THOC2 |
Gene summary for THOC2 |
| Gene information | Species | Human | Gene symbol | THOC2 | Gene ID | 57187 |
| Gene name | THO complex 2 | |
| Gene Alias | CXorf3 | |
| Cytomap | Xq25 | |
| Gene Type | protein-coding | GO ID | GO:0006139 | UniProtAcc | Q8NI27 |
Top |
Malignant transformation analysis |
| Identification of the aberrant gene expression in precancerous and cancerous lesions by comparing the gene expression of stem-like cells in diseased tissues with normal stem cells |
| Entrez ID | Symbol | Replicates | Species | Organ | Tissue | Adj P-value | Log2FC | Malignancy |
| 57187 | THOC2 | CA_HPV_3 | Human | Cervix | CC | 4.66e-02 | 9.80e-02 | 0.0414 |
| 57187 | THOC2 | CCI_2 | Human | Cervix | CC | 1.82e-07 | 9.50e-01 | 0.5249 |
| 57187 | THOC2 | Tumor | Human | Cervix | CC | 2.34e-04 | 2.57e-01 | 0.1241 |
| 57187 | THOC2 | sample3 | Human | Cervix | CC | 8.51e-15 | 4.00e-01 | 0.1387 |
| 57187 | THOC2 | T3 | Human | Cervix | CC | 1.36e-12 | 3.79e-01 | 0.1389 |
| 57187 | THOC2 | HTA11_3410_2000001011 | Human | Colorectum | AD | 1.16e-21 | -6.83e-01 | 0.0155 |
| 57187 | THOC2 | HTA11_2487_2000001011 | Human | Colorectum | SER | 4.27e-04 | -4.77e-01 | -0.1808 |
| 57187 | THOC2 | HTA11_3361_2000001011 | Human | Colorectum | AD | 4.47e-06 | -6.03e-01 | -0.1207 |
| 57187 | THOC2 | HTA11_696_2000001011 | Human | Colorectum | AD | 4.75e-06 | -3.95e-01 | -0.1464 |
| 57187 | THOC2 | HTA11_866_2000001011 | Human | Colorectum | AD | 1.31e-10 | -4.36e-01 | -0.1001 |
| 57187 | THOC2 | HTA11_1391_2000001011 | Human | Colorectum | AD | 1.12e-03 | -3.33e-01 | -0.059 |
| 57187 | THOC2 | HTA11_866_3004761011 | Human | Colorectum | AD | 4.64e-11 | -5.45e-01 | 0.096 |
| 57187 | THOC2 | HTA11_10711_2000001011 | Human | Colorectum | AD | 1.20e-05 | -5.32e-01 | 0.0338 |
| 57187 | THOC2 | HTA11_7696_3000711011 | Human | Colorectum | AD | 1.07e-13 | -4.59e-01 | 0.0674 |
| 57187 | THOC2 | HTA11_6818_2000001021 | Human | Colorectum | AD | 8.57e-04 | -5.51e-01 | 0.0588 |
| 57187 | THOC2 | HTA11_99999965104_69814 | Human | Colorectum | MSS | 1.13e-03 | 5.78e-01 | 0.281 |
| 57187 | THOC2 | HTA11_99999974143_84620 | Human | Colorectum | MSS | 3.86e-05 | -3.74e-01 | 0.3005 |
| 57187 | THOC2 | A015-C-203 | Human | Colorectum | FAP | 1.01e-32 | 2.25e-01 | -0.1294 |
| 57187 | THOC2 | A015-C-204 | Human | Colorectum | FAP | 1.39e-04 | 1.22e-01 | -0.0228 |
| 57187 | THOC2 | A014-C-040 | Human | Colorectum | FAP | 1.19e-04 | 2.59e-01 | -0.1184 |
| Page: 1 2 3 4 5 6 7 8 9 10 11 |
| Tissue | Expression Dynamics | Abbreviation |
| Cervix | 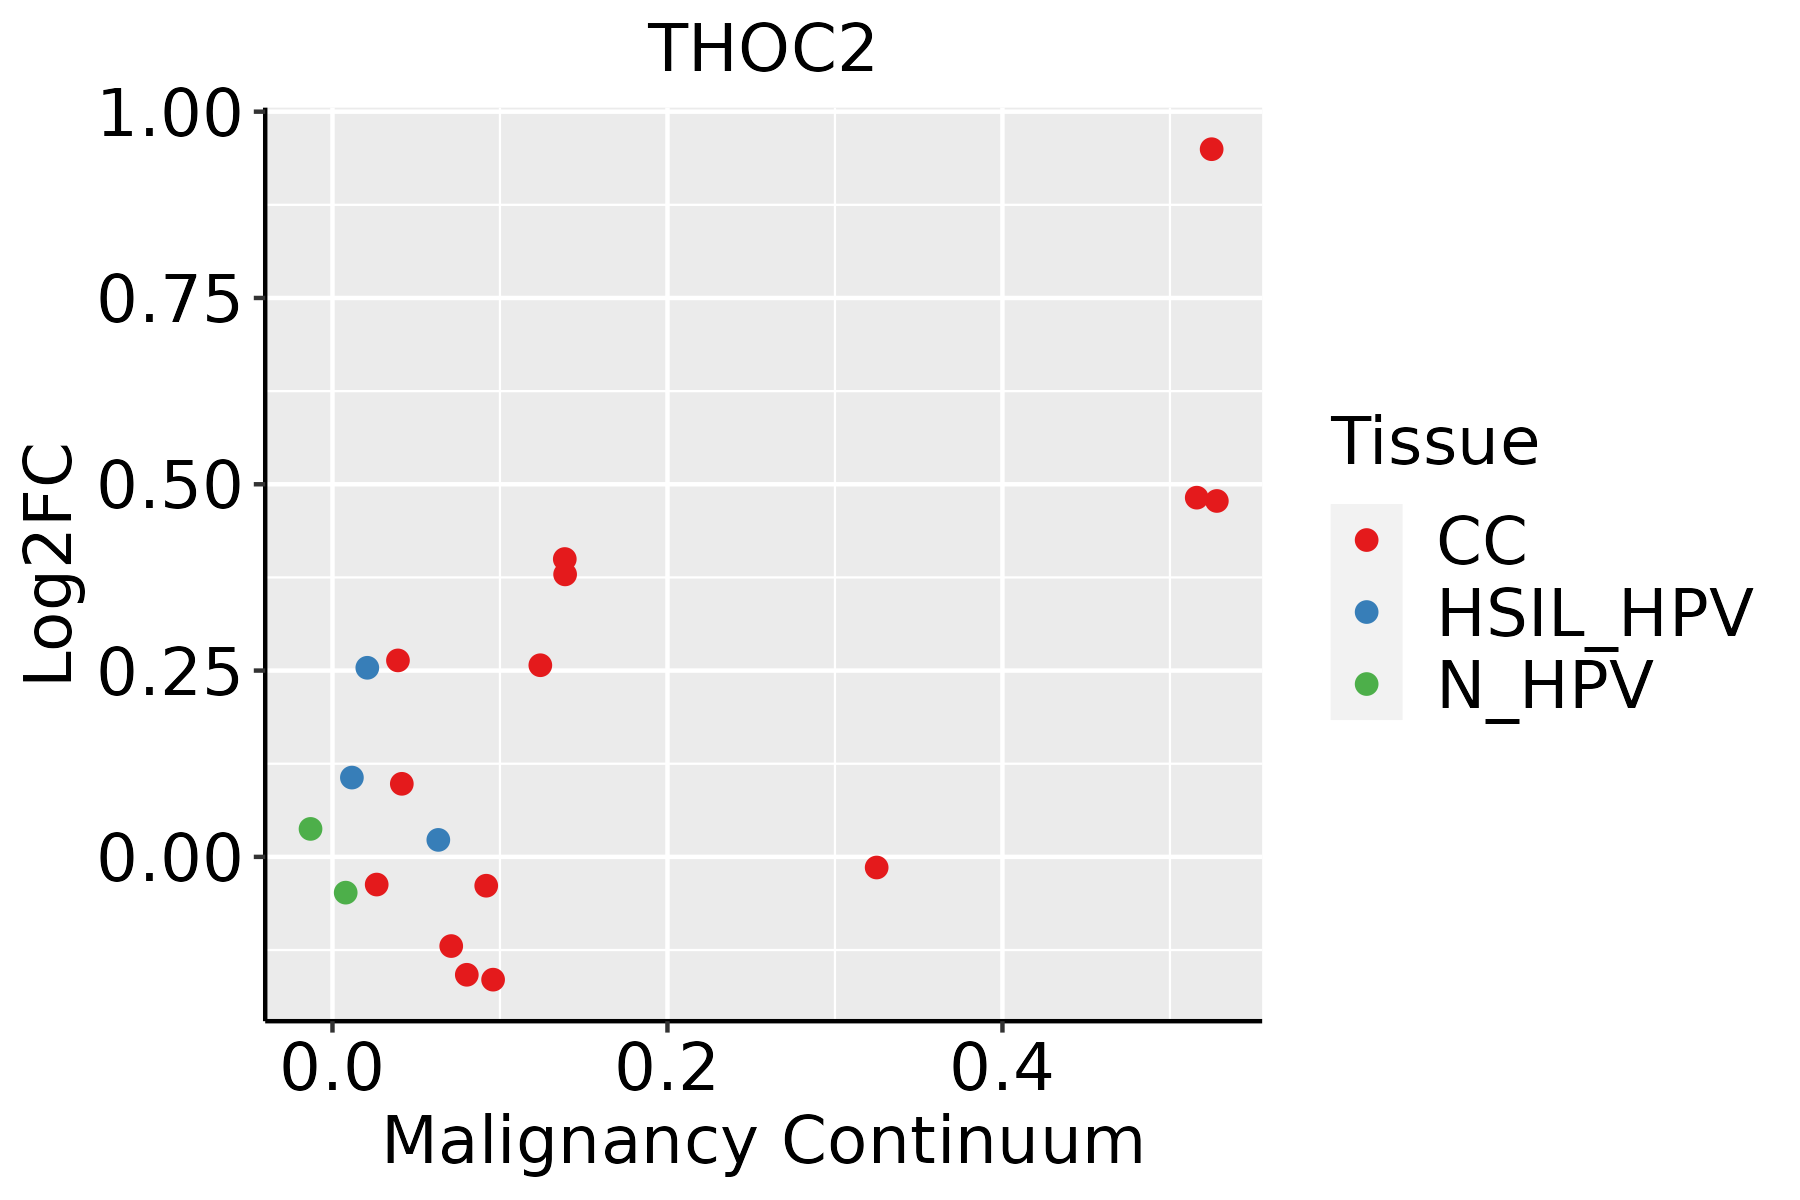 | CC: Cervix cancer |
| HSIL_HPV: HPV-infected high-grade squamous intraepithelial lesions | ||
| N_HPV: HPV-infected normal cervix | ||
| Colorectum (GSE201348) |  | FAP: Familial adenomatous polyposis |
| CRC: Colorectal cancer | ||
| Colorectum (HTA11) |  | AD: Adenomas |
| SER: Sessile serrated lesions | ||
| MSI-H: Microsatellite-high colorectal cancer | ||
| MSS: Microsatellite stable colorectal cancer | ||
| Esophagus | 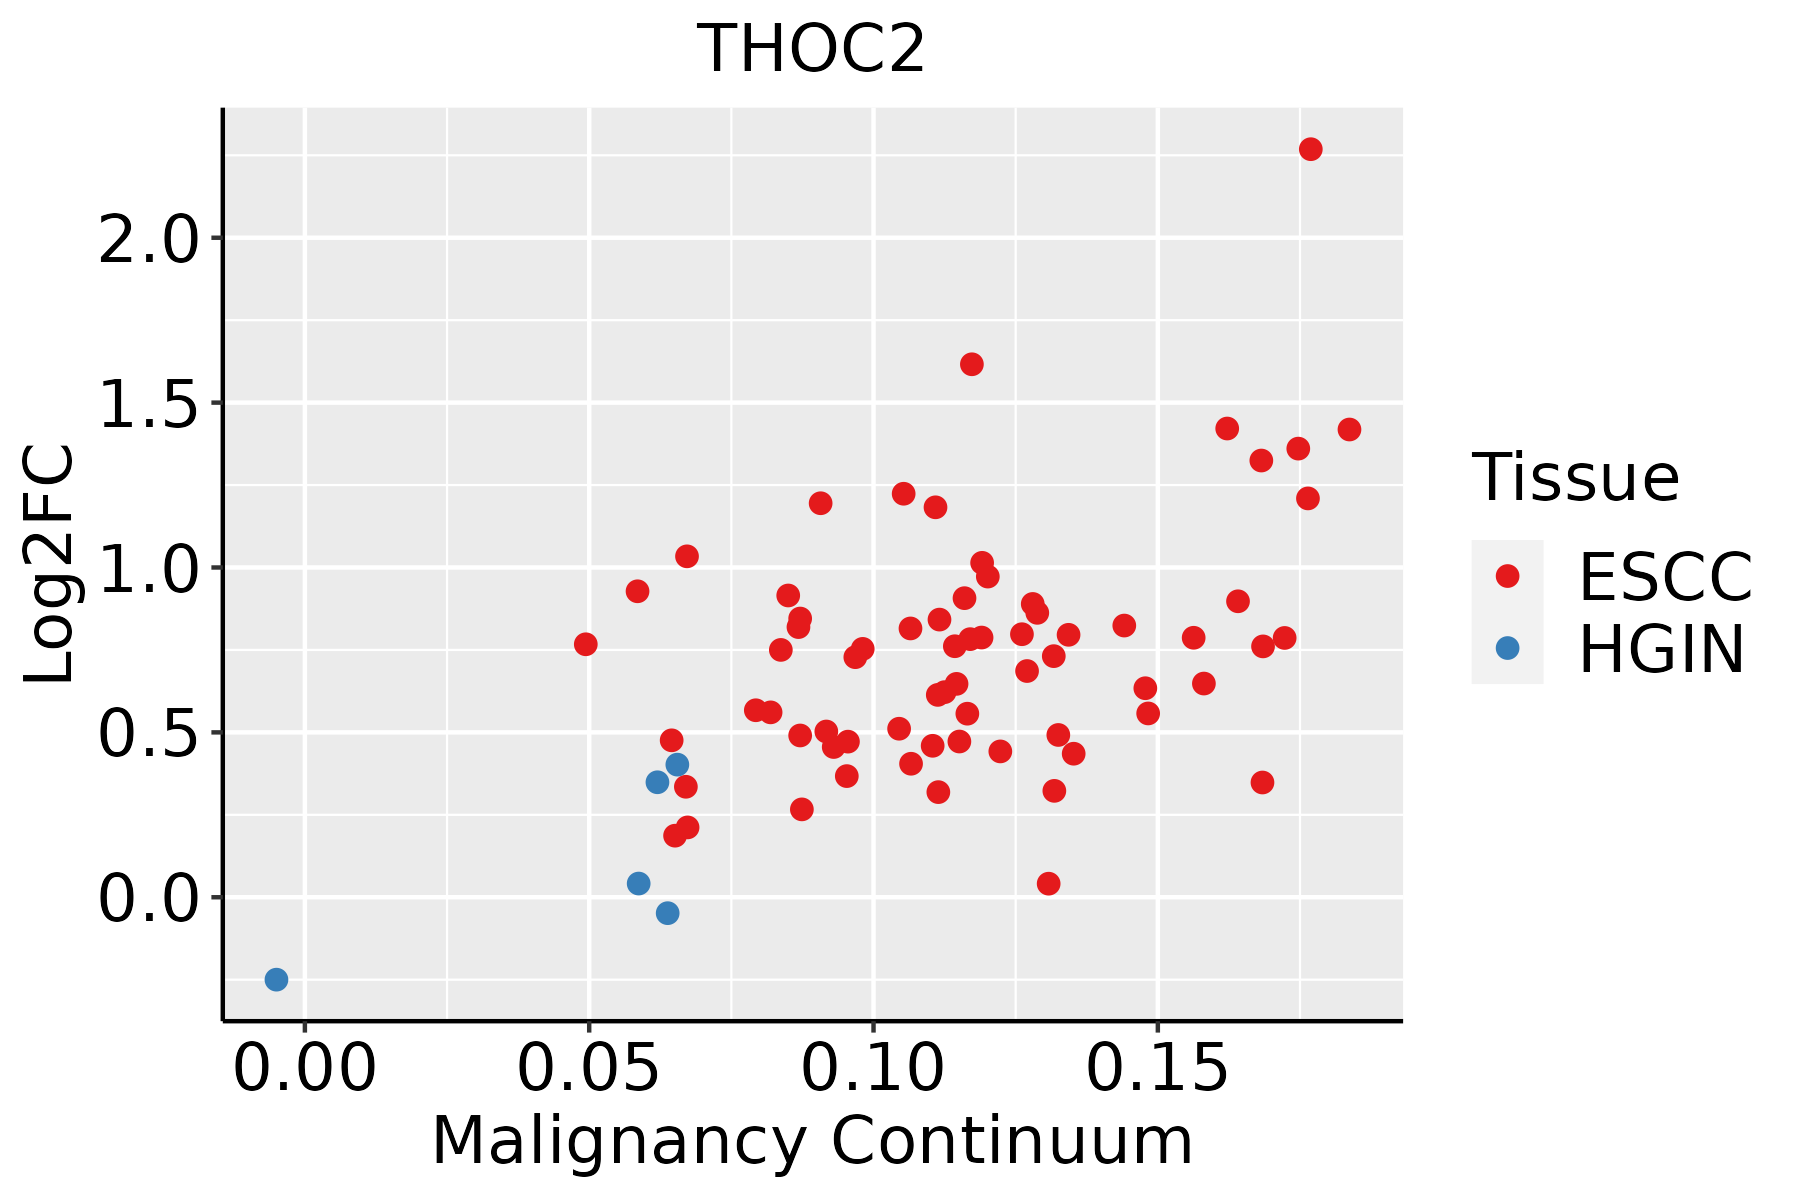 | ESCC: Esophageal squamous cell carcinoma |
| HGIN: High-grade intraepithelial neoplasias | ||
| LGIN: Low-grade intraepithelial neoplasias | ||
| Liver |  | HCC: Hepatocellular carcinoma |
| NAFLD: Non-alcoholic fatty liver disease | ||
| Lung |  | AAH: Atypical adenomatous hyperplasia |
| AIS: Adenocarcinoma in situ | ||
| IAC: Invasive lung adenocarcinoma | ||
| MIA: Minimally invasive adenocarcinoma | ||
| Oral Cavity | 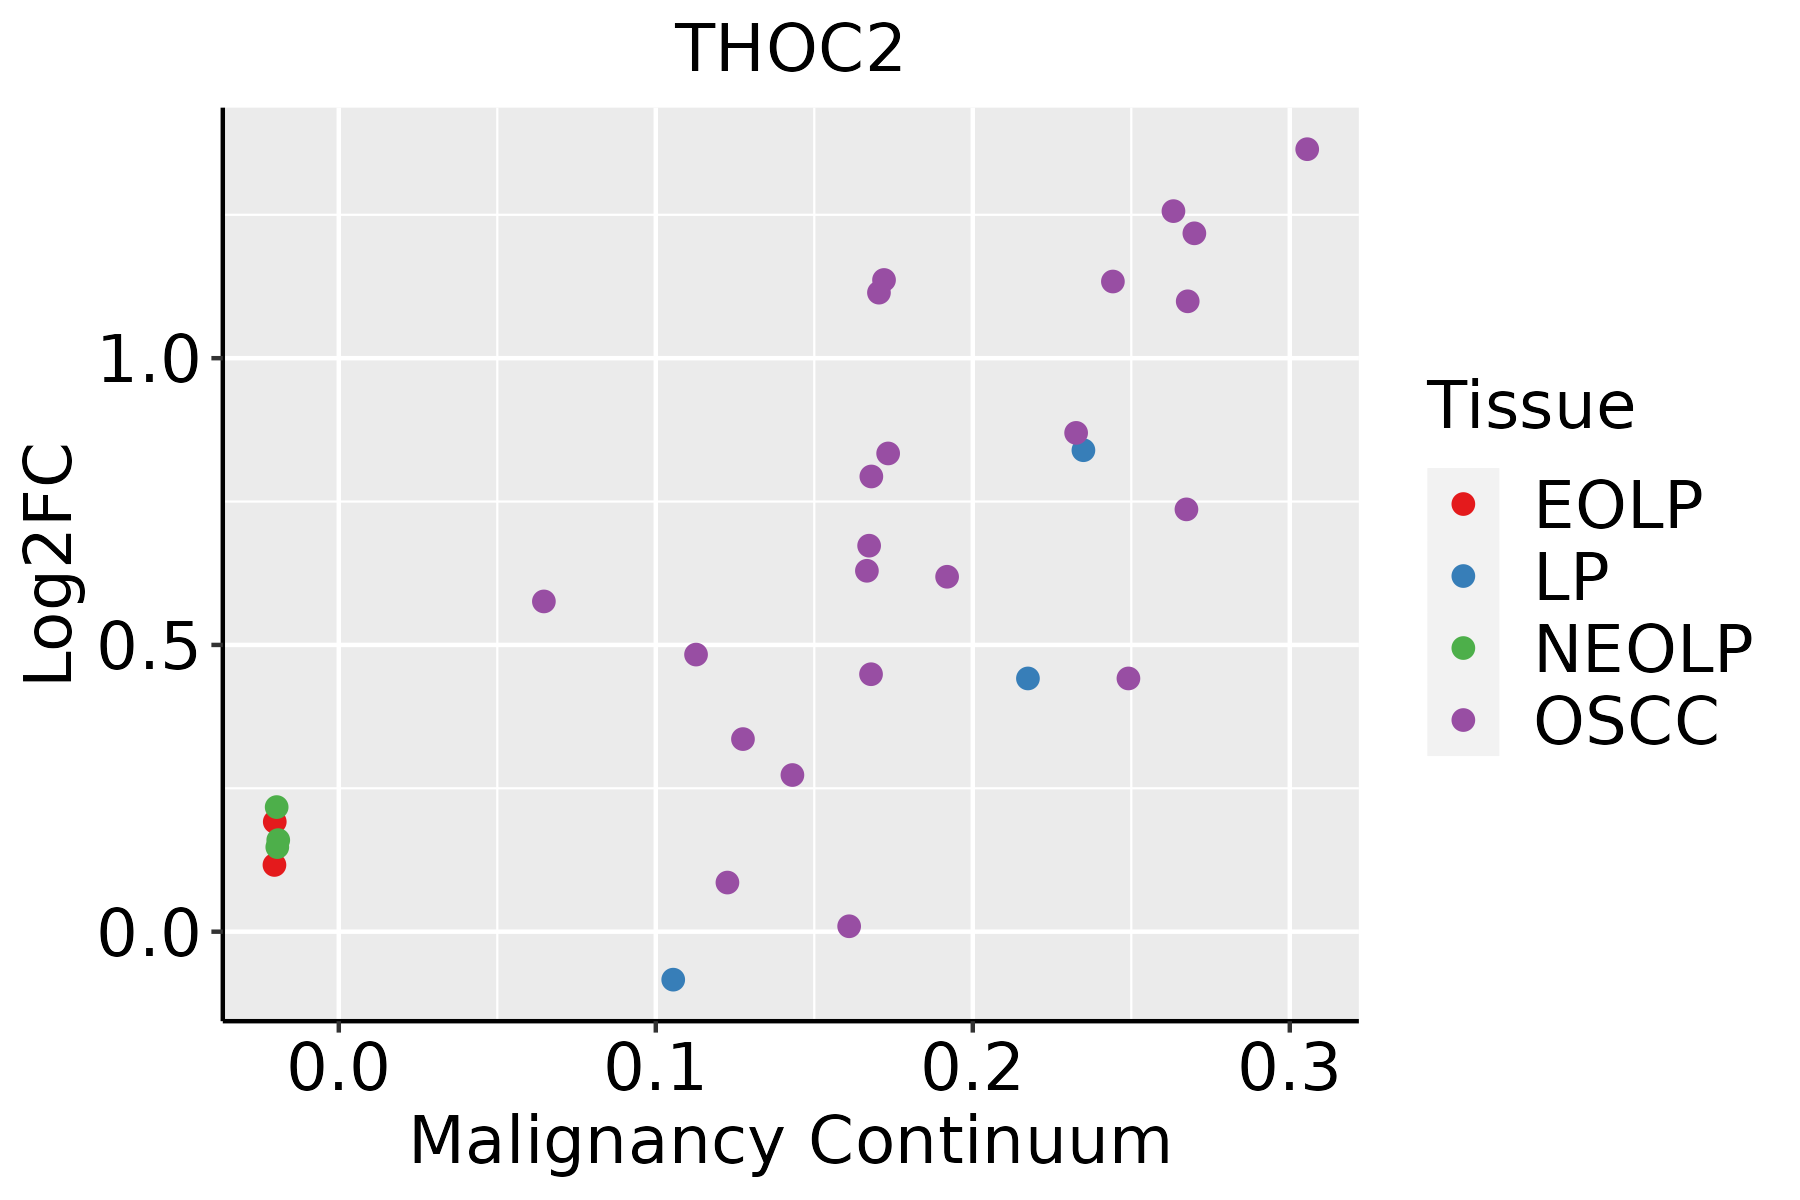 | EOLP: Erosive Oral lichen planus |
| LP: leukoplakia | ||
| NEOLP: Non-erosive oral lichen planus | ||
| OSCC: Oral squamous cell carcinoma | ||
| Prostate | 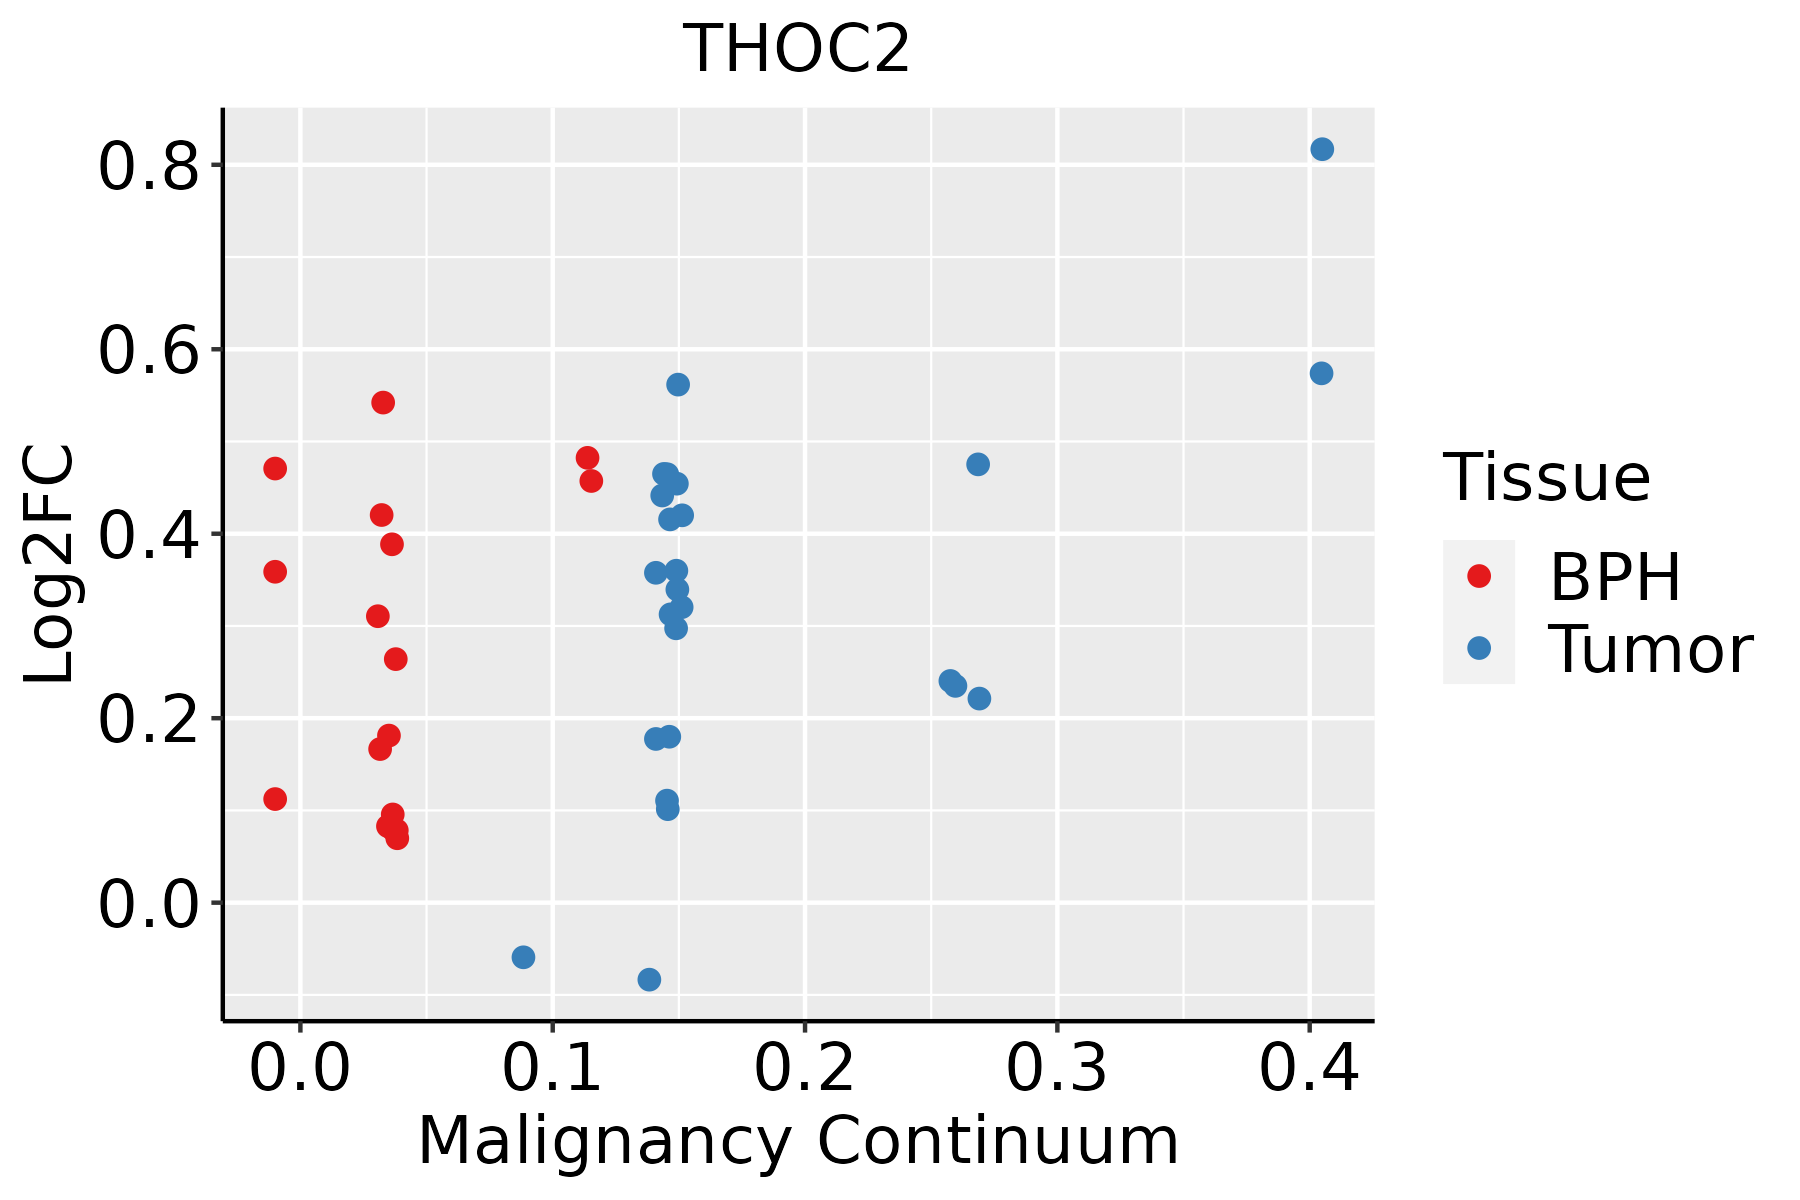 | BPH: Benign Prostatic Hyperplasia |
| Skin |  | AK: Actinic keratosis |
| cSCC: Cutaneous squamous cell carcinoma | ||
| SCCIS:squamous cell carcinoma in situ | ||
| Thyroid | 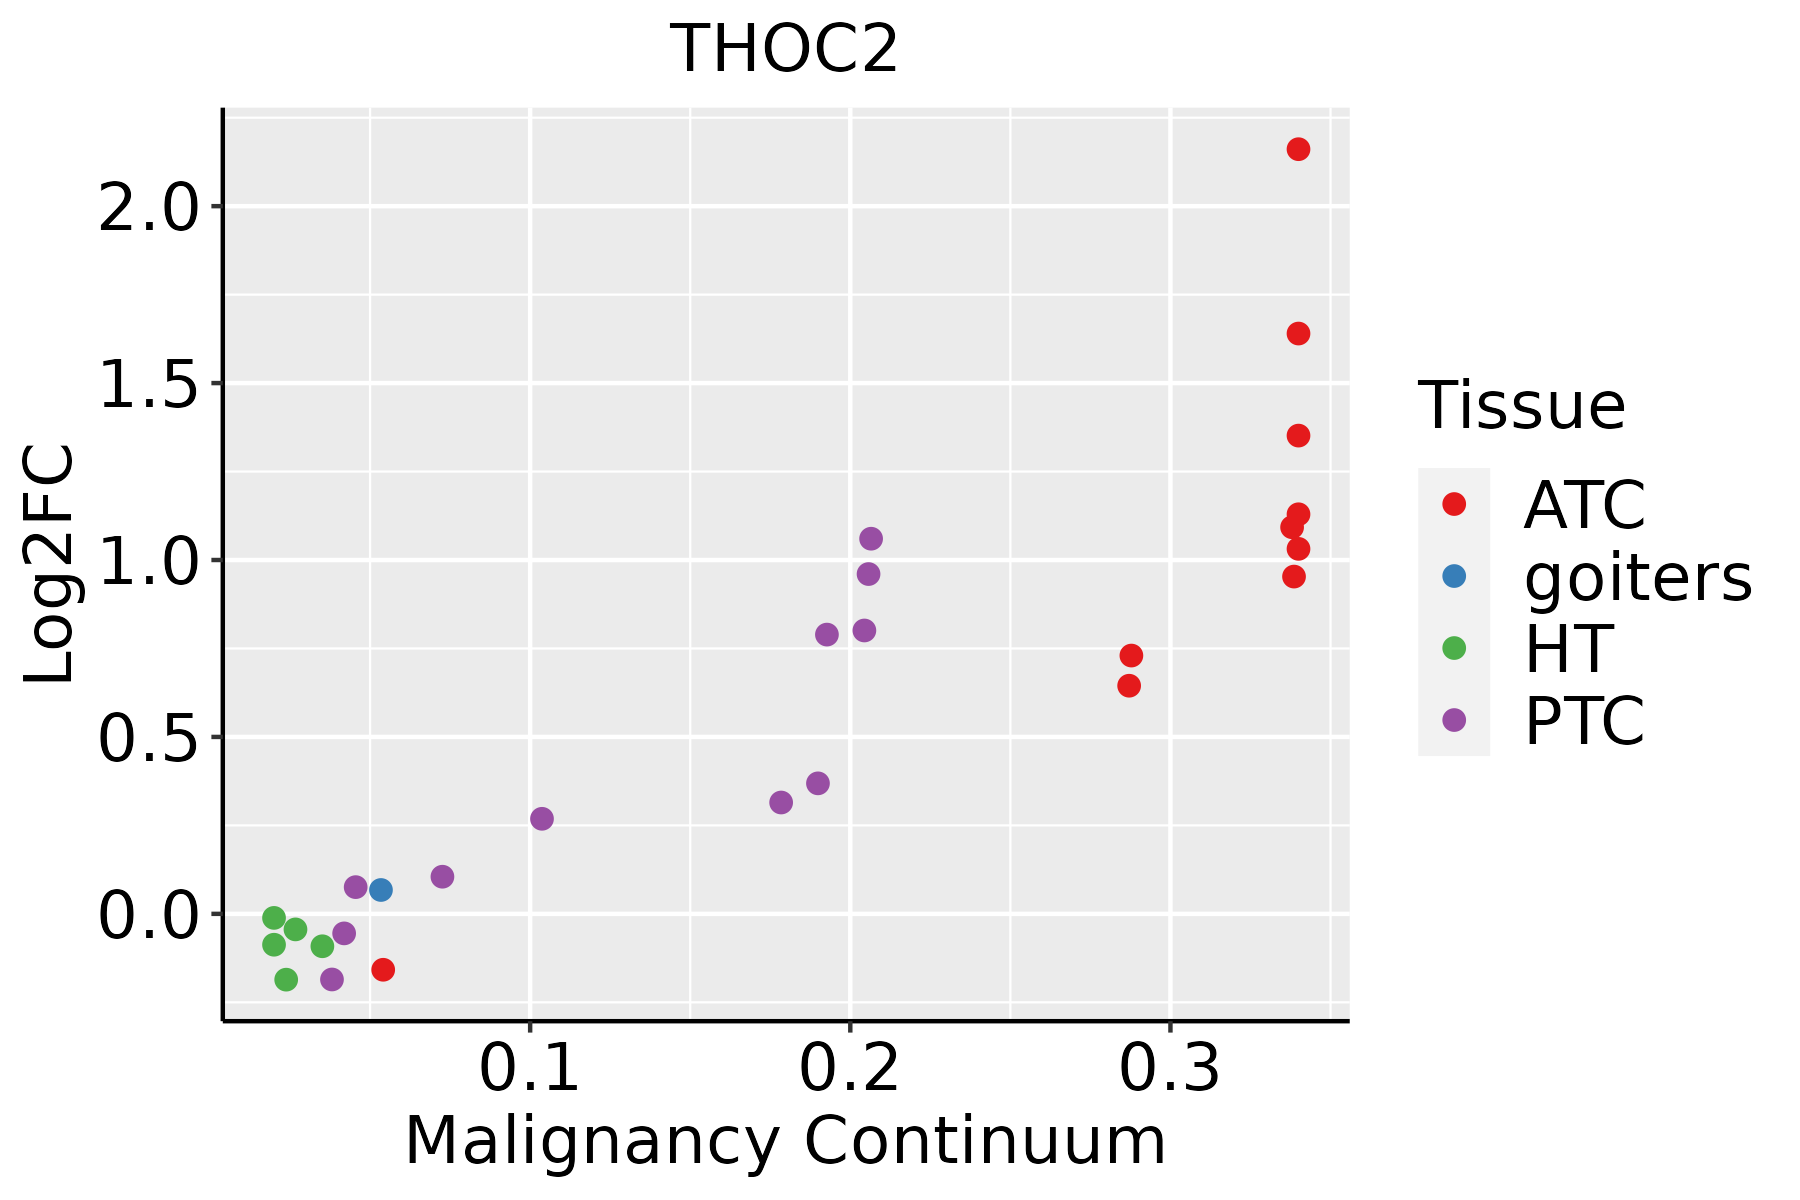 | ATC: Anaplastic thyroid cancer |
| HT: Hashimoto's thyroiditis | ||
| PTC: Papillary thyroid cancer |
| ∗log2FC in expression of this searched gene in stem-like cells from each diseased tissue sample relative to stem-like cells in normal samples in each tissue plotted against the malignancy continuum. Samples are colored based on if they are from different disease stage. |
Top |
Malignant transformation related pathway analysis |
| Find out the enriched GO biological processes and KEGG pathways involved in transition from healthy to precancer to cancer |
| Tissue | Disease Stage | Enriched GO biological Processes |
| Colorectum | AD |  |
| Colorectum | SER |  |
| Colorectum | MSS |  |
| Colorectum | MSI-H |  |
| Colorectum | FAP |  |
| ∗Top 15 enriched GO BP terms are showed in the bar plot of each disease state in each tissue. Each row represents a significant GO biological process which is colored according to the -log10(p.adjust). |
| Page: 1 2 3 4 5 6 7 8 9 |
| GO ID | Tissue | Disease Stage | Description | Gene Ratio | Bg Ratio | pvalue | p.adjust | Count |
| GO:005123613 | Prostate | Tumor | establishment of RNA localization | 52/3246 | 166/18723 | 7.11e-06 | 1.07e-04 | 52 |
| GO:005065713 | Prostate | Tumor | nucleic acid transport | 51/3246 | 163/18723 | 8.99e-06 | 1.32e-04 | 51 |
| GO:005065813 | Prostate | Tumor | RNA transport | 51/3246 | 163/18723 | 8.99e-06 | 1.32e-04 | 51 |
| GO:005116816 | Prostate | Tumor | nuclear export | 48/3246 | 154/18723 | 1.82e-05 | 2.41e-04 | 48 |
| GO:003150312 | Prostate | Tumor | protein-containing complex localization | 59/3246 | 220/18723 | 2.71e-04 | 2.24e-03 | 59 |
| GO:001593113 | Prostate | Tumor | nucleobase-containing compound transport | 59/3246 | 222/18723 | 3.49e-04 | 2.75e-03 | 59 |
| GO:005102813 | Prostate | Tumor | mRNA transport | 38/3246 | 130/18723 | 5.44e-04 | 3.96e-03 | 38 |
| GO:003134512 | Prostate | Tumor | negative regulation of cell projection organization | 47/3246 | 186/18723 | 3.91e-03 | 1.99e-02 | 47 |
| GO:001097711 | Prostate | Tumor | negative regulation of neuron projection development | 36/3246 | 137/18723 | 5.51e-03 | 2.61e-02 | 36 |
| GO:000838027 | Skin | AK | RNA splicing | 111/1910 | 434/18723 | 1.85e-20 | 5.49e-17 | 111 |
| GO:000691320 | Skin | AK | nucleocytoplasmic transport | 69/1910 | 301/18723 | 7.63e-11 | 1.29e-08 | 69 |
| GO:005116920 | Skin | AK | nuclear transport | 69/1910 | 301/18723 | 7.63e-11 | 1.29e-08 | 69 |
| GO:004440327 | Skin | AK | biological process involved in symbiotic interaction | 64/1910 | 290/18723 | 1.90e-09 | 1.76e-07 | 64 |
| GO:005116820 | Skin | AK | nuclear export | 39/1910 | 154/18723 | 6.00e-08 | 2.99e-06 | 39 |
| GO:005170128 | Skin | AK | biological process involved in interaction with host | 46/1910 | 203/18723 | 1.54e-07 | 6.60e-06 | 46 |
| GO:001097517 | Skin | AK | regulation of neuron projection development | 79/1910 | 445/18723 | 6.49e-07 | 2.23e-05 | 79 |
| GO:000640324 | Skin | AK | RNA localization | 42/1910 | 201/18723 | 4.88e-06 | 1.16e-04 | 42 |
| GO:005065718 | Skin | AK | nucleic acid transport | 32/1910 | 163/18723 | 2.14e-04 | 2.39e-03 | 32 |
| GO:005065818 | Skin | AK | RNA transport | 32/1910 | 163/18723 | 2.14e-04 | 2.39e-03 | 32 |
| GO:005123618 | Skin | AK | establishment of RNA localization | 32/1910 | 166/18723 | 3.02e-04 | 3.12e-03 | 32 |
| Page: 1 2 3 4 5 6 7 8 9 10 11 12 13 14 15 16 17 18 19 |
| Pathway ID | Tissue | Disease Stage | Description | Gene Ratio | Bg Ratio | pvalue | p.adjust | qvalue | Count |
| hsa03040 | Colorectum | AD | Spliceosome | 73/2092 | 217/8465 | 1.73e-03 | 9.68e-03 | 6.18e-03 | 73 |
| hsa030401 | Colorectum | AD | Spliceosome | 73/2092 | 217/8465 | 1.73e-03 | 9.68e-03 | 6.18e-03 | 73 |
| hsa030402 | Colorectum | MSS | Spliceosome | 66/1875 | 217/8465 | 2.58e-03 | 1.27e-02 | 7.81e-03 | 66 |
| hsa030403 | Colorectum | MSS | Spliceosome | 66/1875 | 217/8465 | 2.58e-03 | 1.27e-02 | 7.81e-03 | 66 |
| hsa0301321 | Esophagus | ESCC | Nucleocytoplasmic transport | 89/4205 | 108/8465 | 1.20e-12 | 2.37e-11 | 1.21e-11 | 89 |
| hsa0304027 | Esophagus | ESCC | Spliceosome | 128/4205 | 217/8465 | 3.31e-03 | 8.79e-03 | 4.50e-03 | 128 |
| hsa0301331 | Esophagus | ESCC | Nucleocytoplasmic transport | 89/4205 | 108/8465 | 1.20e-12 | 2.37e-11 | 1.21e-11 | 89 |
| hsa0304037 | Esophagus | ESCC | Spliceosome | 128/4205 | 217/8465 | 3.31e-03 | 8.79e-03 | 4.50e-03 | 128 |
| hsa030407 | Liver | Cirrhotic | Spliceosome | 102/2530 | 217/8465 | 5.69e-08 | 9.47e-07 | 5.84e-07 | 102 |
| hsa0304012 | Liver | Cirrhotic | Spliceosome | 102/2530 | 217/8465 | 5.69e-08 | 9.47e-07 | 5.84e-07 | 102 |
| hsa03013 | Liver | HCC | Nucleocytoplasmic transport | 81/4020 | 108/8465 | 4.28e-09 | 6.83e-08 | 3.80e-08 | 81 |
| hsa0304022 | Liver | HCC | Spliceosome | 122/4020 | 217/8465 | 5.55e-03 | 1.60e-02 | 8.91e-03 | 122 |
| hsa030131 | Liver | HCC | Nucleocytoplasmic transport | 81/4020 | 108/8465 | 4.28e-09 | 6.83e-08 | 3.80e-08 | 81 |
| hsa0304032 | Liver | HCC | Spliceosome | 122/4020 | 217/8465 | 5.55e-03 | 1.60e-02 | 8.91e-03 | 122 |
| hsa030136 | Oral cavity | OSCC | Nucleocytoplasmic transport | 82/3704 | 108/8465 | 7.93e-12 | 1.33e-10 | 6.77e-11 | 82 |
| hsa0304016 | Oral cavity | OSCC | Spliceosome | 123/3704 | 217/8465 | 7.21e-05 | 2.74e-04 | 1.40e-04 | 123 |
| hsa0301311 | Oral cavity | OSCC | Nucleocytoplasmic transport | 82/3704 | 108/8465 | 7.93e-12 | 1.33e-10 | 6.77e-11 | 82 |
| hsa0304017 | Oral cavity | OSCC | Spliceosome | 123/3704 | 217/8465 | 7.21e-05 | 2.74e-04 | 1.40e-04 | 123 |
| hsa030132 | Oral cavity | LP | Nucleocytoplasmic transport | 53/2418 | 108/8465 | 4.68e-06 | 4.10e-05 | 2.64e-05 | 53 |
| hsa030133 | Oral cavity | LP | Nucleocytoplasmic transport | 53/2418 | 108/8465 | 4.68e-06 | 4.10e-05 | 2.64e-05 | 53 |
| Page: 1 2 |
Top |
Cell-cell communication analysis |
| Identification of potential cell-cell interactions between two cell types and their ligand-receptor pairs for different disease states |
| Ligand | Receptor | LRpair | Pathway | Tissue | Disease Stage |
| Page: 1 |
Top |
Single-cell gene regulatory network inference analysis |
| Find out the significant the regulons (TFs) and the target genes of each regulon across cell types for different disease states |
| TF | Cell Type | Tissue | Disease Stage | Target Gene | RSS | Regulon Activity |
| THOC2 | MYOFIB | Breast | Healthy | ANKFY1,CNN3,XIST, etc. | 1.70e-01 |  |
| THOC2 | MSC.ADIPO | Breast | Healthy | ANKFY1,CNN3,XIST, etc. | 1.97e-01 | |
| THOC2 | FIB | Breast | IDC | ANKFY1,CNN3,XIST, etc. | 2.80e-01 |  |
| THOC2 | NK | Stomach | CAG | WARS,MIR24-2,LIMS1, etc. | 2.78e-02 |  |
| THOC2 | MAIT | Stomach | Healthy | WARS,MIR24-2,LIMS1, etc. | 9.75e-03 |  |
| THOC2 | MON | Stomach | SIM | WARS,MIR24-2,LIMS1, etc. | 2.33e-02 |  |
| ∗The dot plots of a searched regulon are shown for all cell subpopulations in each disease state of each tissue based on the regulon specific score inferred using pySCENIC and by calculating the average expression. |
| Page: 1 |
Top |
Somatic mutation of malignant transformation related genes |
| Annotation of somatic variants for genes involved in malignant transformation |
| Hugo Symbol | Variant Class | Variant Classification | dbSNP RS | HGVSc | HGVSp | HGVSp Short | SWISSPROT | BIOTYPE | SIFT | PolyPhen | Tumor Sample Barcode | Tissue | Histology | Sex | Age | Stage | Therapy Types | Drugs | Outcome |
| THOC2 | SNV | Missense_Mutation | novel | c.2770N>C | p.Lys924Gln | p.K924Q | Q8NI27 | protein_coding | tolerated(0.17) | probably_damaging(0.954) | TCGA-AC-A3QQ-01 | Breast | breast invasive carcinoma | Female | <65 | I/II | Unknown | Unknown | SD |
| THOC2 | SNV | Missense_Mutation | c.2768N>T | p.Lys923Ile | p.K923I | Q8NI27 | protein_coding | deleterious(0) | probably_damaging(0.999) | TCGA-AC-A3QQ-01 | Breast | breast invasive carcinoma | Female | <65 | I/II | Unknown | Unknown | SD | |
| THOC2 | SNV | Missense_Mutation | novel | c.3215C>T | p.Thr1072Ile | p.T1072I | Q8NI27 | protein_coding | deleterious(0) | probably_damaging(0.978) | TCGA-AN-A046-01 | Breast | breast invasive carcinoma | Female | >=65 | I/II | Unknown | Unknown | SD |
| THOC2 | SNV | Missense_Mutation | c.1848N>G | p.Ile616Met | p.I616M | Q8NI27 | protein_coding | deleterious(0) | probably_damaging(0.992) | TCGA-BH-A18P-01 | Breast | breast invasive carcinoma | Female | <65 | I/II | Unknown | Unknown | PD | |
| THOC2 | SNV | Missense_Mutation | c.101A>T | p.Asn34Ile | p.N34I | Q8NI27 | protein_coding | deleterious(0.03) | benign(0.04) | TCGA-C8-A12V-01 | Breast | breast invasive carcinoma | Female | <65 | I/II | Unknown | Unknown | SD | |
| THOC2 | SNV | Missense_Mutation | novel | c.4204N>A | p.Glu1402Lys | p.E1402K | Q8NI27 | protein_coding | deleterious(0.02) | benign(0.197) | TCGA-C8-A12Y-01 | Breast | breast invasive carcinoma | Female | <65 | I/II | Unknown | Unknown | SD |
| THOC2 | SNV | Missense_Mutation | novel | c.3124N>G | p.Phe1042Val | p.F1042V | Q8NI27 | protein_coding | deleterious(0) | probably_damaging(0.998) | TCGA-D8-A1X7-01 | Breast | breast invasive carcinoma | Female | <65 | I/II | ChemotherapyHormone Therapy | doxorubicine+cyclophosphamide+tamoxifen | SD |
| THOC2 | SNV | Missense_Mutation | c.4234N>T | p.Ile1412Phe | p.I1412F | Q8NI27 | protein_coding | deleterious(0.04) | benign(0.05) | TCGA-E2-A1LA-01 | Breast | breast invasive carcinoma | Female | <65 | I/II | Hormone Therapy | arimidex | SD | |
| THOC2 | SNV | Missense_Mutation | c.215A>T | p.Asp72Val | p.D72V | Q8NI27 | protein_coding | deleterious(0) | benign(0.035) | TCGA-E9-A1R0-01 | Breast | breast invasive carcinoma | Female | <65 | I/II | Chemotherapy | cyclophosphamide | SD | |
| THOC2 | SNV | Missense_Mutation | novel | c.2228N>T | p.Cys743Phe | p.C743F | Q8NI27 | protein_coding | deleterious(0) | benign(0.175) | TCGA-GM-A3NY-01 | Breast | breast invasive carcinoma | Female | >=65 | I/II | Hormone Therapy | arimidex | SD |
| Page: 1 2 3 4 5 6 7 8 9 10 11 12 13 14 15 16 17 18 19 20 21 22 23 24 25 26 |
Top |
Related drugs of malignant transformation related genes |
| Identification of chemicals and drugs interact with genes involved in malignant transfromation |
| (DGIdb 4.0) |
| Entrez ID | Symbol | Category | Interaction Types | Drug Claim Name | Drug Name | PMIDs |
| Page: 1 |

Copyright 2023-Present -The University of Texas Health Science Center at Houston |