| Tissue | Expression Dynamics | Abbreviation |
| Cervix | 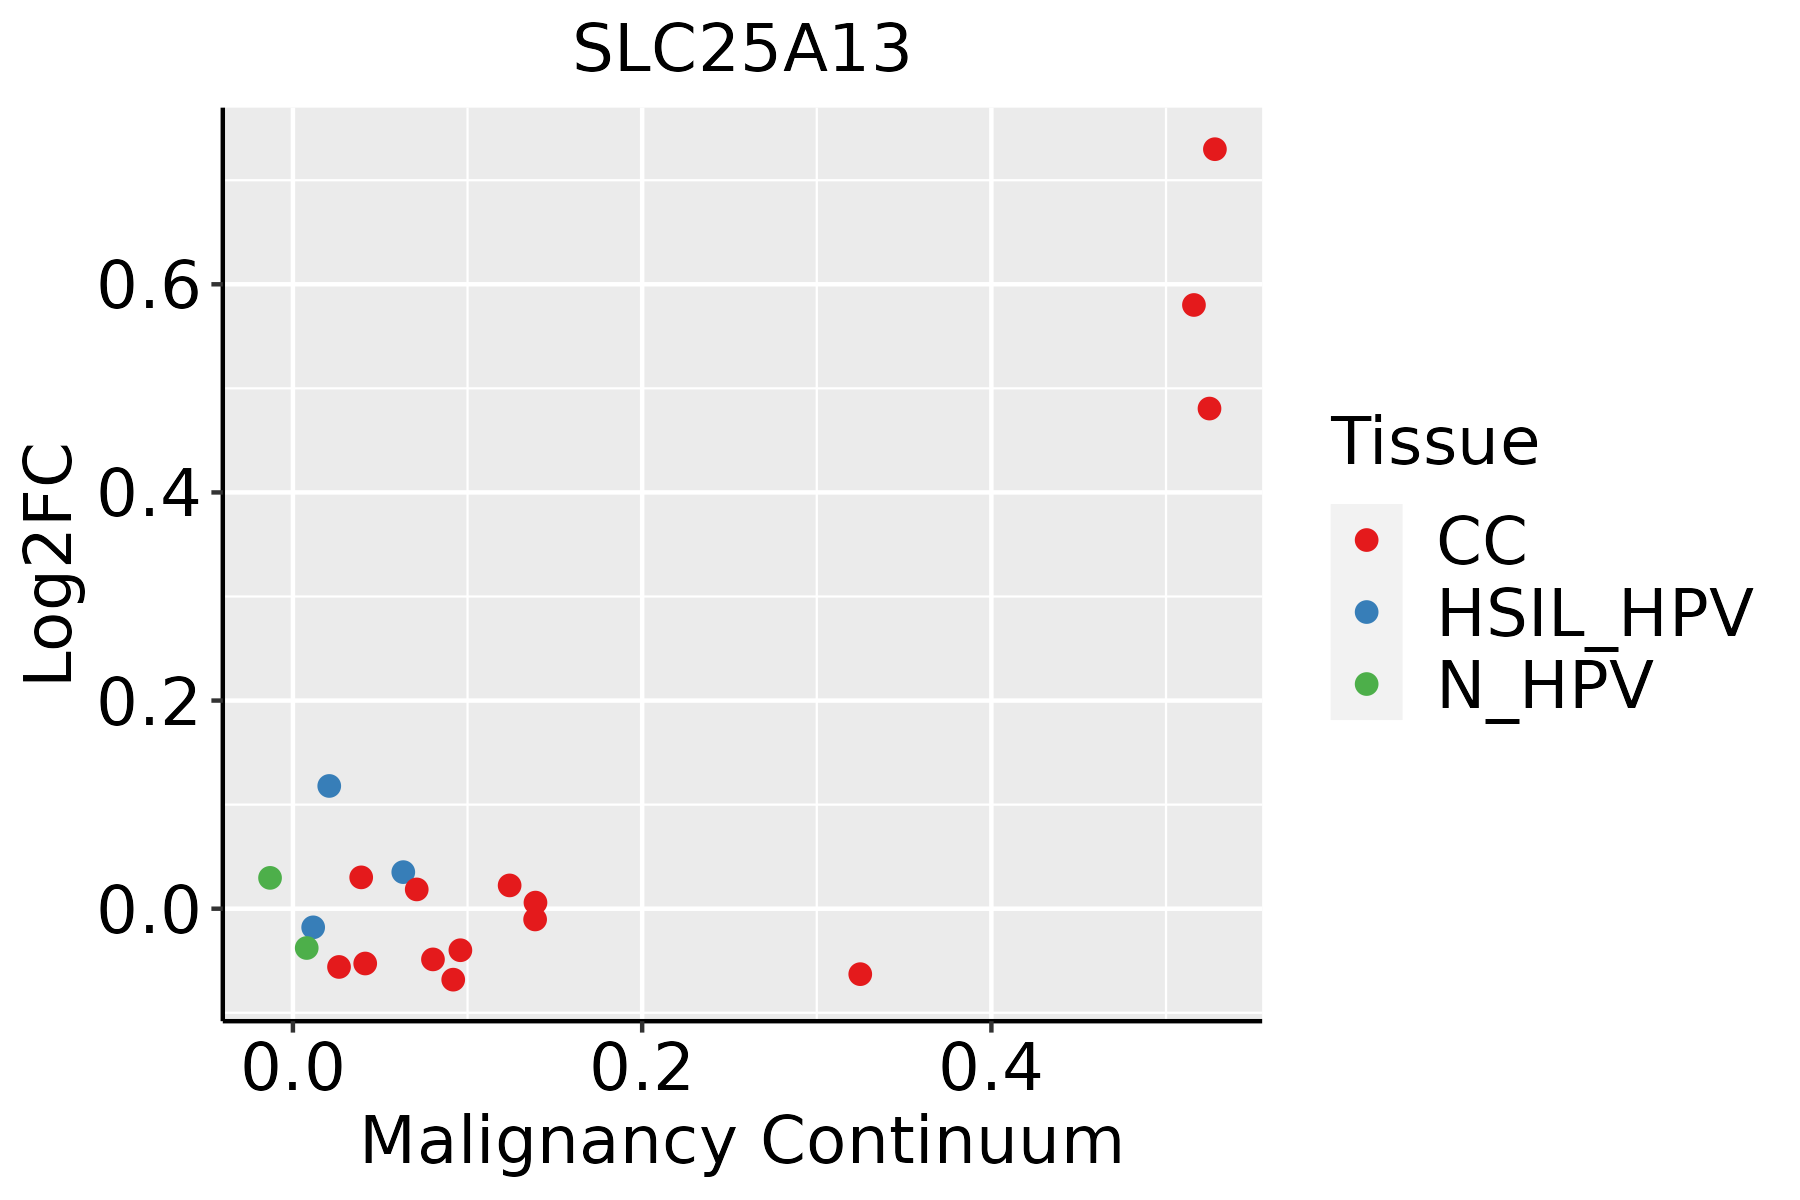 | CC: Cervix cancer |
| HSIL_HPV: HPV-infected high-grade squamous intraepithelial lesions |
| N_HPV: HPV-infected normal cervix |
| Colorectum (GSE201348) |  | FAP: Familial adenomatous polyposis |
| CRC: Colorectal cancer |
| Colorectum (HTA11) |  | AD: Adenomas |
| SER: Sessile serrated lesions |
| MSI-H: Microsatellite-high colorectal cancer |
| MSS: Microsatellite stable colorectal cancer |
| Endometrium | 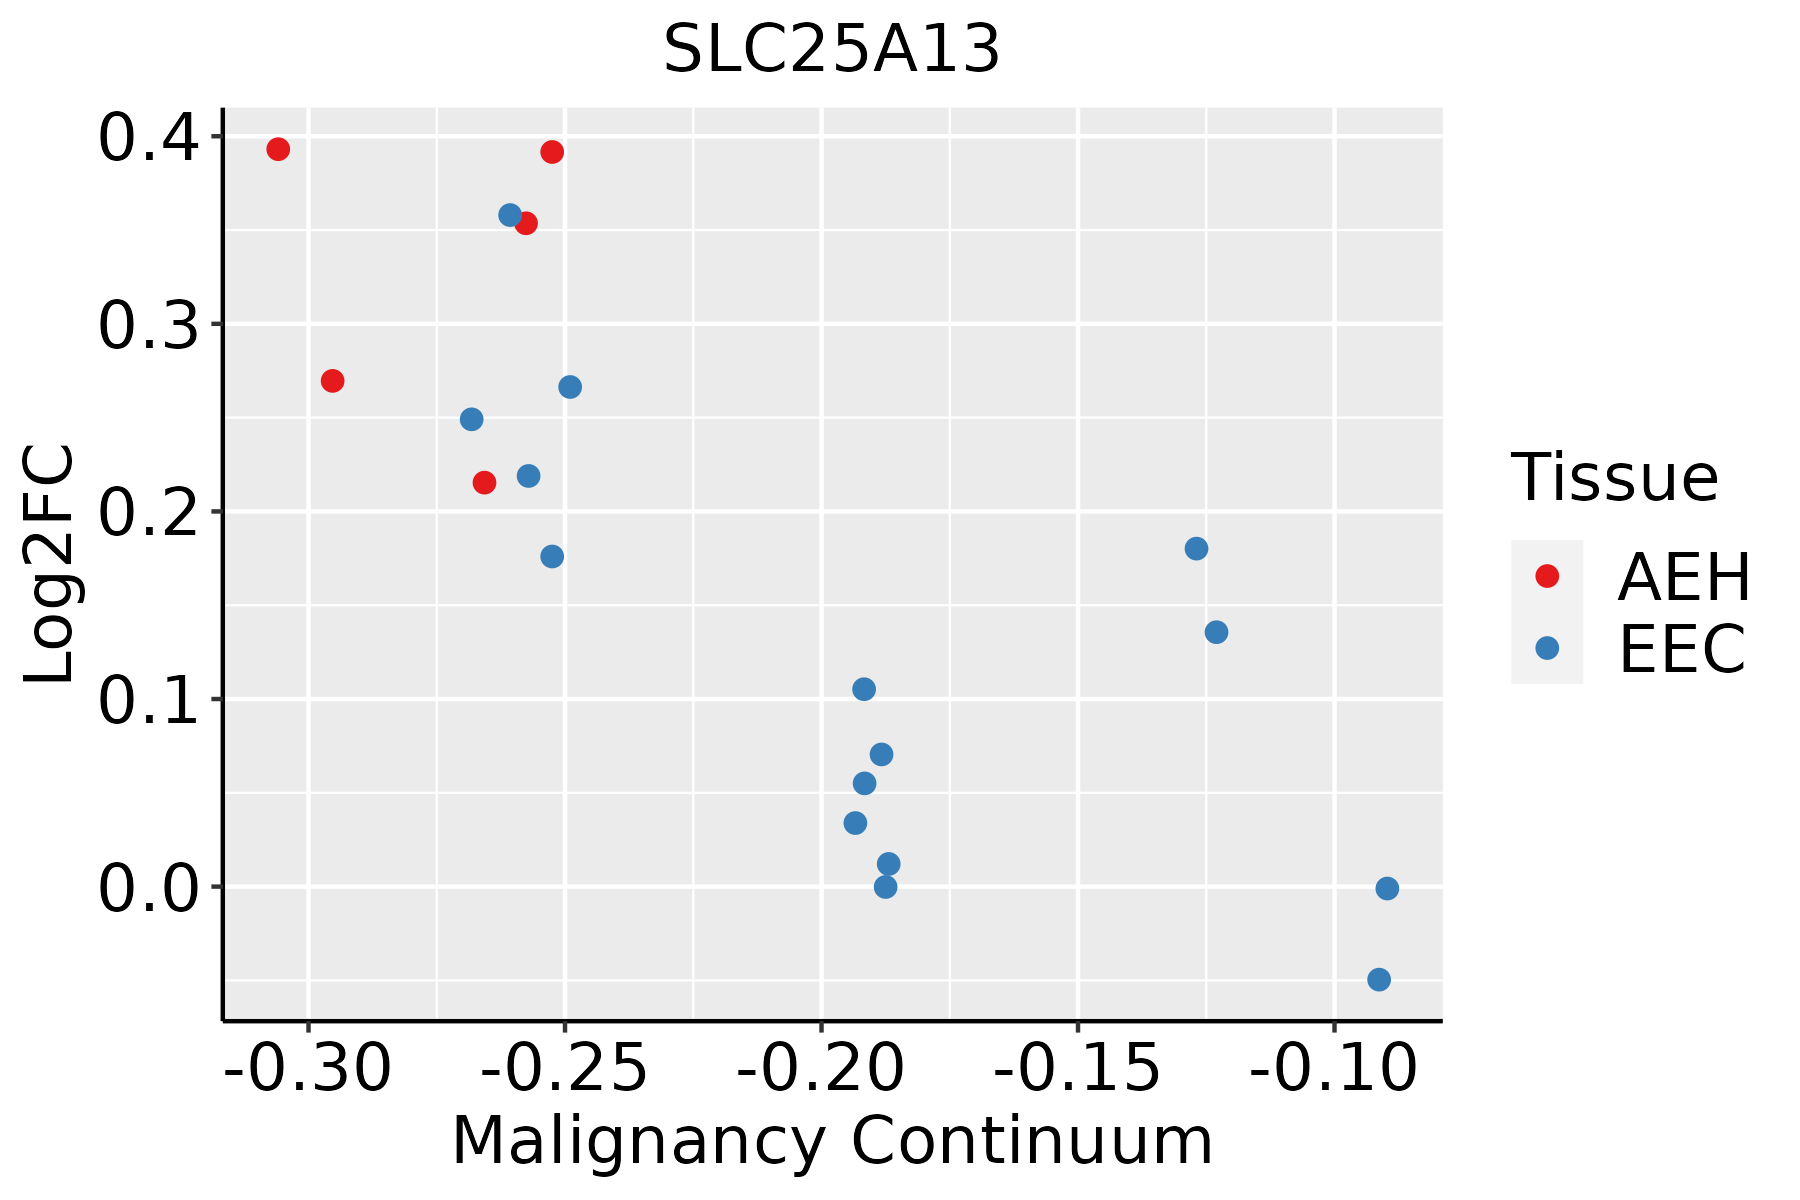 | AEH: Atypical endometrial hyperplasia |
| EEC: Endometrioid Cancer |
| Esophagus | 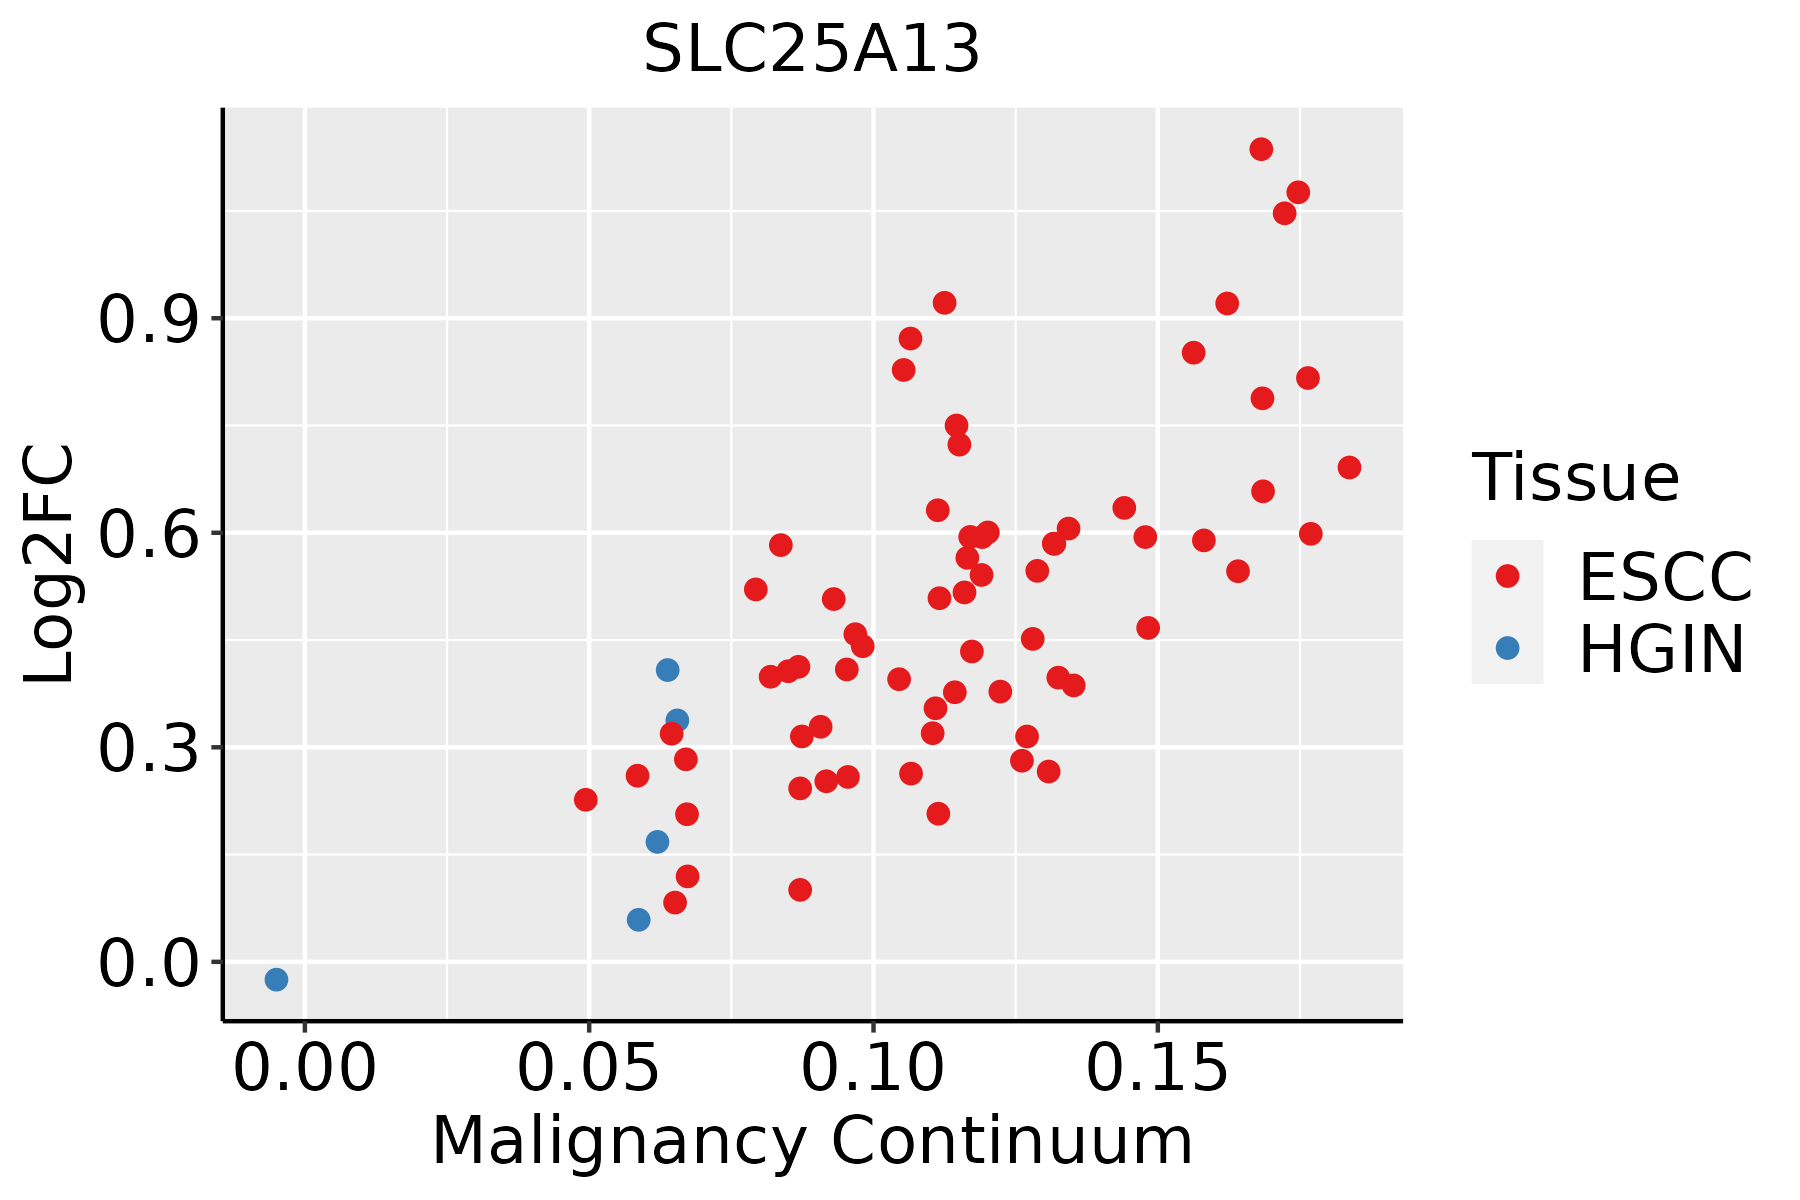 | ESCC: Esophageal squamous cell carcinoma |
| HGIN: High-grade intraepithelial neoplasias |
| LGIN: Low-grade intraepithelial neoplasias |
| Liver | 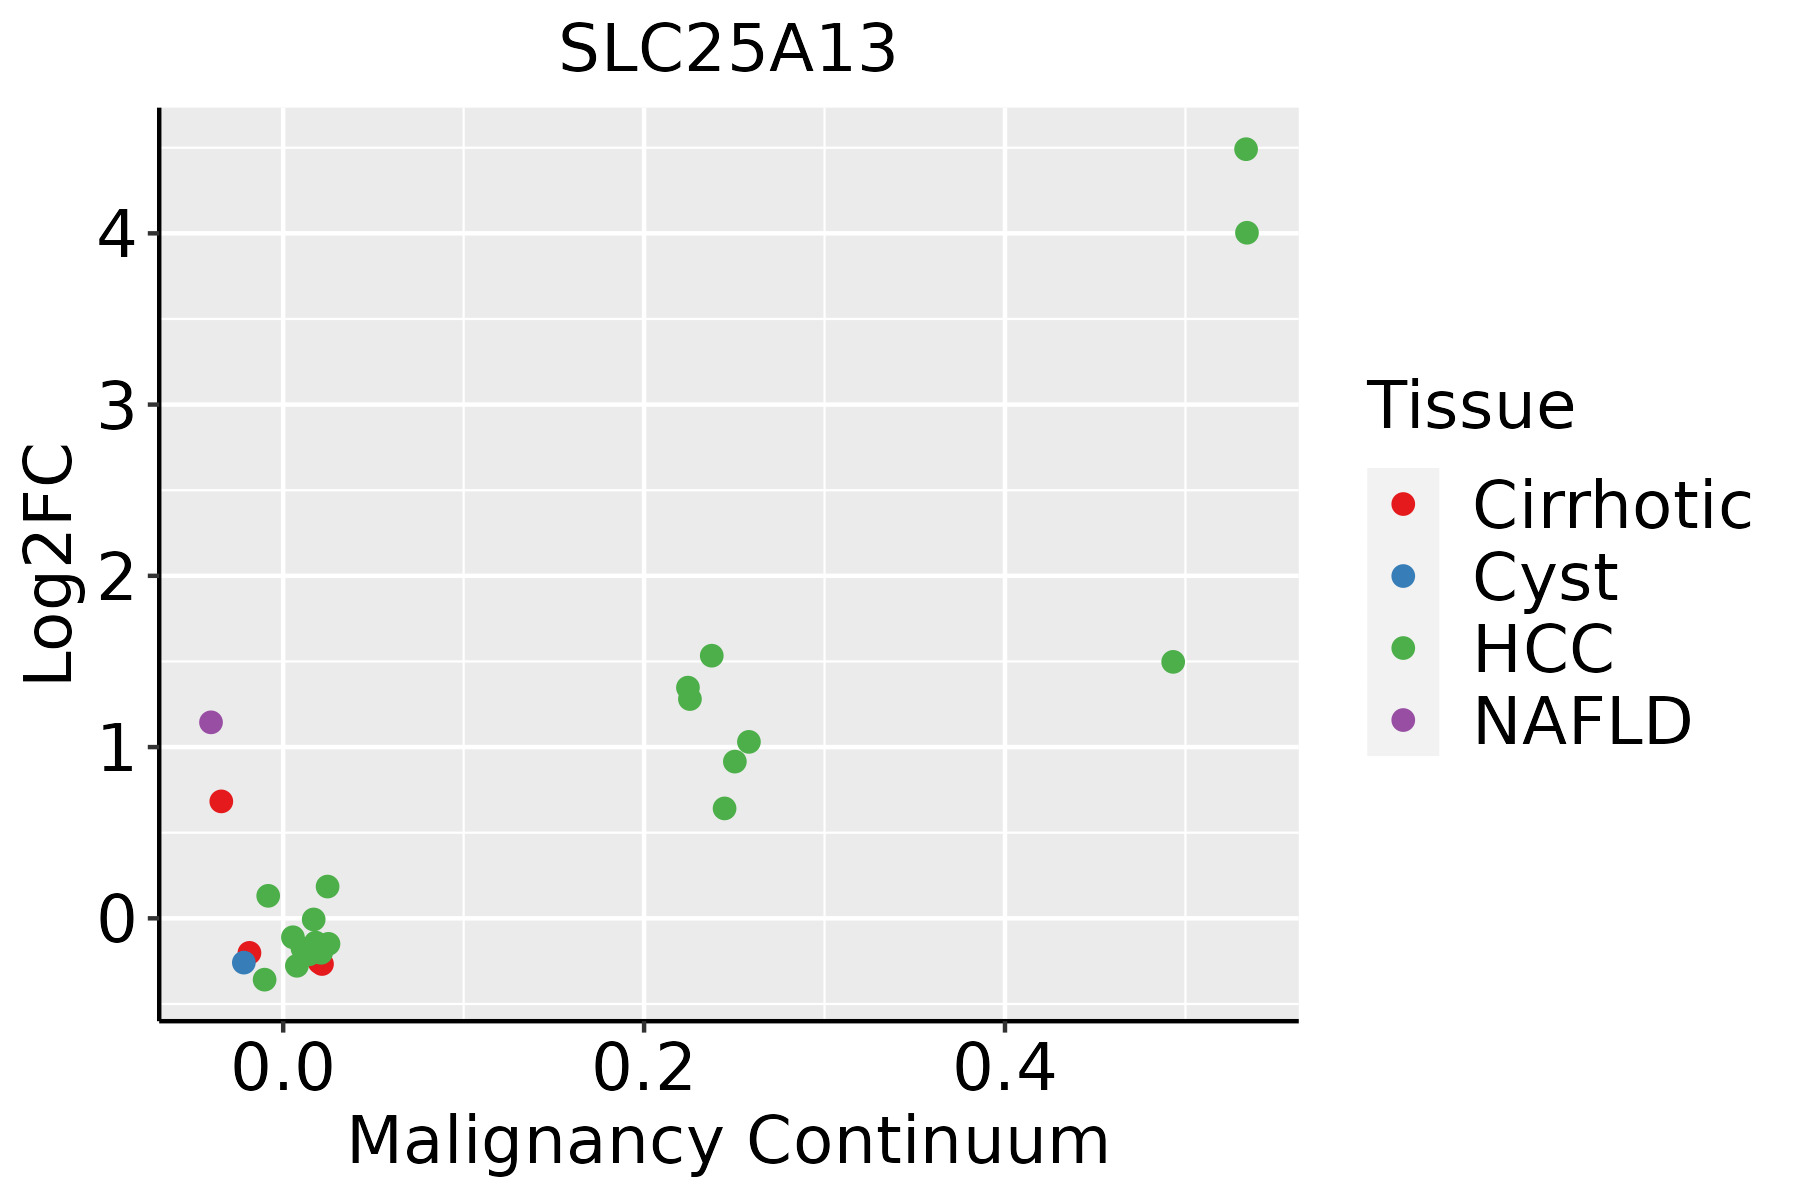 | HCC: Hepatocellular carcinoma |
| NAFLD: Non-alcoholic fatty liver disease |
| Lung | 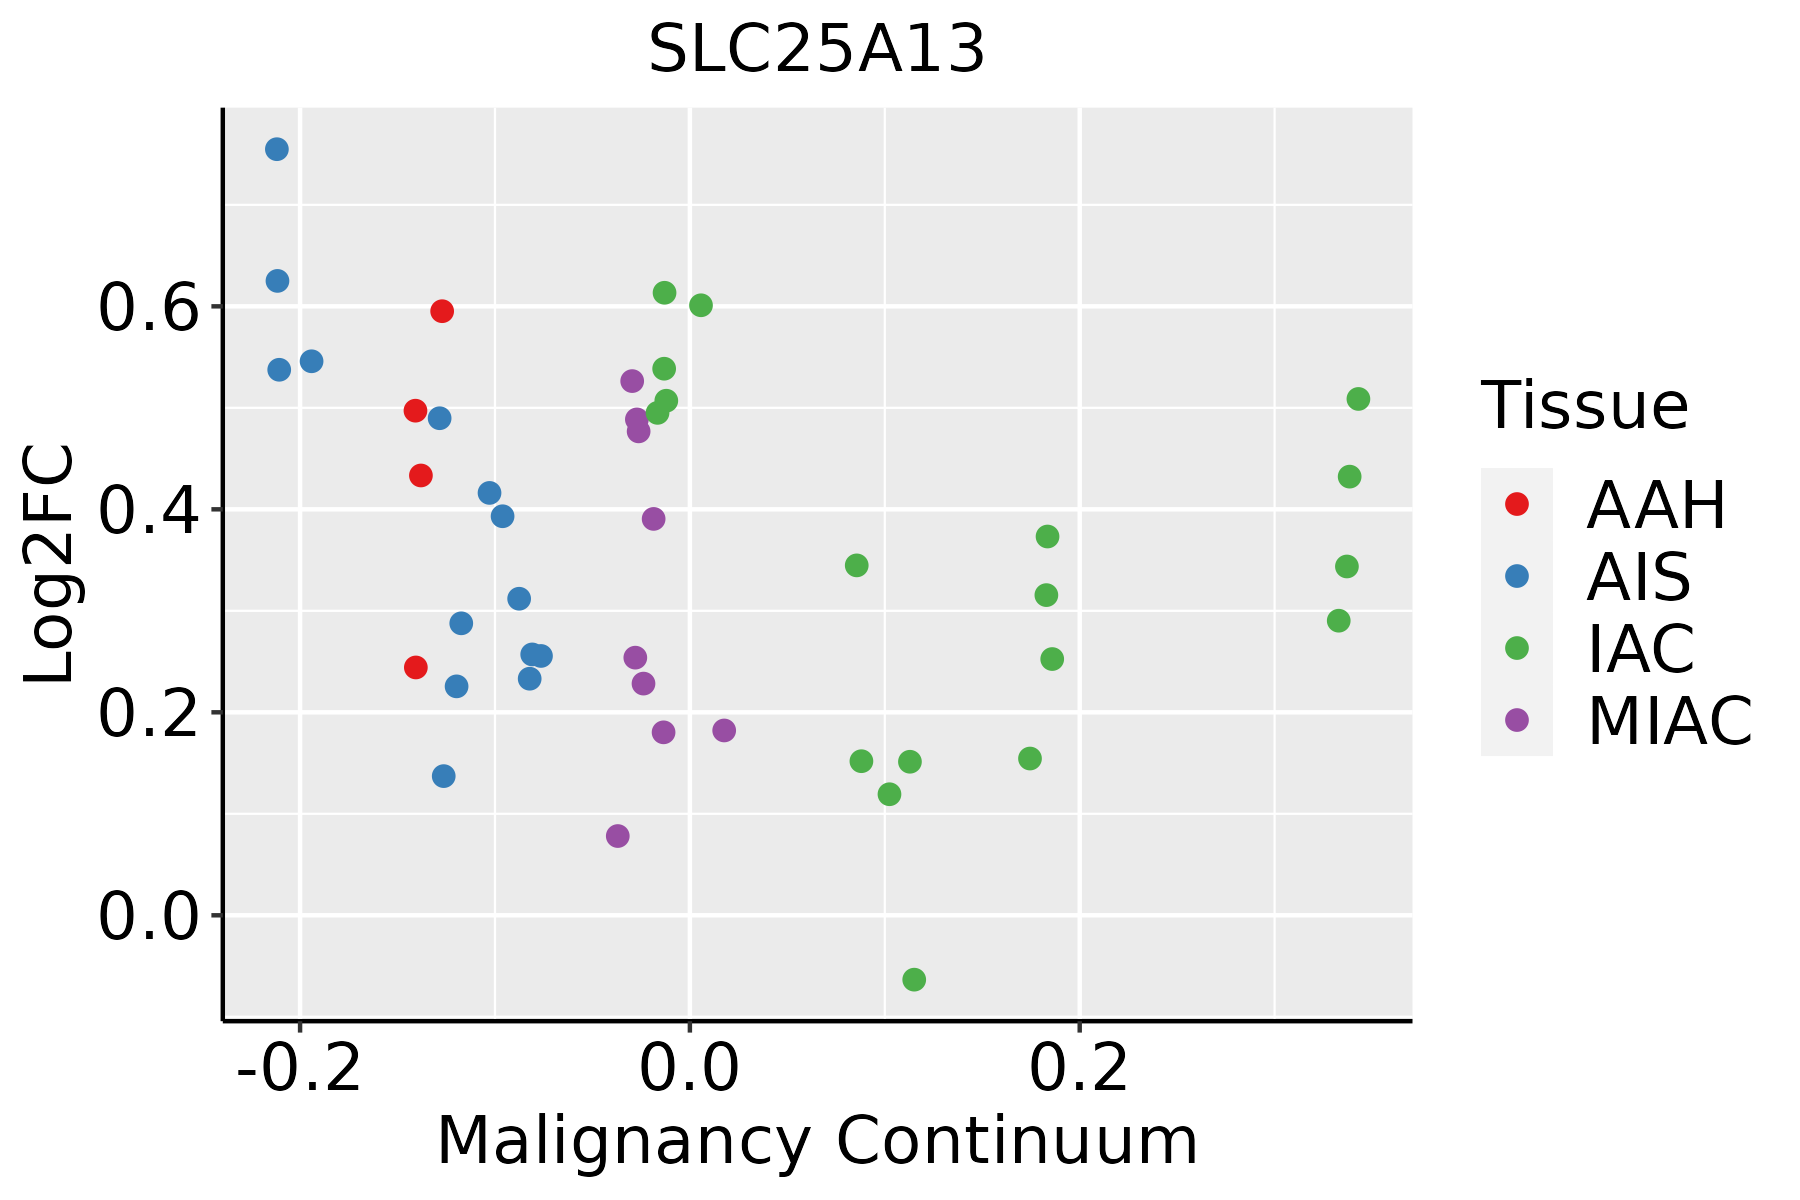 | AAH: Atypical adenomatous hyperplasia |
| AIS: Adenocarcinoma in situ |
| IAC: Invasive lung adenocarcinoma |
| MIA: Minimally invasive adenocarcinoma |
| Oral Cavity | 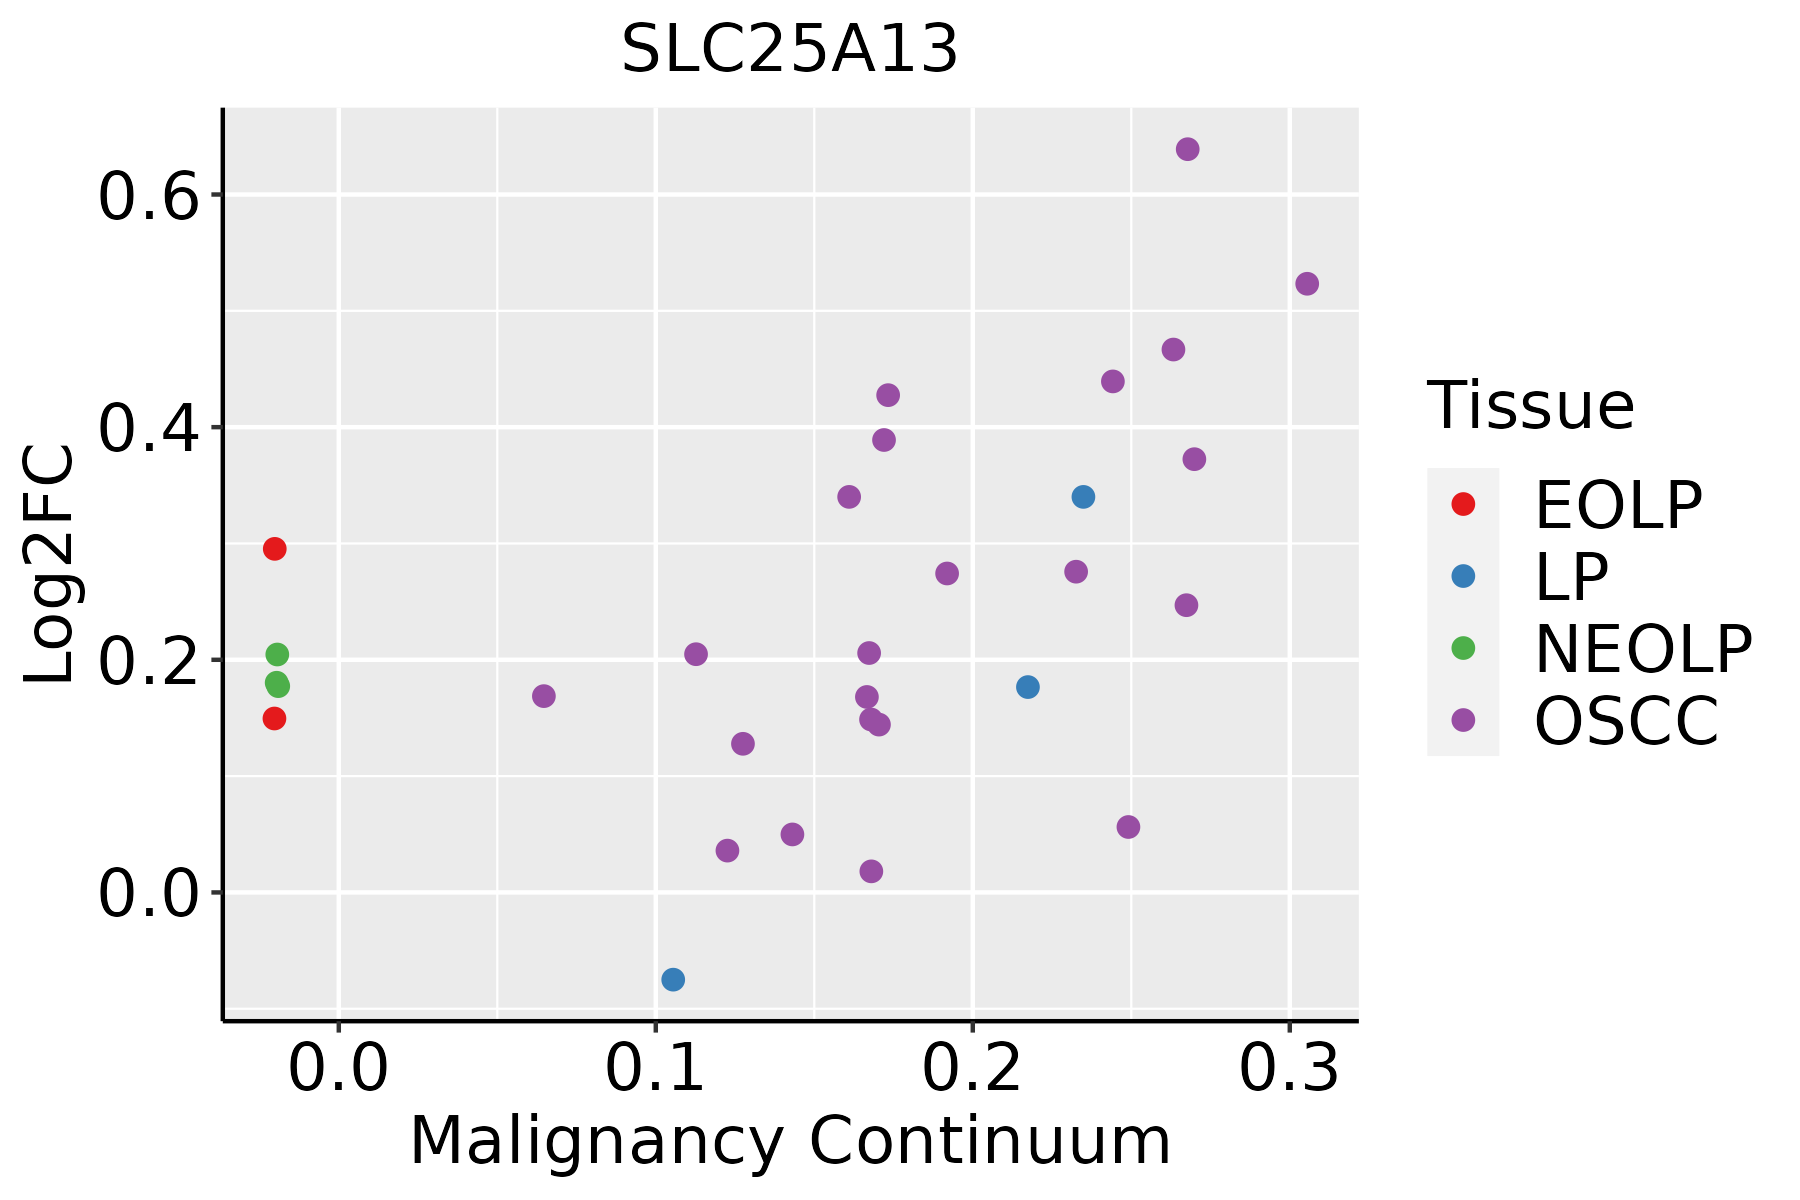 | EOLP: Erosive Oral lichen planus |
| LP: leukoplakia |
| NEOLP: Non-erosive oral lichen planus |
| OSCC: Oral squamous cell carcinoma |
| Skin | 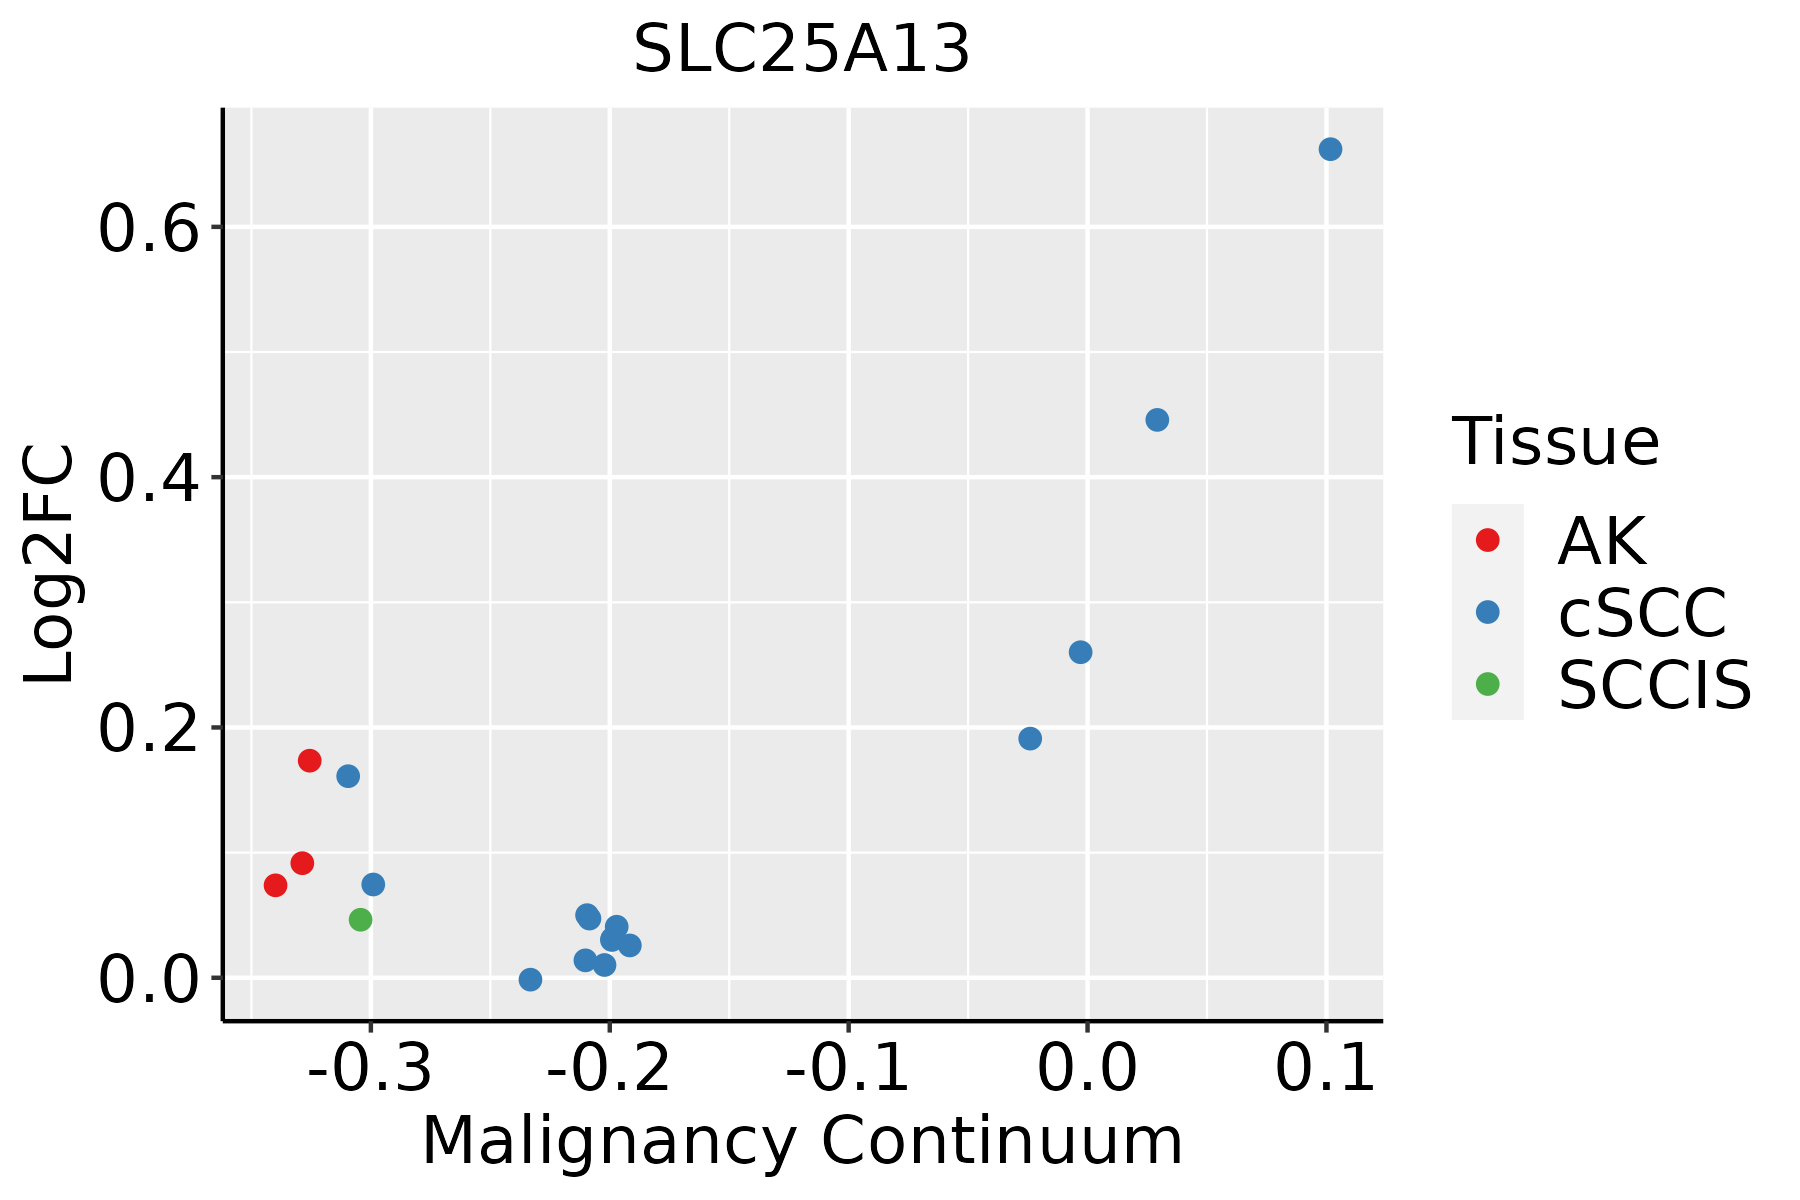 | AK: Actinic keratosis |
| cSCC: Cutaneous squamous cell carcinoma |
| SCCIS:squamous cell carcinoma in situ |
| Thyroid | 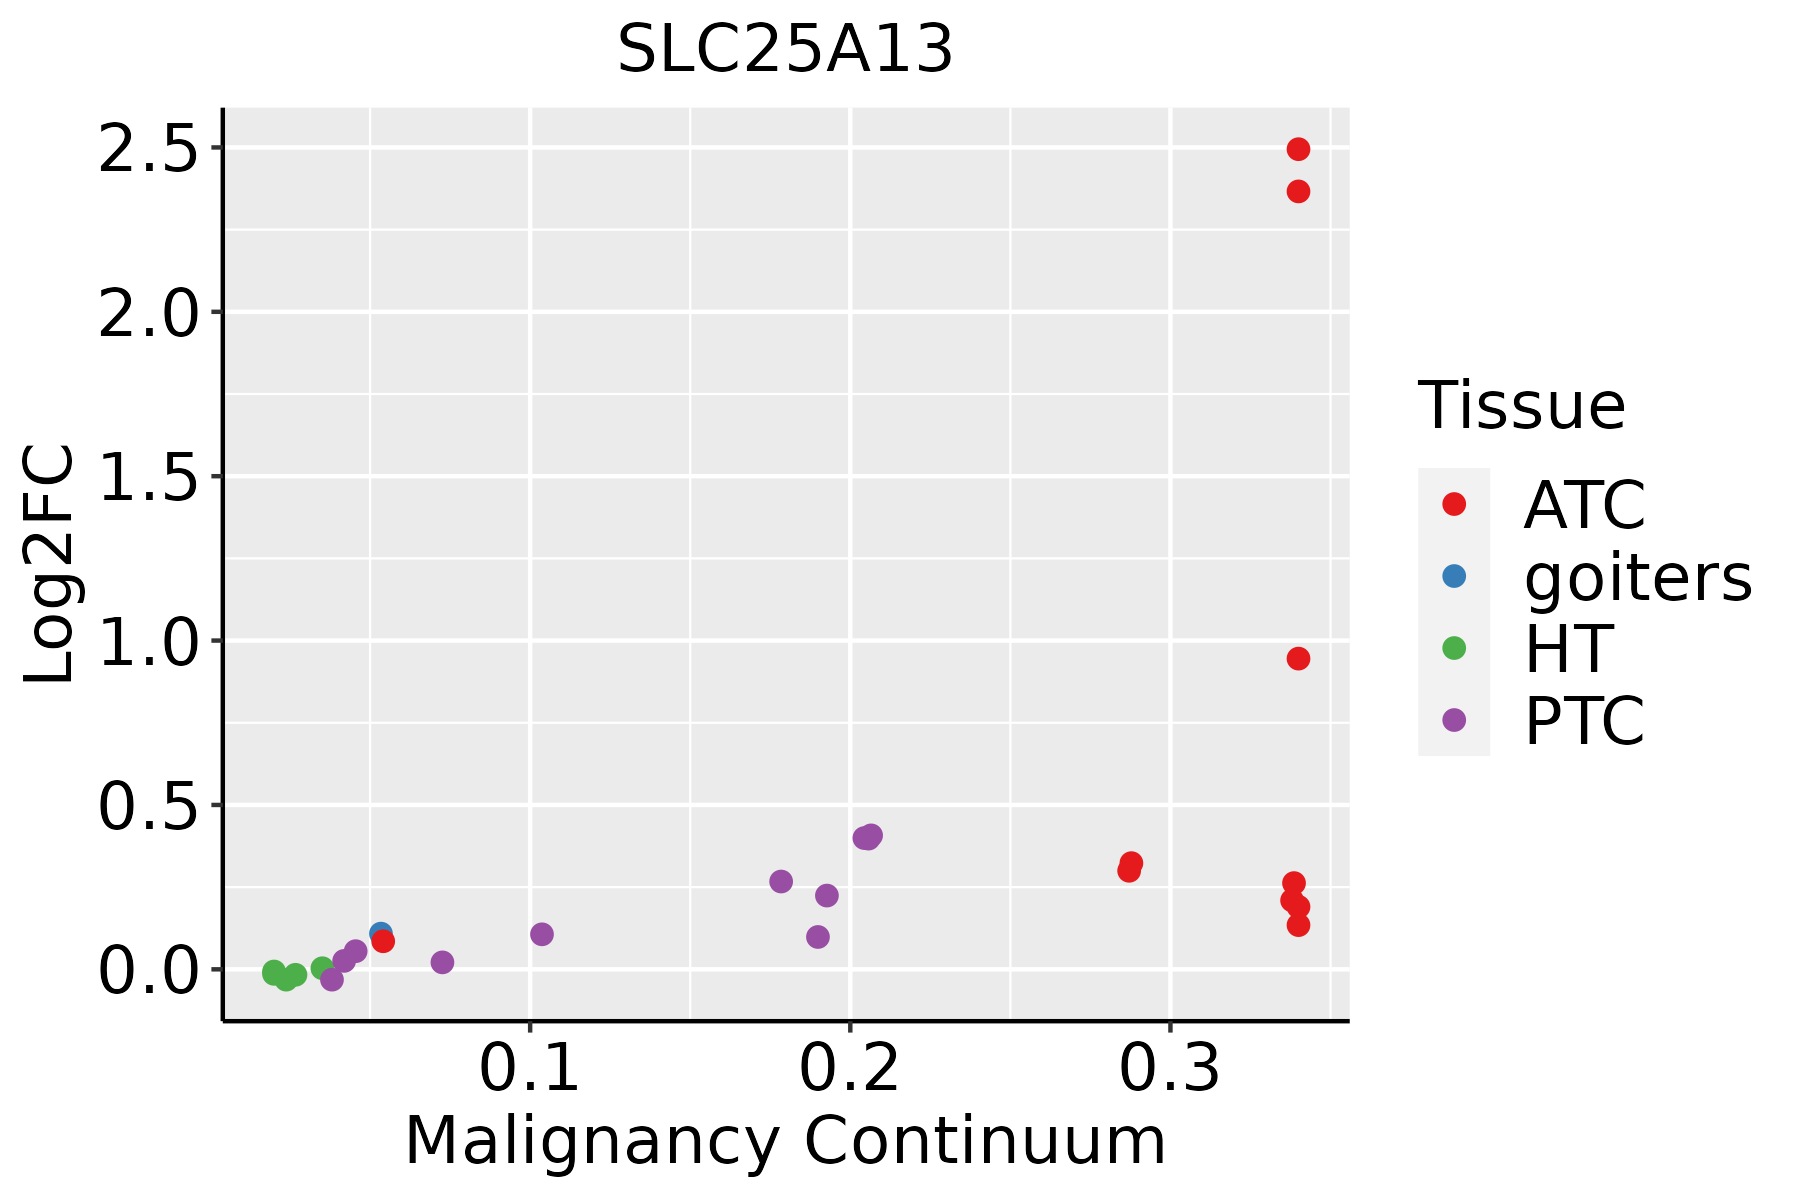 | ATC: Anaplastic thyroid cancer |
| HT: Hashimoto's thyroiditis |
| PTC: Papillary thyroid cancer |
| GO ID | Tissue | Disease Stage | Description | Gene Ratio | Bg Ratio | pvalue | p.adjust | Count |
| GO:000925912 | Liver | Cirrhotic | ribonucleotide metabolic process | 151/4634 | 385/18723 | 1.72e-10 | 8.70e-09 | 151 |
| GO:007252112 | Liver | Cirrhotic | purine-containing compound metabolic process | 156/4634 | 416/18723 | 3.74e-09 | 1.52e-07 | 156 |
| GO:000915012 | Liver | Cirrhotic | purine ribonucleotide metabolic process | 141/4634 | 368/18723 | 4.22e-09 | 1.70e-07 | 141 |
| GO:000599612 | Liver | Cirrhotic | monosaccharide metabolic process | 104/4634 | 257/18723 | 1.74e-08 | 6.32e-07 | 104 |
| GO:001931812 | Liver | Cirrhotic | hexose metabolic process | 97/4634 | 237/18723 | 2.67e-08 | 9.16e-07 | 97 |
| GO:000616312 | Liver | Cirrhotic | purine nucleotide metabolic process | 146/4634 | 396/18723 | 4.12e-08 | 1.34e-06 | 146 |
| GO:19016051 | Liver | Cirrhotic | alpha-amino acid metabolic process | 82/4634 | 195/18723 | 7.72e-08 | 2.30e-06 | 82 |
| GO:000600611 | Liver | Cirrhotic | glucose metabolic process | 82/4634 | 196/18723 | 1.01e-07 | 2.93e-06 | 82 |
| GO:000652011 | Liver | Cirrhotic | cellular amino acid metabolic process | 103/4634 | 284/18723 | 8.88e-06 | 1.30e-04 | 103 |
| GO:005159211 | Liver | Cirrhotic | response to calcium ion | 61/4634 | 149/18723 | 9.47e-06 | 1.38e-04 | 61 |
| GO:00463641 | Liver | Cirrhotic | monosaccharide biosynthetic process | 37/4634 | 82/18723 | 4.52e-05 | 5.30e-04 | 37 |
| GO:00463905 | Liver | Cirrhotic | ribose phosphate biosynthetic process | 71/4634 | 190/18723 | 7.09e-05 | 7.98e-04 | 71 |
| GO:00092605 | Liver | Cirrhotic | ribonucleotide biosynthetic process | 68/4634 | 182/18723 | 1.00e-04 | 1.05e-03 | 68 |
| GO:00091654 | Liver | Cirrhotic | nucleotide biosynthetic process | 89/4634 | 254/18723 | 1.45e-04 | 1.40e-03 | 89 |
| GO:00160511 | Liver | Cirrhotic | carbohydrate biosynthetic process | 73/4634 | 202/18723 | 1.91e-04 | 1.77e-03 | 73 |
| GO:19012934 | Liver | Cirrhotic | nucleoside phosphate biosynthetic process | 89/4634 | 256/18723 | 1.97e-04 | 1.82e-03 | 89 |
| GO:00091526 | Liver | Cirrhotic | purine ribonucleotide biosynthetic process | 62/4634 | 169/18723 | 3.52e-04 | 3.00e-03 | 62 |
| GO:19905425 | Liver | Cirrhotic | mitochondrial transmembrane transport | 41/4634 | 102/18723 | 4.08e-04 | 3.37e-03 | 41 |
| GO:00193191 | Liver | Cirrhotic | hexose biosynthetic process | 33/4634 | 78/18723 | 4.94e-04 | 3.96e-03 | 33 |
| GO:00060941 | Liver | Cirrhotic | gluconeogenesis | 32/4634 | 75/18723 | 5.00e-04 | 3.98e-03 | 32 |
| Hugo Symbol | Variant Class | Variant Classification | dbSNP RS | HGVSc | HGVSp | HGVSp Short | SWISSPROT | BIOTYPE | SIFT | PolyPhen | Tumor Sample Barcode | Tissue | Histology | Sex | Age | Stage | Therapy Types | Drugs | Outcome |
| SLC25A13 | SNV | Missense_Mutation | rs376257669 | c.572N>A | p.Arg191His | p.R191H | Q9UJS0 | protein_coding | deleterious(0.02) | benign(0.049) | TCGA-A2-A0CT-01 | Breast | breast invasive carcinoma | Female | >=65 | I/II | Chemotherapy | cytoxan | SD |
| SLC25A13 | SNV | Missense_Mutation | | c.874N>G | p.Arg292Gly | p.R292G | Q9UJS0 | protein_coding | tolerated(0.06) | benign(0.081) | TCGA-A7-A26G-01 | Breast | breast invasive carcinoma | Female | <65 | I/II | Chemotherapy | taxotere | SD |
| SLC25A13 | SNV | Missense_Mutation | rs142308242 | c.874N>T | p.Arg292Trp | p.R292W | Q9UJS0 | protein_coding | deleterious(0) | possibly_damaging(0.586) | TCGA-AR-A0TU-01 | Breast | breast invasive carcinoma | Female | <65 | I/II | Unspecific | Doxorubicin | SD |
| SLC25A13 | SNV | Missense_Mutation | | c.1460N>T | p.Ala487Val | p.A487V | Q9UJS0 | protein_coding | tolerated(0.06) | probably_damaging(0.933) | TCGA-E2-A1L9-01 | Breast | breast invasive carcinoma | Female | <65 | I/II | Chemotherapy | cytoxan | SD |
| SLC25A13 | insertion | Frame_Shift_Ins | novel | c.943_944insTTATGTAC | p.Ser315PhefsTer42 | p.S315Ffs*42 | Q9UJS0 | protein_coding | | | TCGA-AN-A04C-01 | Breast | breast invasive carcinoma | Female | <65 | I/II | Unknown | Unknown | SD |
| SLC25A13 | insertion | Nonsense_Mutation | novel | c.941_942insATATTTCTGAGACTCAGTATTATCAC | p.Ser315TyrfsTer3 | p.S315Yfs*3 | Q9UJS0 | protein_coding | | | TCGA-AN-A04C-01 | Breast | breast invasive carcinoma | Female | <65 | I/II | Unknown | Unknown | SD |
| SLC25A13 | SNV | Missense_Mutation | novel | c.690G>A | p.Met230Ile | p.M230I | Q9UJS0 | protein_coding | tolerated(0.09) | benign(0.222) | TCGA-C5-A7X5-01 | Cervix | cervical & endocervical cancer | Female | >=65 | I/II | Chemotherapy | carboplatin | PD |
| SLC25A13 | SNV | Missense_Mutation | | c.871N>A | p.Glu291Lys | p.E291K | Q9UJS0 | protein_coding | tolerated(0.08) | benign(0.058) | TCGA-UC-A7PF-01 | Cervix | cervical & endocervical cancer | Female | <65 | I/II | Unknown | Unknown | SD |
| SLC25A13 | SNV | Missense_Mutation | | c.1001G>A | p.Gly334Asp | p.G334D | Q9UJS0 | protein_coding | tolerated(0.27) | benign(0.088) | TCGA-A6-3810-01 | Colorectum | colon adenocarcinoma | Male | <65 | I/II | Unknown | Unknown | SD |
| SLC25A13 | SNV | Missense_Mutation | | c.2010N>T | p.Lys670Asn | p.K670N | Q9UJS0 | protein_coding | tolerated_low_confidence(0.45) | benign(0.01) | TCGA-AA-3811-01 | Colorectum | colon adenocarcinoma | Female | >=65 | III/IV | Unknown | Unknown | PD |


