
|
|||||
|
 | |
| |
| |
| |
| |
| |
|
Gene: RAC2 |
Gene summary for RAC2 |
| Gene information | Species | Human | Gene symbol | RAC2 | Gene ID | 5880 |
| Gene name | Rac family small GTPase 2 | |
| Gene Alias | EN-7 | |
| Cytomap | 22q13.1 | |
| Gene Type | protein-coding | GO ID | GO:0000902 | UniProtAcc | A0A024R1P2 |
Top |
Malignant transformation analysis |
| Identification of the aberrant gene expression in precancerous and cancerous lesions by comparing the gene expression of stem-like cells in diseased tissues with normal stem cells |
| Entrez ID | Symbol | Replicates | Species | Organ | Tissue | Adj P-value | Log2FC | Malignancy |
| 5880 | RAC2 | N_HPV_2 | Human | Cervix | N_HPV | 9.37e-10 | -2.58e-02 | -0.0131 |
| 5880 | RAC2 | CCI_1 | Human | Cervix | CC | 5.31e-06 | -7.09e-01 | 0.528 |
| 5880 | RAC2 | CCI_2 | Human | Cervix | CC | 2.93e-05 | -7.06e-01 | 0.5249 |
| 5880 | RAC2 | CCI_3 | Human | Cervix | CC | 5.15e-09 | -7.18e-01 | 0.516 |
| 5880 | RAC2 | CCII_1 | Human | Cervix | CC | 8.43e-15 | -7.38e-01 | 0.3249 |
| 5880 | RAC2 | Tumor | Human | Cervix | CC | 1.63e-18 | -5.17e-01 | 0.1241 |
| 5880 | RAC2 | sample1 | Human | Cervix | CC | 1.39e-08 | -6.82e-01 | 0.0959 |
| 5880 | RAC2 | sample3 | Human | Cervix | CC | 9.02e-15 | -4.03e-01 | 0.1387 |
| 5880 | RAC2 | H2 | Human | Cervix | HSIL_HPV | 3.13e-20 | -6.73e-01 | 0.0632 |
| 5880 | RAC2 | L1 | Human | Cervix | CC | 1.17e-08 | -5.55e-01 | 0.0802 |
| 5880 | RAC2 | T1 | Human | Cervix | CC | 3.44e-13 | -6.03e-01 | 0.0918 |
| 5880 | RAC2 | T2 | Human | Cervix | CC | 2.35e-05 | -7.08e-01 | 0.0709 |
| 5880 | RAC2 | T3 | Human | Cervix | CC | 4.99e-17 | -4.19e-01 | 0.1389 |
| 5880 | RAC2 | LZE2T | Human | Esophagus | ESCC | 1.81e-03 | 7.62e-01 | 0.082 |
| 5880 | RAC2 | LZE4T | Human | Esophagus | ESCC | 2.87e-21 | 8.98e-01 | 0.0811 |
| 5880 | RAC2 | LZE7T | Human | Esophagus | ESCC | 7.05e-14 | 1.30e+00 | 0.0667 |
| 5880 | RAC2 | LZE8T | Human | Esophagus | ESCC | 1.83e-10 | 7.19e-01 | 0.067 |
| 5880 | RAC2 | LZE24T | Human | Esophagus | ESCC | 1.15e-11 | 5.17e-01 | 0.0596 |
| 5880 | RAC2 | LZE6T | Human | Esophagus | ESCC | 6.79e-38 | 2.10e+00 | 0.0845 |
| 5880 | RAC2 | P2T-E | Human | Esophagus | ESCC | 9.42e-19 | 3.60e-01 | 0.1177 |
| Page: 1 2 3 4 5 |
| Tissue | Expression Dynamics | Abbreviation |
| Cervix | 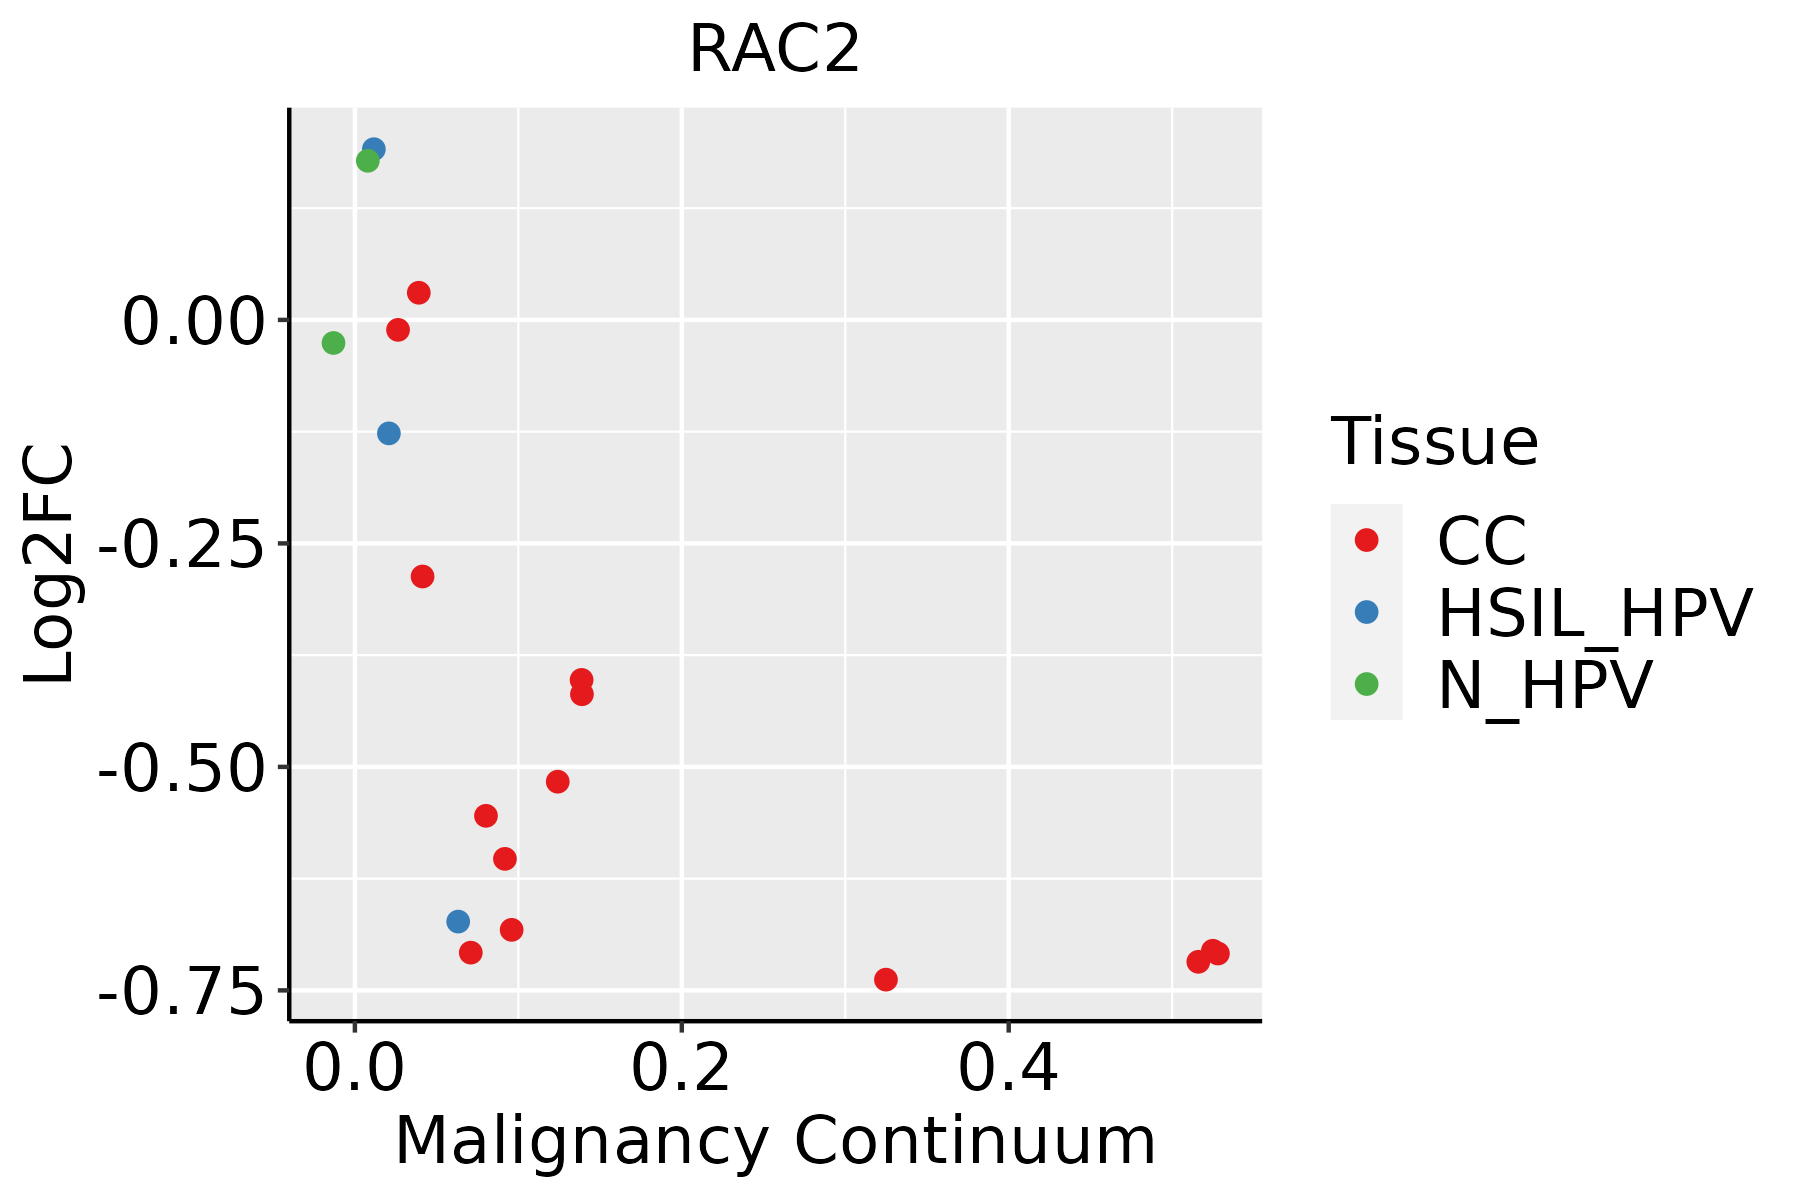 | CC: Cervix cancer |
| HSIL_HPV: HPV-infected high-grade squamous intraepithelial lesions | ||
| N_HPV: HPV-infected normal cervix | ||
| Esophagus |  | ESCC: Esophageal squamous cell carcinoma |
| HGIN: High-grade intraepithelial neoplasias | ||
| LGIN: Low-grade intraepithelial neoplasias | ||
| Liver | 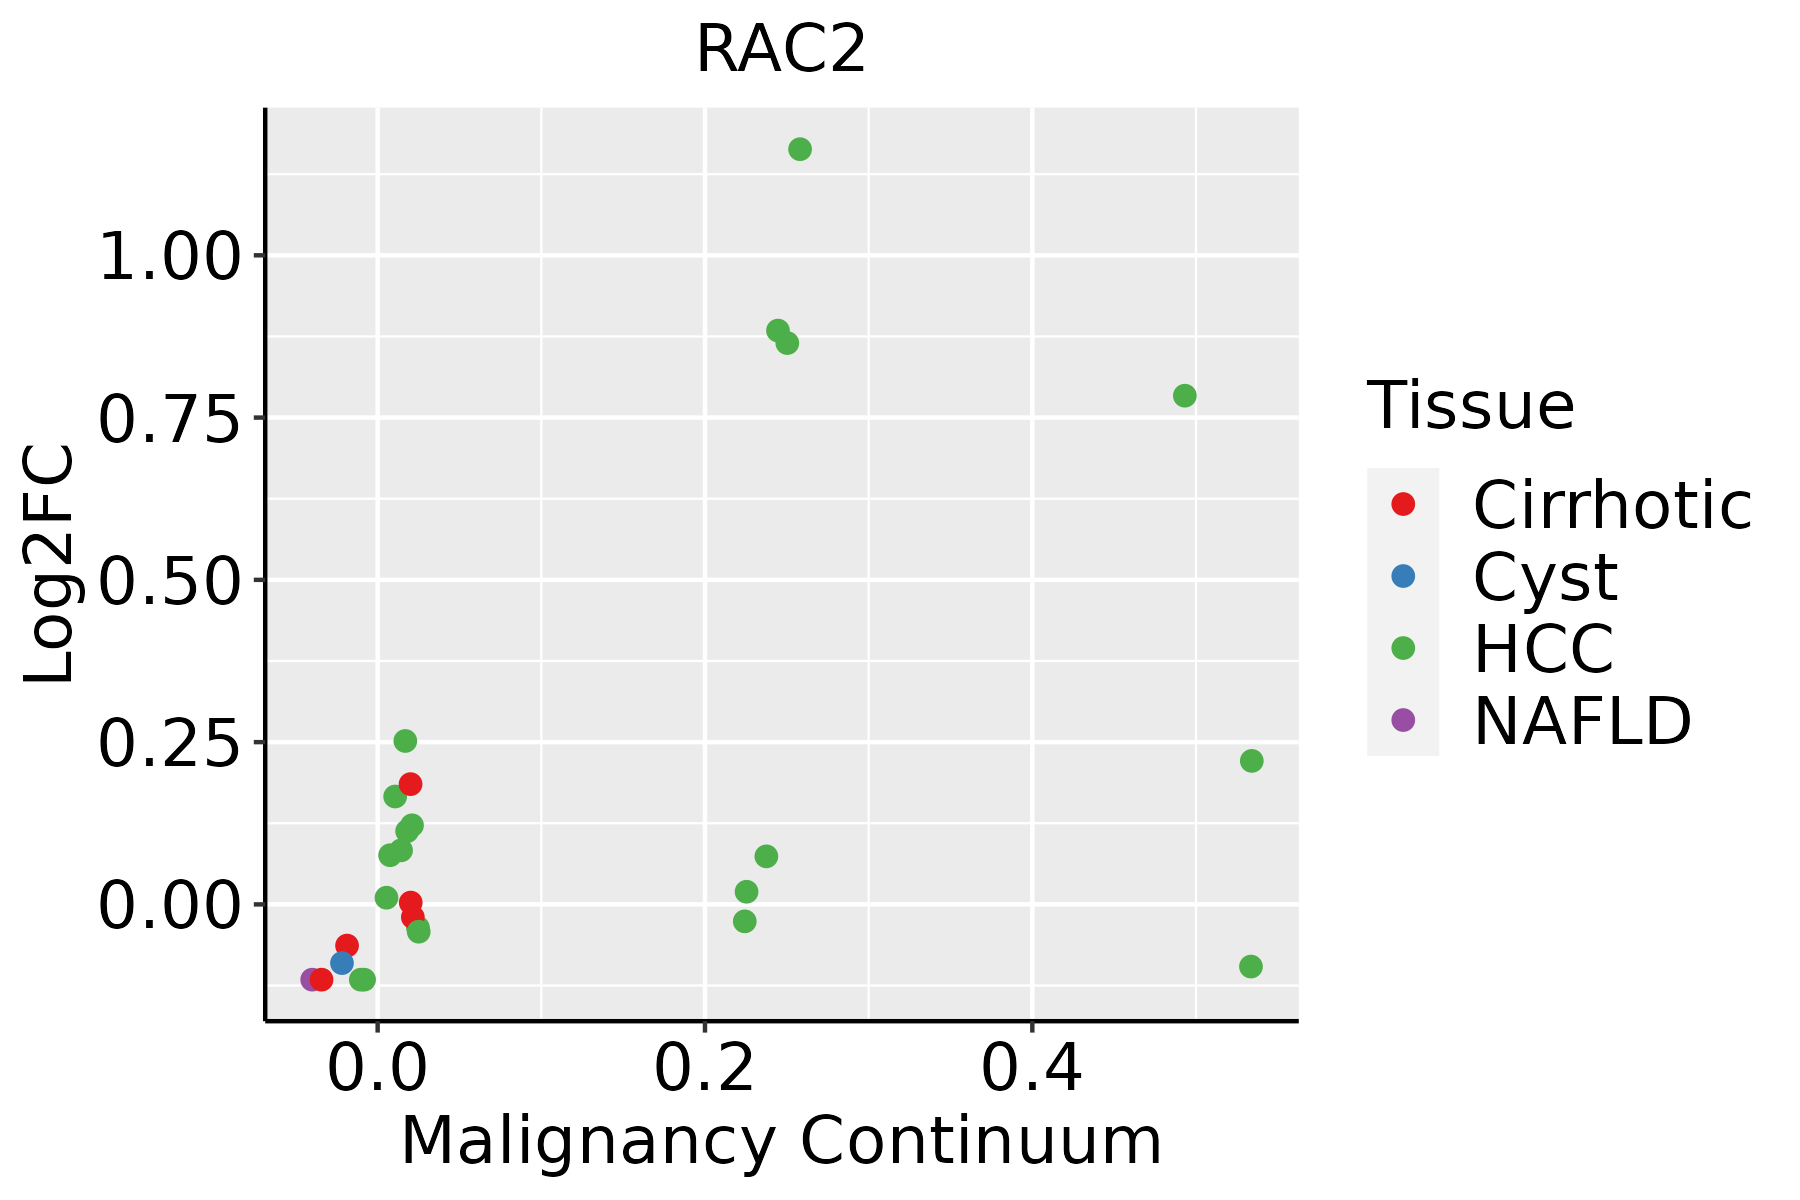 | HCC: Hepatocellular carcinoma |
| NAFLD: Non-alcoholic fatty liver disease | ||
| Oral Cavity | 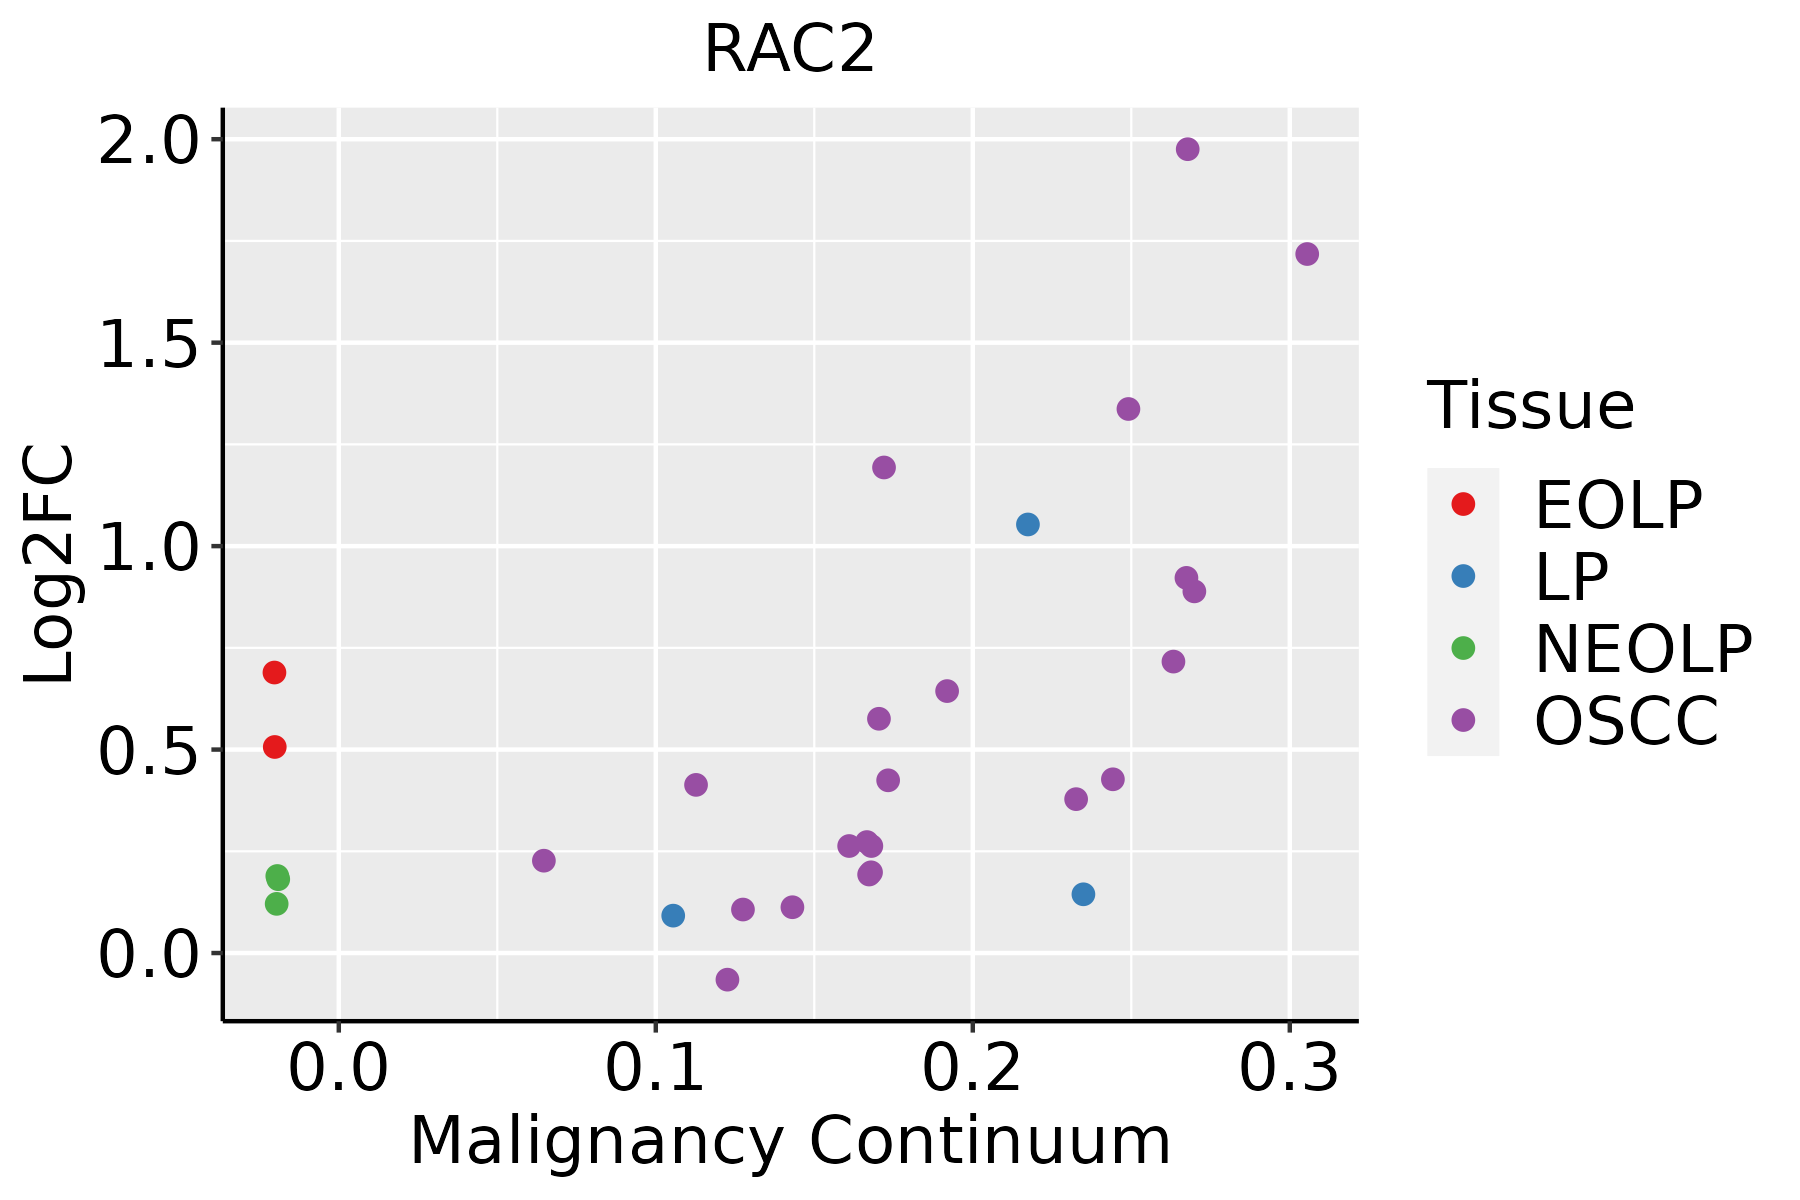 | EOLP: Erosive Oral lichen planus |
| LP: leukoplakia | ||
| NEOLP: Non-erosive oral lichen planus | ||
| OSCC: Oral squamous cell carcinoma | ||
| Skin |  | AK: Actinic keratosis |
| cSCC: Cutaneous squamous cell carcinoma | ||
| SCCIS:squamous cell carcinoma in situ | ||
| Thyroid | 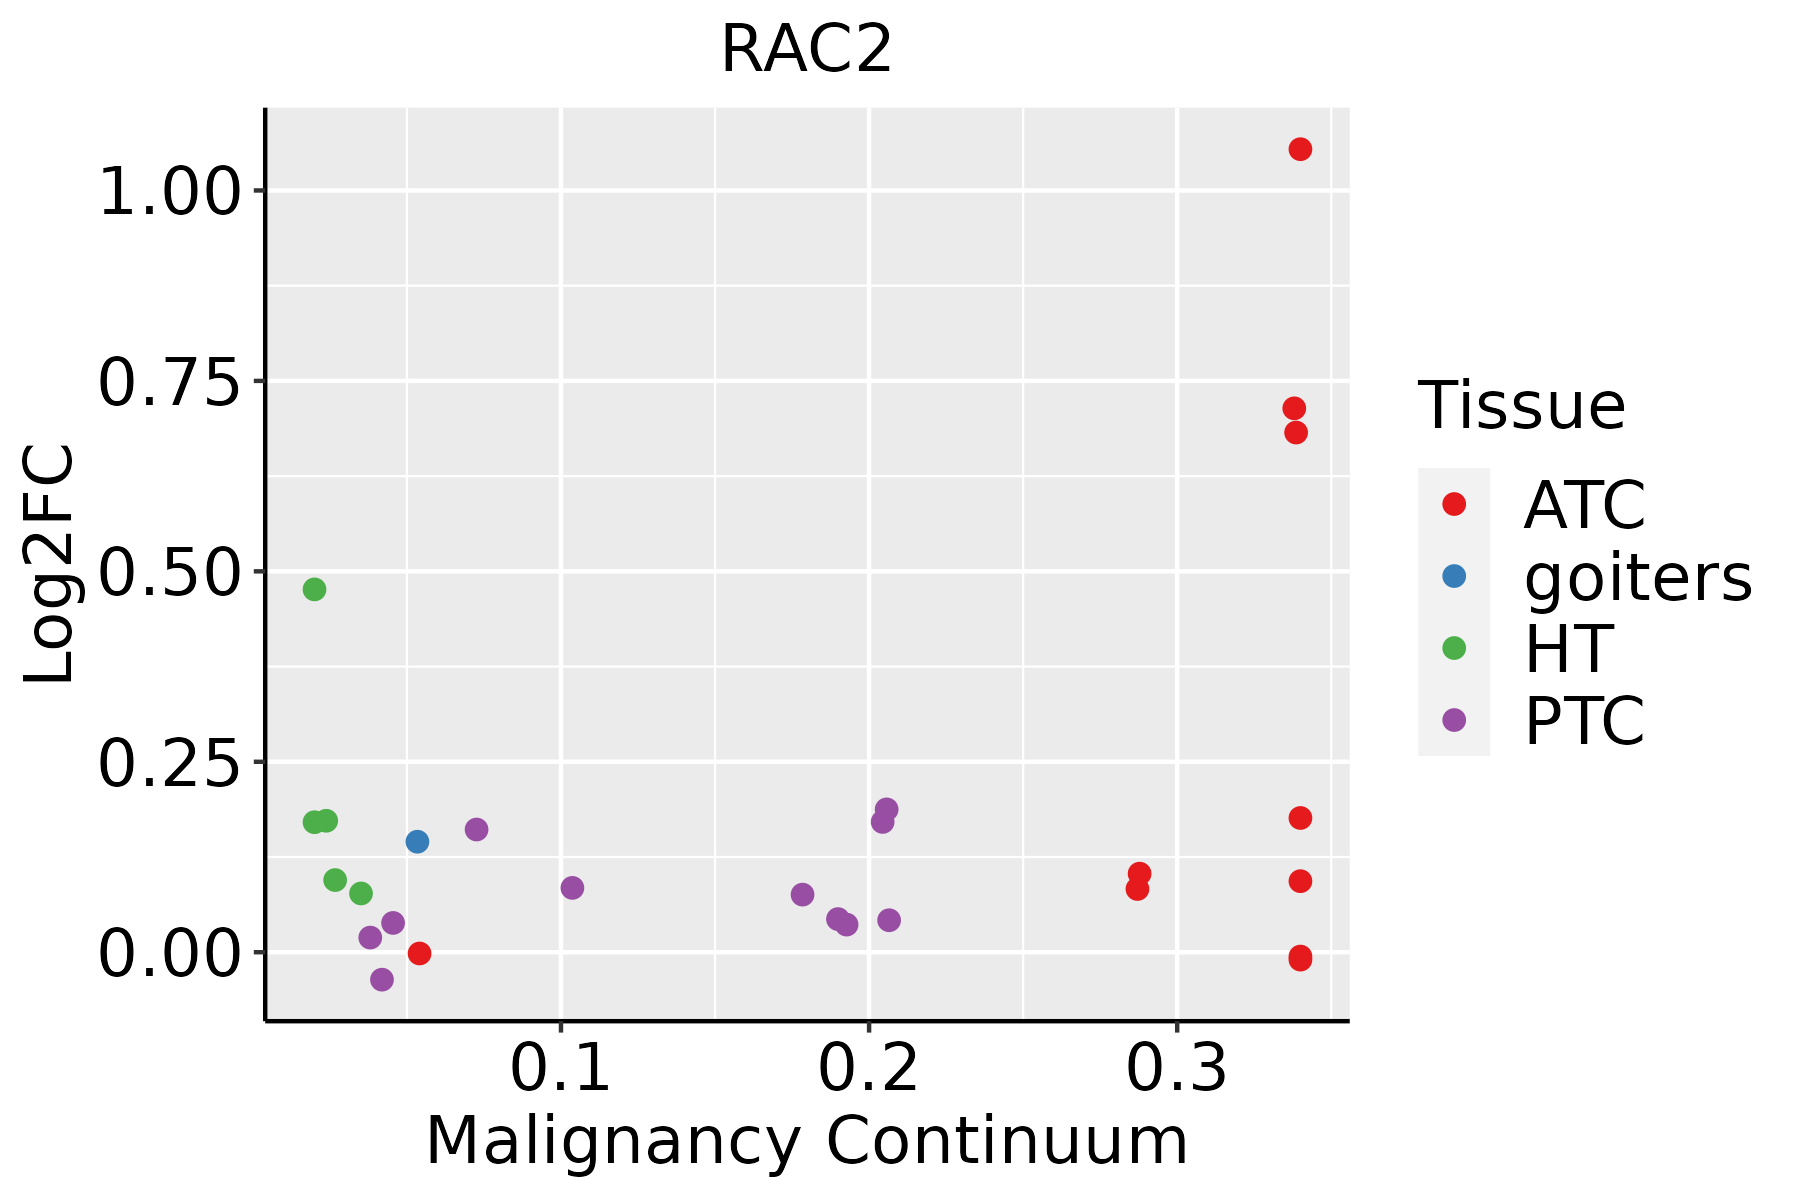 | ATC: Anaplastic thyroid cancer |
| HT: Hashimoto's thyroiditis | ||
| PTC: Papillary thyroid cancer |
| ∗log2FC in expression of this searched gene in stem-like cells from each diseased tissue sample relative to stem-like cells in normal samples in each tissue plotted against the malignancy continuum. Samples are colored based on if they are from different disease stage. |
Top |
Malignant transformation related pathway analysis |
| Find out the enriched GO biological processes and KEGG pathways involved in transition from healthy to precancer to cancer |
| Tissue | Disease Stage | Enriched GO biological Processes |
| Colorectum | AD |  |
| Colorectum | SER |  |
| Colorectum | MSS |  |
| Colorectum | MSI-H |  |
| Colorectum | FAP |  |
| ∗Top 15 enriched GO BP terms are showed in the bar plot of each disease state in each tissue. Each row represents a significant GO biological process which is colored according to the -log10(p.adjust). |
| Page: 1 2 3 4 5 6 7 8 9 |
| GO ID | Tissue | Disease Stage | Description | Gene Ratio | Bg Ratio | pvalue | p.adjust | Count |
| GO:00066267 | Liver | Cirrhotic | protein targeting to mitochondrion | 53/4634 | 100/18723 | 1.19e-09 | 5.27e-08 | 53 |
| GO:003295612 | Liver | Cirrhotic | regulation of actin cytoskeleton organization | 136/4634 | 358/18723 | 1.47e-08 | 5.49e-07 | 136 |
| GO:000836012 | Liver | Cirrhotic | regulation of cell shape | 69/4634 | 154/18723 | 4.21e-08 | 1.36e-06 | 69 |
| GO:001081012 | Liver | Cirrhotic | regulation of cell-substrate adhesion | 88/4634 | 221/18723 | 4.89e-07 | 1.10e-05 | 88 |
| GO:200037712 | Liver | Cirrhotic | regulation of reactive oxygen species metabolic process | 67/4634 | 157/18723 | 6.07e-07 | 1.32e-05 | 67 |
| GO:00725937 | Liver | Cirrhotic | reactive oxygen species metabolic process | 92/4634 | 239/18723 | 1.57e-06 | 3.03e-05 | 92 |
| GO:003158912 | Liver | Cirrhotic | cell-substrate adhesion | 128/4634 | 363/18723 | 4.10e-06 | 6.90e-05 | 128 |
| GO:000726511 | Liver | Cirrhotic | Ras protein signal transduction | 119/4634 | 337/18723 | 8.16e-06 | 1.22e-04 | 119 |
| GO:19035333 | Liver | Cirrhotic | regulation of protein targeting | 38/4634 | 81/18723 | 1.20e-05 | 1.69e-04 | 38 |
| GO:000716312 | Liver | Cirrhotic | establishment or maintenance of cell polarity | 82/4634 | 218/18723 | 1.55e-05 | 2.11e-04 | 82 |
| GO:19037493 | Liver | Cirrhotic | positive regulation of establishment of protein localization to mitochondrion | 21/4634 | 36/18723 | 1.80e-05 | 2.44e-04 | 21 |
| GO:00308656 | Liver | Cirrhotic | cortical cytoskeleton organization | 30/4634 | 61/18723 | 3.16e-05 | 3.93e-04 | 30 |
| GO:009758111 | Liver | Cirrhotic | lamellipodium organization | 40/4634 | 90/18723 | 3.48e-05 | 4.26e-04 | 40 |
| GO:19037473 | Liver | Cirrhotic | regulation of establishment of protein localization to mitochondrion | 25/4634 | 50/18723 | 1.01e-04 | 1.05e-03 | 25 |
| GO:19039552 | Liver | Cirrhotic | positive regulation of protein targeting to mitochondrion | 18/4634 | 32/18723 | 1.38e-04 | 1.34e-03 | 18 |
| GO:005165611 | Liver | Cirrhotic | establishment of organelle localization | 128/4634 | 390/18723 | 1.78e-04 | 1.67e-03 | 128 |
| GO:001059211 | Liver | Cirrhotic | positive regulation of lamellipodium assembly | 16/4634 | 29/18723 | 4.36e-04 | 3.55e-03 | 16 |
| GO:190274511 | Liver | Cirrhotic | positive regulation of lamellipodium organization | 19/4634 | 37/18723 | 4.39e-04 | 3.57e-03 | 19 |
| GO:190274311 | Liver | Cirrhotic | regulation of lamellipodium organization | 25/4634 | 54/18723 | 4.63e-04 | 3.75e-03 | 25 |
| GO:19032143 | Liver | Cirrhotic | regulation of protein targeting to mitochondrion | 21/4634 | 44/18723 | 7.88e-04 | 5.79e-03 | 21 |
| Page: 1 2 3 4 5 6 7 8 9 10 11 12 13 14 15 16 17 18 19 20 21 22 23 24 25 26 27 28 29 30 31 32 33 34 35 36 37 38 |
| Pathway ID | Tissue | Disease Stage | Description | Gene Ratio | Bg Ratio | pvalue | p.adjust | qvalue | Count |
| hsa0502018 | Cervix | CC | Prion disease | 98/1267 | 273/8465 | 2.64e-18 | 1.42e-16 | 8.42e-17 | 98 |
| hsa0541520 | Cervix | CC | Diabetic cardiomyopathy | 76/1267 | 203/8465 | 1.40e-15 | 6.46e-14 | 3.82e-14 | 76 |
| hsa0541820 | Cervix | CC | Fluid shear stress and atherosclerosis | 50/1267 | 139/8465 | 5.71e-10 | 1.32e-08 | 7.81e-09 | 50 |
| hsa0541620 | Cervix | CC | Viral myocarditis | 27/1267 | 60/8465 | 2.43e-08 | 3.57e-07 | 2.11e-07 | 27 |
| hsa0516318 | Cervix | CC | Human cytomegalovirus infection | 65/1267 | 225/8465 | 4.59e-08 | 6.47e-07 | 3.83e-07 | 65 |
| hsa0451010 | Cervix | CC | Focal adhesion | 59/1267 | 203/8465 | 1.53e-07 | 1.84e-06 | 1.09e-06 | 59 |
| hsa0481016 | Cervix | CC | Regulation of actin cytoskeleton | 64/1267 | 229/8465 | 2.24e-07 | 2.59e-06 | 1.53e-06 | 64 |
| hsa0452020 | Cervix | CC | Adherens junction | 33/1267 | 93/8465 | 6.99e-07 | 7.31e-06 | 4.32e-06 | 33 |
| hsa0467020 | Cervix | CC | Leukocyte transendothelial migration | 36/1267 | 114/8465 | 5.22e-06 | 4.83e-05 | 2.86e-05 | 36 |
| hsa0401512 | Cervix | CC | Rap1 signaling pathway | 56/1267 | 210/8465 | 6.23e-06 | 5.61e-05 | 3.32e-05 | 56 |
| hsa0466612 | Cervix | CC | Fc gamma R-mediated phagocytosis | 31/1267 | 97/8465 | 1.78e-05 | 1.42e-04 | 8.40e-05 | 31 |
| hsa0517016 | Cervix | CC | Human immunodeficiency virus 1 infection | 55/1267 | 212/8465 | 1.80e-05 | 1.42e-04 | 8.40e-05 | 55 |
| hsa0513516 | Cervix | CC | Yersinia infection | 39/1267 | 137/8465 | 3.27e-05 | 2.41e-04 | 1.42e-04 | 39 |
| hsa0407110 | Cervix | CC | Sphingolipid signaling pathway | 35/1267 | 121/8465 | 5.70e-05 | 3.93e-04 | 2.32e-04 | 35 |
| hsa043609 | Cervix | CC | Axon guidance | 47/1267 | 182/8465 | 8.13e-05 | 5.38e-04 | 3.18e-04 | 47 |
| hsa0521010 | Cervix | CC | Colorectal cancer | 27/1267 | 86/8465 | 8.60e-05 | 5.57e-04 | 3.30e-04 | 27 |
| hsa052128 | Cervix | CC | Pancreatic cancer | 24/1267 | 76/8465 | 1.89e-04 | 1.11e-03 | 6.55e-04 | 24 |
| hsa04664 | Cervix | CC | Fc epsilon RI signaling pathway | 22/1267 | 68/8465 | 2.35e-04 | 1.31e-03 | 7.77e-04 | 22 |
| hsa043109 | Cervix | CC | Wnt signaling pathway | 43/1267 | 171/8465 | 3.03e-04 | 1.64e-03 | 9.68e-04 | 43 |
| hsa040142 | Cervix | CC | Ras signaling pathway | 51/1267 | 236/8465 | 3.55e-03 | 1.34e-02 | 7.91e-03 | 51 |
| Page: 1 2 3 4 5 6 7 8 9 10 11 12 13 |
Top |
Cell-cell communication analysis |
| Identification of potential cell-cell interactions between two cell types and their ligand-receptor pairs for different disease states |
| Ligand | Receptor | LRpair | Pathway | Tissue | Disease Stage |
| Page: 1 |
Top |
Single-cell gene regulatory network inference analysis |
| Find out the significant the regulons (TFs) and the target genes of each regulon across cell types for different disease states |
| TF | Cell Type | Tissue | Disease Stage | Target Gene | RSS | Regulon Activity |
| ∗The dot plots of a searched regulon are shown for all cell subpopulations in each disease state of each tissue based on the regulon specific score inferred using pySCENIC and by calculating the average expression. |
| Page: 1 |
Top |
Somatic mutation of malignant transformation related genes |
| Annotation of somatic variants for genes involved in malignant transformation |
| Hugo Symbol | Variant Class | Variant Classification | dbSNP RS | HGVSc | HGVSp | HGVSp Short | SWISSPROT | BIOTYPE | SIFT | PolyPhen | Tumor Sample Barcode | Tissue | Histology | Sex | Age | Stage | Therapy Types | Drugs | Outcome |
| RAC2 | SNV | Missense_Mutation | novel | c.266C>G | p.Ser89Cys | p.S89C | P15153 | protein_coding | deleterious_low_confidence(0) | probably_damaging(1) | TCGA-D8-A4Z1-01 | Breast | breast invasive carcinoma | Female | >=65 | I/II | Hormone Therapy | tamoxiphen | SD |
| RAC2 | SNV | Missense_Mutation | novel | c.419N>A | p.Pro140Gln | p.P140Q | P15153 | protein_coding | tolerated_low_confidence(0.38) | benign(0.01) | TCGA-LL-A7SZ-01 | Breast | breast invasive carcinoma | Female | <65 | I/II | Chemotherapy | adriamycin | CR |
| RAC2 | SNV | Missense_Mutation | c.486N>C | p.Gln162His | p.Q162H | P15153 | protein_coding | deleterious_low_confidence(0.01) | possibly_damaging(0.606) | TCGA-IR-A3LA-01 | Cervix | cervical & endocervical cancer | Female | <65 | I/II | Chemotherapy | cisplatin | CR | |
| RAC2 | SNV | Missense_Mutation | rs758461304 | c.562G>A | p.Ala188Thr | p.A188T | P15153 | protein_coding | tolerated_low_confidence(0.09) | benign(0.011) | TCGA-CM-4747-01 | Colorectum | colon adenocarcinoma | Male | <65 | I/II | Chemotherapy | fluorouracil | SD |
| RAC2 | SNV | Missense_Mutation | c.197N>A | p.Arg66His | p.R66H | P15153 | protein_coding | deleterious_low_confidence(0) | probably_damaging(0.976) | TCGA-CM-6162-01 | Colorectum | colon adenocarcinoma | Female | <65 | III/IV | Chemotherapy | oxaliplatin | SD | |
| RAC2 | SNV | Missense_Mutation | c.304C>T | p.Arg102Trp | p.R102W | P15153 | protein_coding | deleterious_low_confidence(0) | probably_damaging(0.925) | TCGA-G4-6302-01 | Colorectum | colon adenocarcinoma | Female | >=65 | I/II | Unknown | Unknown | SD | |
| RAC2 | SNV | Missense_Mutation | novel | c.381N>T | p.Glu127Asp | p.E127D | P15153 | protein_coding | tolerated_low_confidence(0.11) | benign(0.005) | TCGA-F5-6814-01 | Colorectum | rectum adenocarcinoma | Male | <65 | I/II | Unknown | Unknown | SD |
| RAC2 | SNV | Missense_Mutation | novel | c.353N>G | p.Asp118Gly | p.D118G | P15153 | protein_coding | deleterious_low_confidence(0) | probably_damaging(0.996) | TCGA-AP-A051-01 | Endometrium | uterine corpus endometrioid carcinoma | Female | >=65 | I/II | Unknown | Unknown | SD |
| RAC2 | SNV | Missense_Mutation | novel | c.296N>T | p.Pro99Leu | p.P99L | P15153 | protein_coding | deleterious_low_confidence(0) | possibly_damaging(0.763) | TCGA-AP-A1DK-01 | Endometrium | uterine corpus endometrioid carcinoma | Female | <65 | I/II | Unknown | Unknown | SD |
| RAC2 | SNV | Missense_Mutation | novel | c.186G>T | p.Glu62Asp | p.E62D | P15153 | protein_coding | deleterious_low_confidence(0.04) | benign(0.102) | TCGA-B5-A1MX-01 | Endometrium | uterine corpus endometrioid carcinoma | Female | <65 | I/II | Hormone Therapy | megace | SD |
| Page: 1 2 3 |
Top |
Related drugs of malignant transformation related genes |
| Identification of chemicals and drugs interact with genes involved in malignant transfromation |
| (DGIdb 4.0) |
| Entrez ID | Symbol | Category | Interaction Types | Drug Claim Name | Drug Name | PMIDs |
| 5880 | RAC2 | NA | idarubicin | IDARUBICIN | 28485375 | |
| 5880 | RAC2 | NA | doxorubicin | DOXORUBICIN | 21048526 |
| Page: 1 |

Copyright 2023-Present -The University of Texas Health Science Center at Houston |