
|
|||||
|
 | |
| |
| |
| |
| |
| |
|
Gene: PPP2CA |
Gene summary for PPP2CA |
| Gene information | Species | Human | Gene symbol | PPP2CA | Gene ID | 5515 |
| Gene name | protein phosphatase 2 catalytic subunit alpha | |
| Gene Alias | NEDLBA | |
| Cytomap | 5q31.1 | |
| Gene Type | protein-coding | GO ID | GO:0000003 | UniProtAcc | B3KUN1 |
Top |
Malignant transformation analysis |
| Identification of the aberrant gene expression in precancerous and cancerous lesions by comparing the gene expression of stem-like cells in diseased tissues with normal stem cells |
| Entrez ID | Symbol | Replicates | Species | Organ | Tissue | Adj P-value | Log2FC | Malignancy |
| 5515 | PPP2CA | HTA11_3410_2000001011 | Human | Colorectum | AD | 1.83e-02 | 9.21e-02 | 0.0155 |
| 5515 | PPP2CA | HTA11_2487_2000001011 | Human | Colorectum | SER | 3.87e-02 | 1.35e-01 | -0.1808 |
| 5515 | PPP2CA | HTA11_1938_2000001011 | Human | Colorectum | AD | 2.24e-04 | 2.21e-01 | -0.0811 |
| 5515 | PPP2CA | HTA11_78_2000001011 | Human | Colorectum | AD | 8.26e-09 | 3.39e-01 | -0.1088 |
| 5515 | PPP2CA | HTA11_347_2000001011 | Human | Colorectum | AD | 3.16e-07 | 1.78e-01 | -0.1954 |
| 5515 | PPP2CA | HTA11_696_2000001011 | Human | Colorectum | AD | 3.85e-03 | 9.81e-02 | -0.1464 |
| 5515 | PPP2CA | HTA11_1391_2000001011 | Human | Colorectum | AD | 1.88e-04 | 1.37e-01 | -0.059 |
| 5515 | PPP2CA | HTA11_2992_2000001011 | Human | Colorectum | SER | 1.09e-02 | 2.14e-01 | -0.1706 |
| 5515 | PPP2CA | HTA11_5212_2000001011 | Human | Colorectum | AD | 5.12e-05 | 3.22e-01 | -0.2061 |
| 5515 | PPP2CA | HTA11_866_3004761011 | Human | Colorectum | AD | 2.04e-08 | 2.06e-01 | 0.096 |
| 5515 | PPP2CA | HTA11_10623_2000001011 | Human | Colorectum | AD | 4.46e-06 | 3.00e-01 | -0.0177 |
| 5515 | PPP2CA | HTA11_6801_2000001011 | Human | Colorectum | SER | 7.64e-10 | 5.22e-01 | 0.0171 |
| 5515 | PPP2CA | HTA11_7696_3000711011 | Human | Colorectum | AD | 9.56e-07 | 1.95e-01 | 0.0674 |
| 5515 | PPP2CA | HTA11_7469_2000001011 | Human | Colorectum | AD | 1.45e-04 | 3.74e-01 | -0.0124 |
| 5515 | PPP2CA | HTA11_99999970781_79442 | Human | Colorectum | MSS | 8.56e-30 | 5.42e-01 | 0.294 |
| 5515 | PPP2CA | HTA11_99999965062_69753 | Human | Colorectum | MSI-H | 1.40e-05 | 6.78e-01 | 0.3487 |
| 5515 | PPP2CA | HTA11_99999965104_69814 | Human | Colorectum | MSS | 1.93e-12 | 3.70e-01 | 0.281 |
| 5515 | PPP2CA | HTA11_99999971662_82457 | Human | Colorectum | MSS | 6.35e-15 | 3.05e-01 | 0.3859 |
| 5515 | PPP2CA | HTA11_99999973899_84307 | Human | Colorectum | MSS | 1.46e-02 | 1.55e-01 | 0.2585 |
| 5515 | PPP2CA | HTA11_99999974143_84620 | Human | Colorectum | MSS | 9.04e-05 | 1.33e-01 | 0.3005 |
| Page: 1 2 3 4 5 6 7 8 |
| Tissue | Expression Dynamics | Abbreviation |
| Colorectum (GSE201348) |  | FAP: Familial adenomatous polyposis |
| CRC: Colorectal cancer | ||
| Colorectum (HTA11) |  | AD: Adenomas |
| SER: Sessile serrated lesions | ||
| MSI-H: Microsatellite-high colorectal cancer | ||
| MSS: Microsatellite stable colorectal cancer | ||
| Esophagus |  | ESCC: Esophageal squamous cell carcinoma |
| HGIN: High-grade intraepithelial neoplasias | ||
| LGIN: Low-grade intraepithelial neoplasias | ||
| Liver | 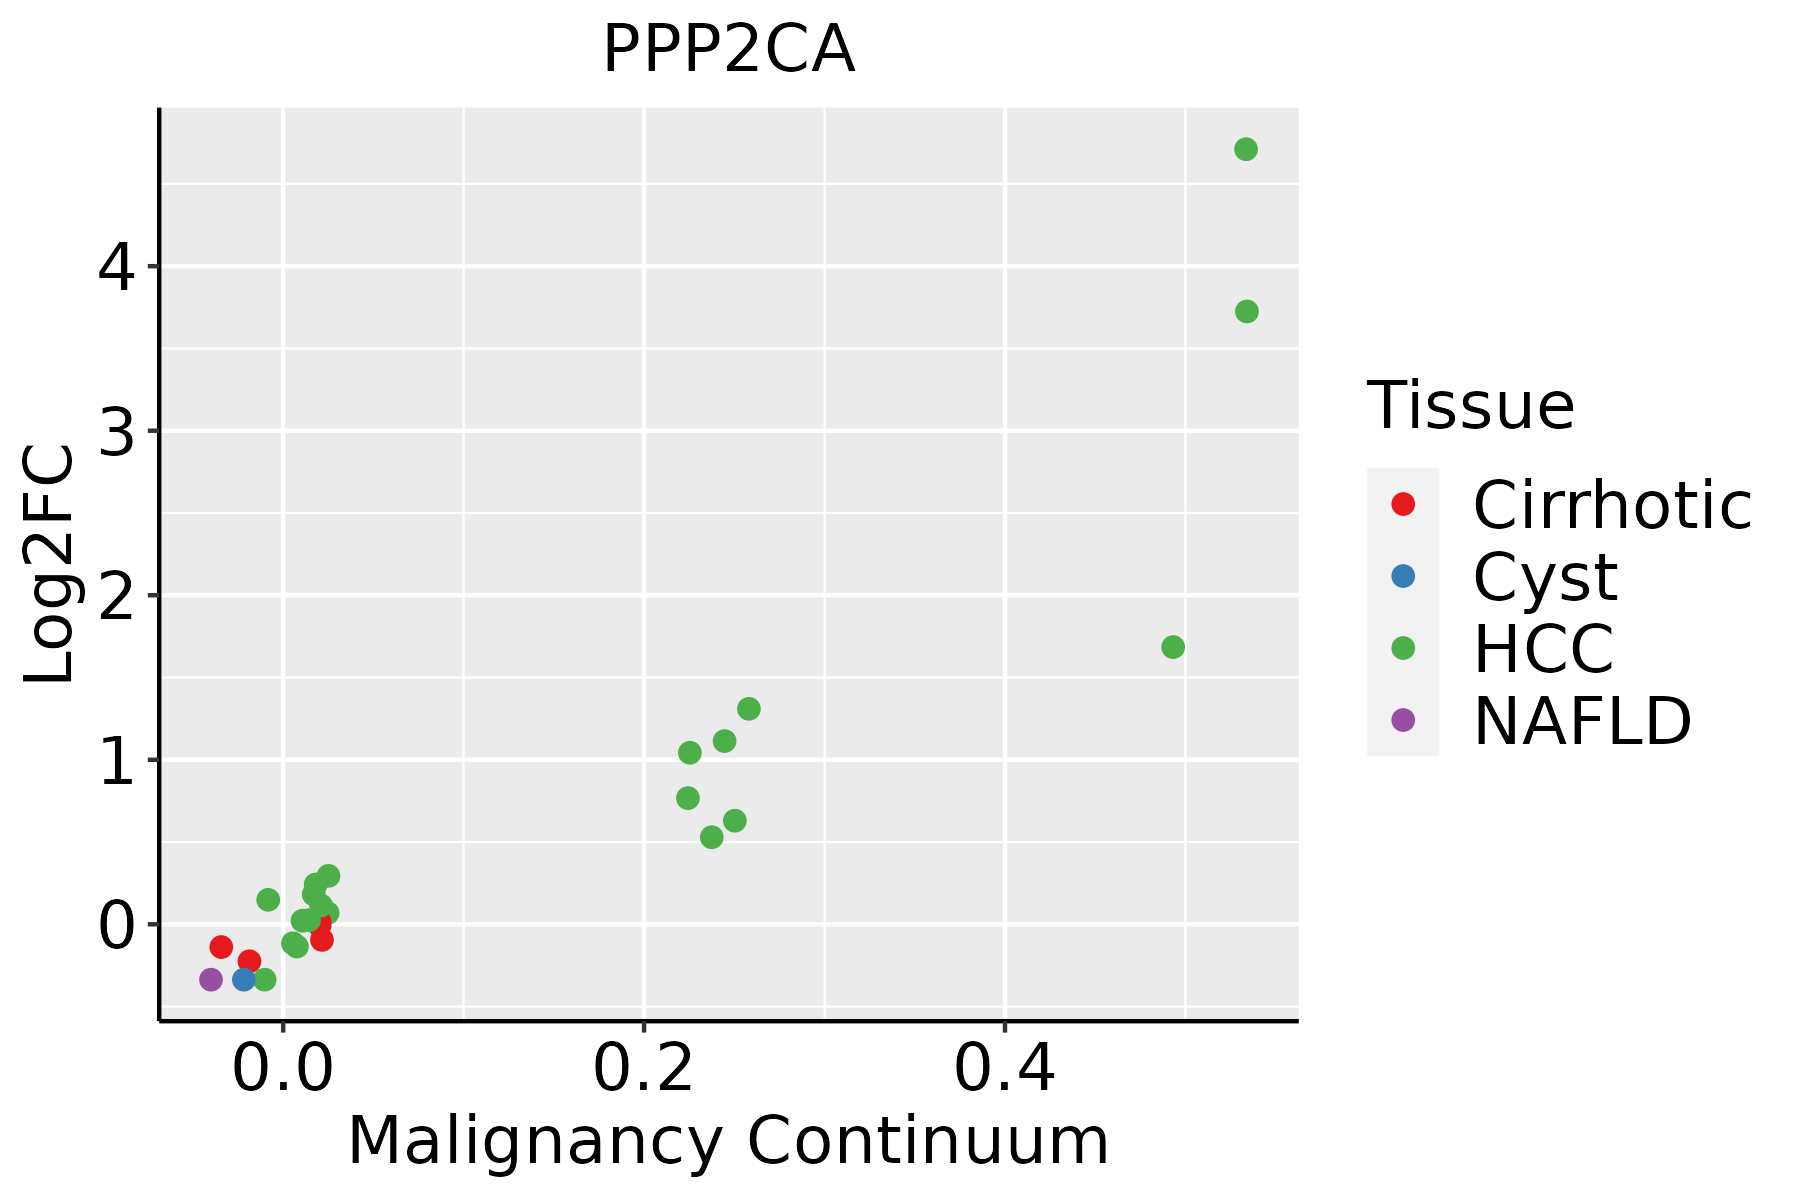 | HCC: Hepatocellular carcinoma |
| NAFLD: Non-alcoholic fatty liver disease | ||
| Oral Cavity | 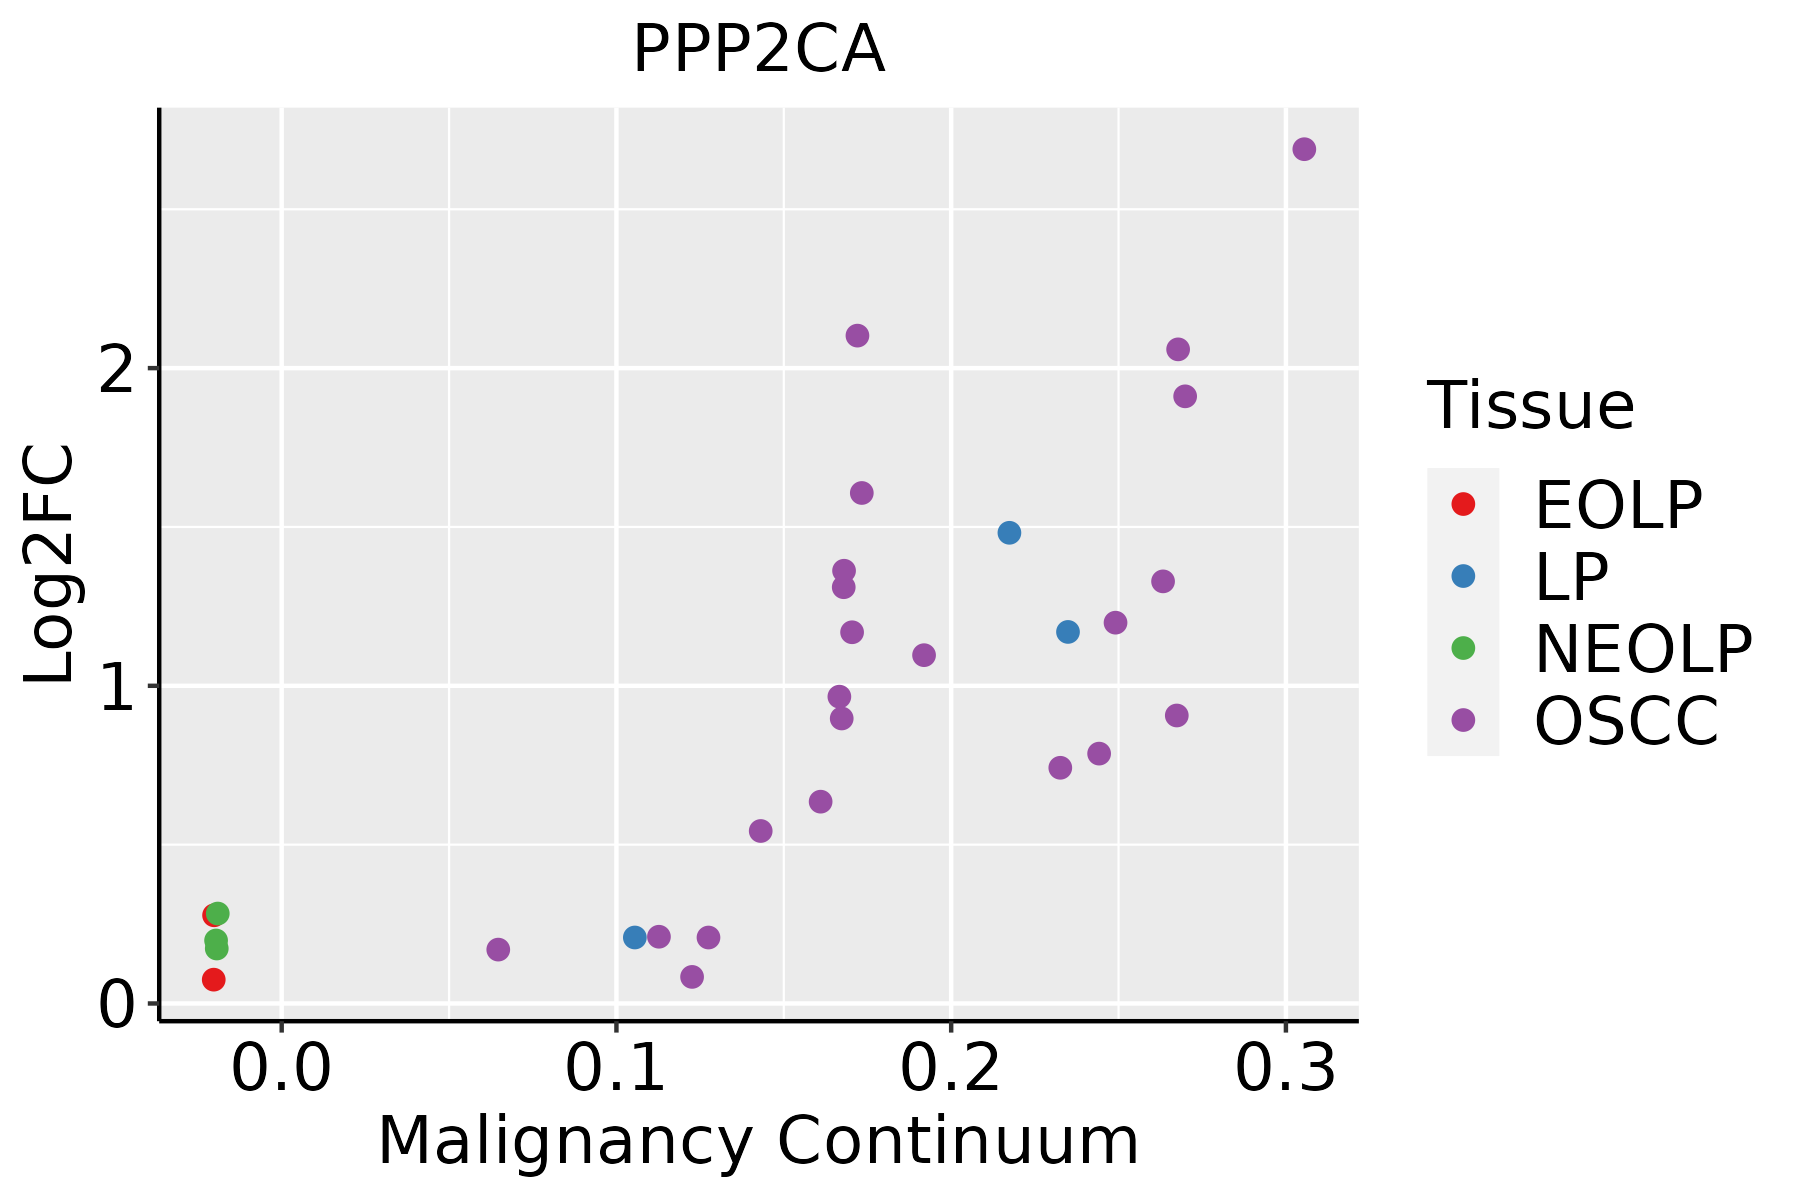 | EOLP: Erosive Oral lichen planus |
| LP: leukoplakia | ||
| NEOLP: Non-erosive oral lichen planus | ||
| OSCC: Oral squamous cell carcinoma | ||
| Skin | 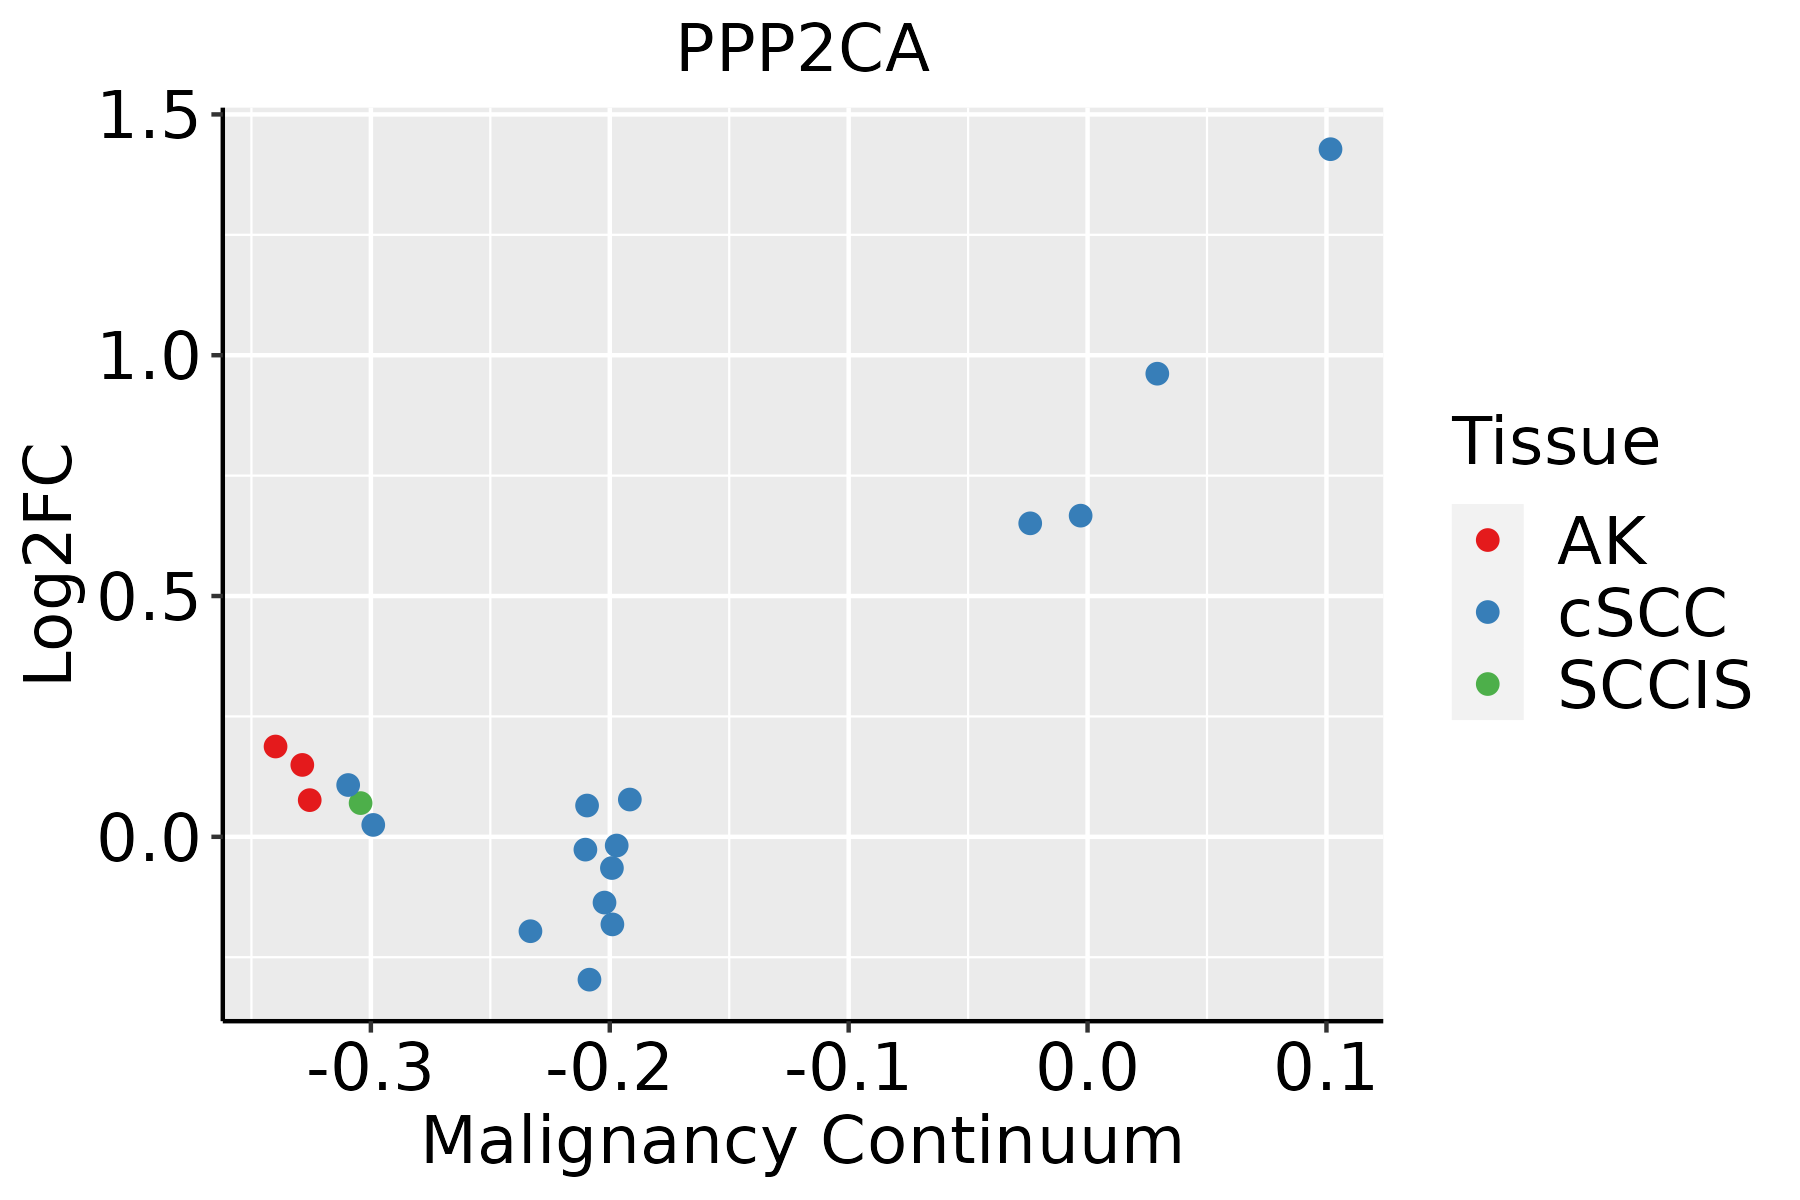 | AK: Actinic keratosis |
| cSCC: Cutaneous squamous cell carcinoma | ||
| SCCIS:squamous cell carcinoma in situ | ||
| Thyroid | 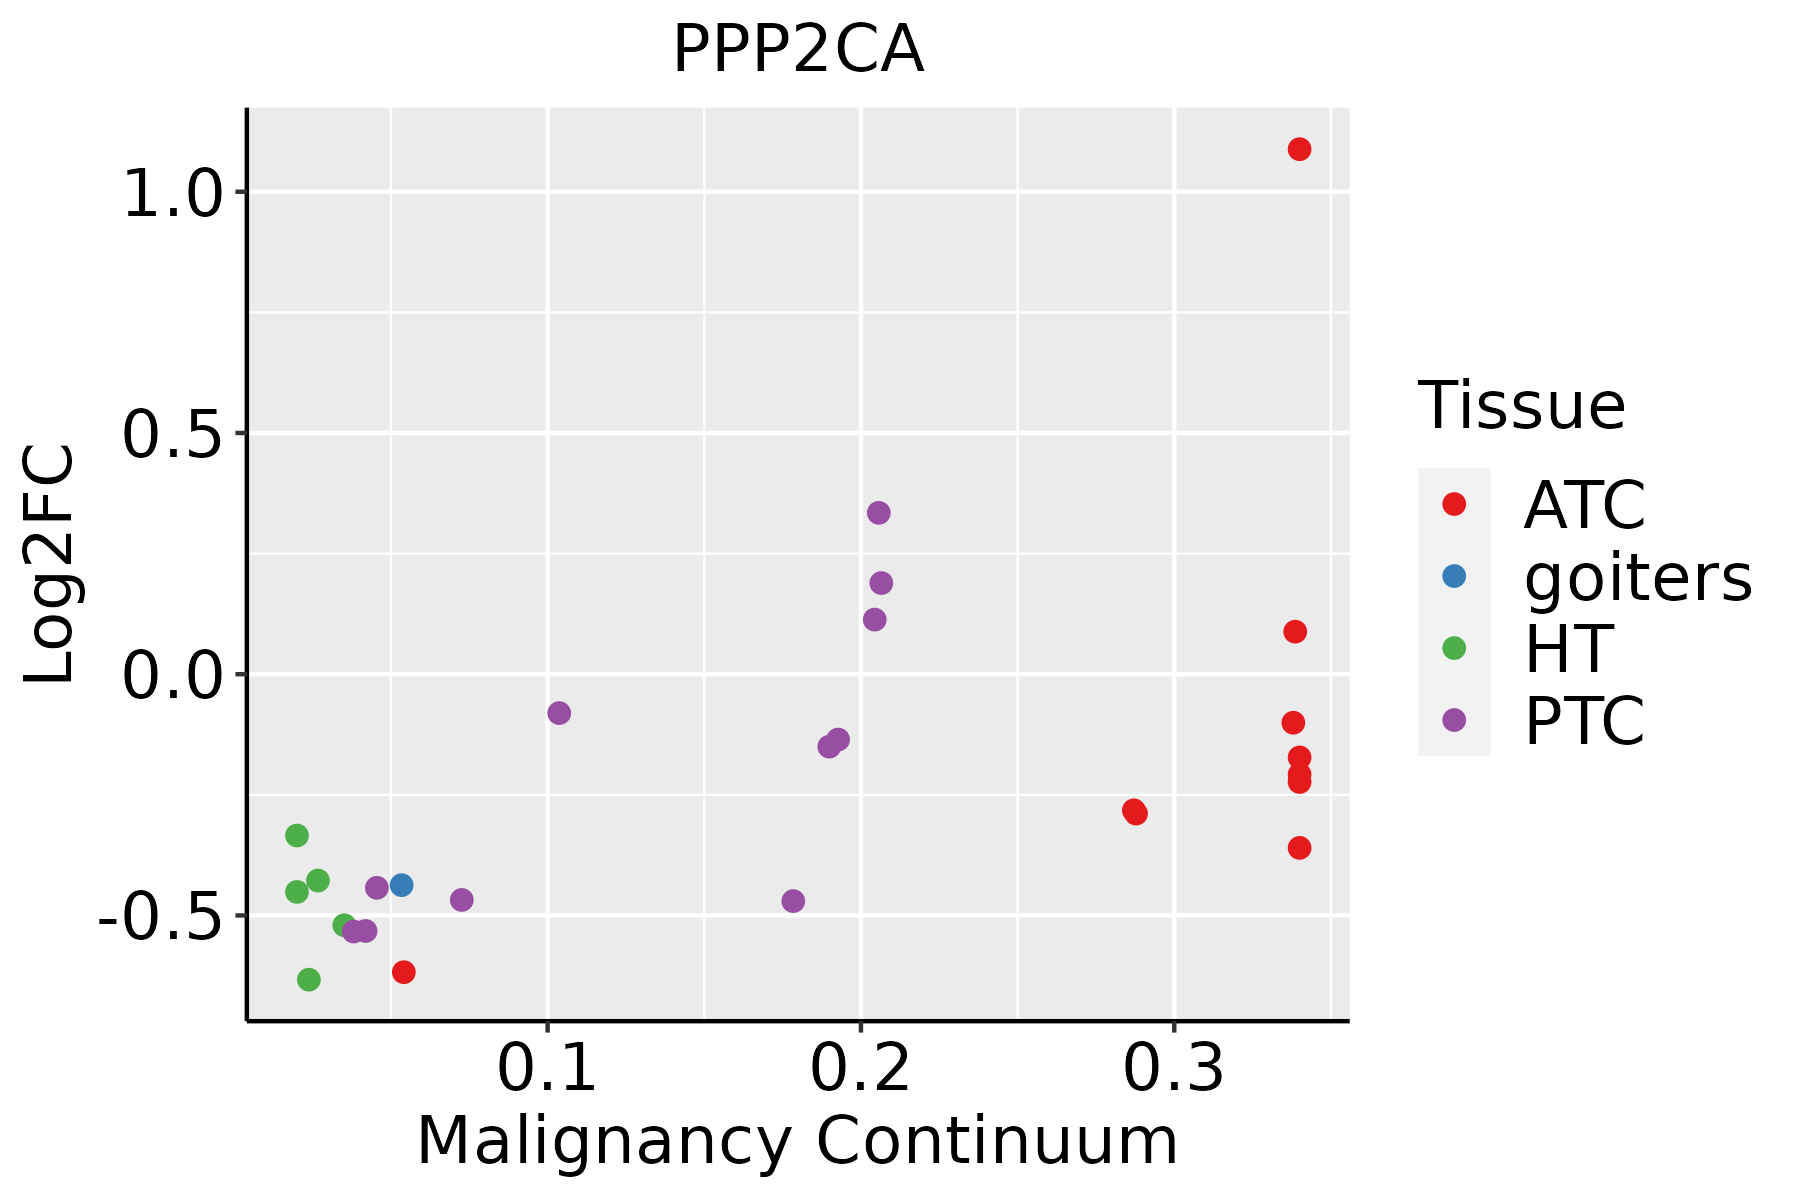 | ATC: Anaplastic thyroid cancer |
| HT: Hashimoto's thyroiditis | ||
| PTC: Papillary thyroid cancer |
| ∗log2FC in expression of this searched gene in stem-like cells from each diseased tissue sample relative to stem-like cells in normal samples in each tissue plotted against the malignancy continuum. Samples are colored based on if they are from different disease stage. |
Top |
Malignant transformation related pathway analysis |
| Find out the enriched GO biological processes and KEGG pathways involved in transition from healthy to precancer to cancer |
| Tissue | Disease Stage | Enriched GO biological Processes |
| Colorectum | AD |  |
| Colorectum | SER |  |
| Colorectum | MSS |  |
| Colorectum | MSI-H |  |
| Colorectum | FAP |  |
| ∗Top 15 enriched GO BP terms are showed in the bar plot of each disease state in each tissue. Each row represents a significant GO biological process which is colored according to the -log10(p.adjust). |
| Page: 1 2 3 4 5 6 7 8 9 |
| GO ID | Tissue | Disease Stage | Description | Gene Ratio | Bg Ratio | pvalue | p.adjust | Count |
| GO:00702622 | Oral cavity | NEOLP | peptidyl-serine dephosphorylation | 8/2005 | 19/18723 | 4.35e-04 | 3.94e-03 | 8 |
| GO:004586024 | Oral cavity | NEOLP | positive regulation of protein kinase activity | 63/2005 | 386/18723 | 4.41e-04 | 3.99e-03 | 63 |
| GO:00181082 | Oral cavity | NEOLP | peptidyl-tyrosine phosphorylation | 61/2005 | 375/18723 | 5.88e-04 | 5.08e-03 | 61 |
| GO:007190222 | Oral cavity | NEOLP | positive regulation of protein serine/threonine kinase activity | 37/2005 | 200/18723 | 6.45e-04 | 5.47e-03 | 37 |
| GO:001631122 | Oral cavity | NEOLP | dephosphorylation | 64/2005 | 417/18723 | 1.98e-03 | 1.33e-02 | 64 |
| GO:003367423 | Oral cavity | NEOLP | positive regulation of kinase activity | 70/2005 | 467/18723 | 2.33e-03 | 1.50e-02 | 70 |
| GO:00507302 | Oral cavity | NEOLP | regulation of peptidyl-tyrosine phosphorylation | 41/2005 | 264/18723 | 9.51e-03 | 4.50e-02 | 41 |
| GO:0008380112 | Skin | cSCC | RNA splicing | 263/4864 | 434/18723 | 2.45e-53 | 5.13e-50 | 263 |
| GO:005109827 | Skin | cSCC | regulation of binding | 152/4864 | 363/18723 | 2.21e-11 | 1.10e-09 | 152 |
| GO:000626012 | Skin | cSCC | DNA replication | 106/4864 | 260/18723 | 1.18e-07 | 2.77e-06 | 106 |
| GO:000647024 | Skin | cSCC | protein dephosphorylation | 111/4864 | 281/18723 | 4.10e-07 | 7.96e-06 | 111 |
| GO:001604925 | Skin | cSCC | cell growth | 173/4864 | 482/18723 | 7.21e-07 | 1.34e-05 | 173 |
| GO:004593628 | Skin | cSCC | negative regulation of phosphate metabolic process | 160/4864 | 441/18723 | 8.89e-07 | 1.63e-05 | 160 |
| GO:001056328 | Skin | cSCC | negative regulation of phosphorus metabolic process | 160/4864 | 442/18723 | 1.04e-06 | 1.85e-05 | 160 |
| GO:005109927 | Skin | cSCC | positive regulation of binding | 74/4864 | 173/18723 | 1.09e-06 | 1.93e-05 | 74 |
| GO:001605524 | Skin | cSCC | Wnt signaling pathway | 158/4864 | 444/18723 | 3.80e-06 | 5.70e-05 | 158 |
| GO:019873824 | Skin | cSCC | cell-cell signaling by wnt | 158/4864 | 446/18723 | 5.08e-06 | 7.38e-05 | 158 |
| GO:004339325 | Skin | cSCC | regulation of protein binding | 79/4864 | 196/18723 | 7.59e-06 | 1.04e-04 | 79 |
| GO:004232626 | Skin | cSCC | negative regulation of phosphorylation | 137/4864 | 385/18723 | 1.63e-05 | 1.99e-04 | 137 |
| GO:000193326 | Skin | cSCC | negative regulation of protein phosphorylation | 123/4864 | 342/18723 | 2.48e-05 | 2.82e-04 | 123 |
| Page: 1 2 3 4 5 6 7 8 9 10 11 12 13 14 15 16 17 18 19 20 21 |
| Pathway ID | Tissue | Disease Stage | Description | Gene Ratio | Bg Ratio | pvalue | p.adjust | qvalue | Count |
| hsa04530 | Colorectum | AD | Tight junction | 76/2092 | 169/8465 | 5.49e-09 | 9.69e-08 | 6.18e-08 | 76 |
| hsa04152 | Colorectum | AD | AMPK signaling pathway | 47/2092 | 121/8465 | 3.74e-04 | 2.82e-03 | 1.80e-03 | 47 |
| hsa05160 | Colorectum | AD | Hepatitis C | 54/2092 | 157/8465 | 3.87e-03 | 1.96e-02 | 1.25e-02 | 54 |
| hsa04140 | Colorectum | AD | Autophagy - animal | 49/2092 | 141/8465 | 4.58e-03 | 2.20e-02 | 1.40e-02 | 49 |
| hsa04071 | Colorectum | AD | Sphingolipid signaling pathway | 43/2092 | 121/8465 | 4.83e-03 | 2.28e-02 | 1.45e-02 | 43 |
| hsa04728 | Colorectum | AD | Dopaminergic synapse | 46/2092 | 132/8465 | 5.55e-03 | 2.48e-02 | 1.58e-02 | 46 |
| hsa03015 | Colorectum | AD | mRNA surveillance pathway | 35/2092 | 97/8465 | 7.95e-03 | 3.13e-02 | 2.00e-02 | 35 |
| hsa045301 | Colorectum | AD | Tight junction | 76/2092 | 169/8465 | 5.49e-09 | 9.69e-08 | 6.18e-08 | 76 |
| hsa041521 | Colorectum | AD | AMPK signaling pathway | 47/2092 | 121/8465 | 3.74e-04 | 2.82e-03 | 1.80e-03 | 47 |
| hsa051601 | Colorectum | AD | Hepatitis C | 54/2092 | 157/8465 | 3.87e-03 | 1.96e-02 | 1.25e-02 | 54 |
| hsa041401 | Colorectum | AD | Autophagy - animal | 49/2092 | 141/8465 | 4.58e-03 | 2.20e-02 | 1.40e-02 | 49 |
| hsa040711 | Colorectum | AD | Sphingolipid signaling pathway | 43/2092 | 121/8465 | 4.83e-03 | 2.28e-02 | 1.45e-02 | 43 |
| hsa047281 | Colorectum | AD | Dopaminergic synapse | 46/2092 | 132/8465 | 5.55e-03 | 2.48e-02 | 1.58e-02 | 46 |
| hsa030151 | Colorectum | AD | mRNA surveillance pathway | 35/2092 | 97/8465 | 7.95e-03 | 3.13e-02 | 2.00e-02 | 35 |
| hsa045302 | Colorectum | SER | Tight junction | 59/1580 | 169/8465 | 3.24e-07 | 5.98e-06 | 4.34e-06 | 59 |
| hsa047282 | Colorectum | SER | Dopaminergic synapse | 37/1580 | 132/8465 | 5.27e-03 | 3.28e-02 | 2.38e-02 | 37 |
| hsa041402 | Colorectum | SER | Autophagy - animal | 39/1580 | 141/8465 | 5.43e-03 | 3.28e-02 | 2.38e-02 | 39 |
| hsa04350 | Colorectum | SER | TGF-beta signaling pathway | 31/1580 | 108/8465 | 7.00e-03 | 3.77e-02 | 2.74e-02 | 31 |
| hsa045303 | Colorectum | SER | Tight junction | 59/1580 | 169/8465 | 3.24e-07 | 5.98e-06 | 4.34e-06 | 59 |
| hsa047283 | Colorectum | SER | Dopaminergic synapse | 37/1580 | 132/8465 | 5.27e-03 | 3.28e-02 | 2.38e-02 | 37 |
| Page: 1 2 3 4 5 6 7 8 9 10 |
Top |
Cell-cell communication analysis |
| Identification of potential cell-cell interactions between two cell types and their ligand-receptor pairs for different disease states |
| Ligand | Receptor | LRpair | Pathway | Tissue | Disease Stage |
| Page: 1 |
Top |
Single-cell gene regulatory network inference analysis |
| Find out the significant the regulons (TFs) and the target genes of each regulon across cell types for different disease states |
| TF | Cell Type | Tissue | Disease Stage | Target Gene | RSS | Regulon Activity |
| ∗The dot plots of a searched regulon are shown for all cell subpopulations in each disease state of each tissue based on the regulon specific score inferred using pySCENIC and by calculating the average expression. |
| Page: 1 |
Top |
Somatic mutation of malignant transformation related genes |
| Annotation of somatic variants for genes involved in malignant transformation |
| Hugo Symbol | Variant Class | Variant Classification | dbSNP RS | HGVSc | HGVSp | HGVSp Short | SWISSPROT | BIOTYPE | SIFT | PolyPhen | Tumor Sample Barcode | Tissue | Histology | Sex | Age | Stage | Therapy Types | Drugs | Outcome |
| PPP2CA | SNV | Missense_Mutation | c.460N>T | p.Pro154Ser | p.P154S | P67775 | protein_coding | tolerated(0.22) | possibly_damaging(0.895) | TCGA-A8-A08O-01 | Breast | breast invasive carcinoma | Female | <65 | III/IV | Chemotherapy | docetaxel | PD | |
| PPP2CA | SNV | Missense_Mutation | novel | c.889G>A | p.Glu297Lys | p.E297K | P67775 | protein_coding | tolerated(0.17) | benign(0.003) | TCGA-BH-A2L8-01 | Breast | breast invasive carcinoma | Female | <65 | I/II | Chemotherapy | cytoxan | CR |
| PPP2CA | SNV | Missense_Mutation | novel | c.307N>T | p.Leu103Phe | p.L103F | P67775 | protein_coding | deleterious(0.04) | benign(0.412) | TCGA-PE-A5DE-01 | Breast | breast invasive carcinoma | Female | <65 | I/II | Chemotherapy | taxotere | CR |
| PPP2CA | insertion | Frame_Shift_Ins | novel | c.112_113insCAGGCGTCTGCCACCACGCCCG | p.Ile38ThrfsTer34 | p.I38Tfs*34 | P67775 | protein_coding | TCGA-AO-A0JB-01 | Breast | breast invasive carcinoma | Female | <65 | III/IV | Chemotherapy | cyclophosphamide | SD | ||
| PPP2CA | SNV | Missense_Mutation | novel | c.904C>T | p.Arg302Cys | p.R302C | P67775 | protein_coding | deleterious(0) | possibly_damaging(0.873) | TCGA-2W-A8YY-01 | Cervix | cervical & endocervical cancer | Female | <65 | I/II | Chemotherapy | cisplatin | CR |
| PPP2CA | SNV | Missense_Mutation | novel | c.70N>C | p.Ser24Pro | p.S24P | P67775 | protein_coding | tolerated(0.42) | benign(0) | TCGA-FU-A3HZ-01 | Cervix | cervical & endocervical cancer | Female | <65 | I/II | Chemotherapy | cisplatin | CR |
| PPP2CA | SNV | Missense_Mutation | c.617G>A | p.Arg206His | p.R206H | P67775 | protein_coding | tolerated(0.13) | benign(0.009) | TCGA-A6-6781-01 | Colorectum | colon adenocarcinoma | Male | <65 | III/IV | Chemotherapy | oxaliplatin | SD | |
| PPP2CA | SNV | Missense_Mutation | novel | c.838N>A | p.Asp280Asn | p.D280N | P67775 | protein_coding | deleterious(0.01) | benign(0.034) | TCGA-A5-A0G2-01 | Endometrium | uterine corpus endometrioid carcinoma | Female | <65 | III/IV | Unknown | Unknown | SD |
| PPP2CA | SNV | Missense_Mutation | novel | c.399N>G | p.Cys133Trp | p.C133W | P67775 | protein_coding | deleterious(0) | probably_damaging(0.999) | TCGA-A5-A0G2-01 | Endometrium | uterine corpus endometrioid carcinoma | Female | <65 | III/IV | Unknown | Unknown | SD |
| PPP2CA | SNV | Missense_Mutation | novel | c.193N>G | p.Leu65Val | p.L65V | P67775 | protein_coding | deleterious(0.04) | benign(0.237) | TCGA-AJ-A3QS-01 | Endometrium | uterine corpus endometrioid carcinoma | Female | <65 | III/IV | Chemotherapy | cisplatin | CR |
| Page: 1 2 3 4 |
Top |
Related drugs of malignant transformation related genes |
| Identification of chemicals and drugs interact with genes involved in malignant transfromation |
| (DGIdb 4.0) |
| Entrez ID | Symbol | Category | Interaction Types | Drug Claim Name | Drug Name | PMIDs |
| 5515 | PPP2CA | PROTEIN PHOSPHATASE, ENZYME, KINASE | VP-102 | |||
| 5515 | PPP2CA | PROTEIN PHOSPHATASE, ENZYME, KINASE | LB-100 | LB-100 |
| Page: 1 |

Copyright 2023-Present -The University of Texas Health Science Center at Houston |