
|
|||||
|
 | |
| |
| |
| |
| |
| |
|
Gene: PEX1 |
Gene summary for PEX1 |
| Gene information | Species | Human | Gene symbol | PEX1 | Gene ID | 5189 |
| Gene name | peroxisomal biogenesis factor 1 | |
| Gene Alias | HMLR1 | |
| Cytomap | 7q21.2 | |
| Gene Type | protein-coding | GO ID | GO:0006605 | UniProtAcc | O43933 |
Top |
Malignant transformation analysis |
| Identification of the aberrant gene expression in precancerous and cancerous lesions by comparing the gene expression of stem-like cells in diseased tissues with normal stem cells |
| Entrez ID | Symbol | Replicates | Species | Organ | Tissue | Adj P-value | Log2FC | Malignancy |
| 5189 | PEX1 | LZE4T | Human | Esophagus | ESCC | 8.05e-05 | 2.08e-01 | 0.0811 |
| 5189 | PEX1 | LZE7T | Human | Esophagus | ESCC | 1.39e-07 | 3.39e-01 | 0.0667 |
| 5189 | PEX1 | LZE24T | Human | Esophagus | ESCC | 1.37e-06 | 1.61e-01 | 0.0596 |
| 5189 | PEX1 | P1T-E | Human | Esophagus | ESCC | 1.90e-02 | 3.04e-01 | 0.0875 |
| 5189 | PEX1 | P2T-E | Human | Esophagus | ESCC | 1.37e-22 | 4.13e-01 | 0.1177 |
| 5189 | PEX1 | P4T-E | Human | Esophagus | ESCC | 1.03e-15 | 3.54e-01 | 0.1323 |
| 5189 | PEX1 | P5T-E | Human | Esophagus | ESCC | 2.27e-03 | 4.62e-02 | 0.1327 |
| 5189 | PEX1 | P8T-E | Human | Esophagus | ESCC | 9.34e-10 | 2.11e-01 | 0.0889 |
| 5189 | PEX1 | P9T-E | Human | Esophagus | ESCC | 1.40e-05 | 1.25e-01 | 0.1131 |
| 5189 | PEX1 | P10T-E | Human | Esophagus | ESCC | 8.54e-15 | 1.59e-01 | 0.116 |
| 5189 | PEX1 | P11T-E | Human | Esophagus | ESCC | 9.80e-07 | 3.05e-01 | 0.1426 |
| 5189 | PEX1 | P12T-E | Human | Esophagus | ESCC | 1.76e-18 | 4.56e-01 | 0.1122 |
| 5189 | PEX1 | P15T-E | Human | Esophagus | ESCC | 3.14e-11 | 2.51e-01 | 0.1149 |
| 5189 | PEX1 | P16T-E | Human | Esophagus | ESCC | 4.53e-50 | 8.54e-01 | 0.1153 |
| 5189 | PEX1 | P17T-E | Human | Esophagus | ESCC | 2.76e-04 | 2.40e-01 | 0.1278 |
| 5189 | PEX1 | P20T-E | Human | Esophagus | ESCC | 3.28e-16 | 4.04e-01 | 0.1124 |
| 5189 | PEX1 | P21T-E | Human | Esophagus | ESCC | 4.33e-13 | 2.01e-01 | 0.1617 |
| 5189 | PEX1 | P22T-E | Human | Esophagus | ESCC | 7.19e-09 | 1.54e-01 | 0.1236 |
| 5189 | PEX1 | P23T-E | Human | Esophagus | ESCC | 3.24e-13 | 4.24e-01 | 0.108 |
| 5189 | PEX1 | P24T-E | Human | Esophagus | ESCC | 3.24e-03 | 9.88e-02 | 0.1287 |
| Page: 1 2 3 4 |
| Tissue | Expression Dynamics | Abbreviation |
| Esophagus | 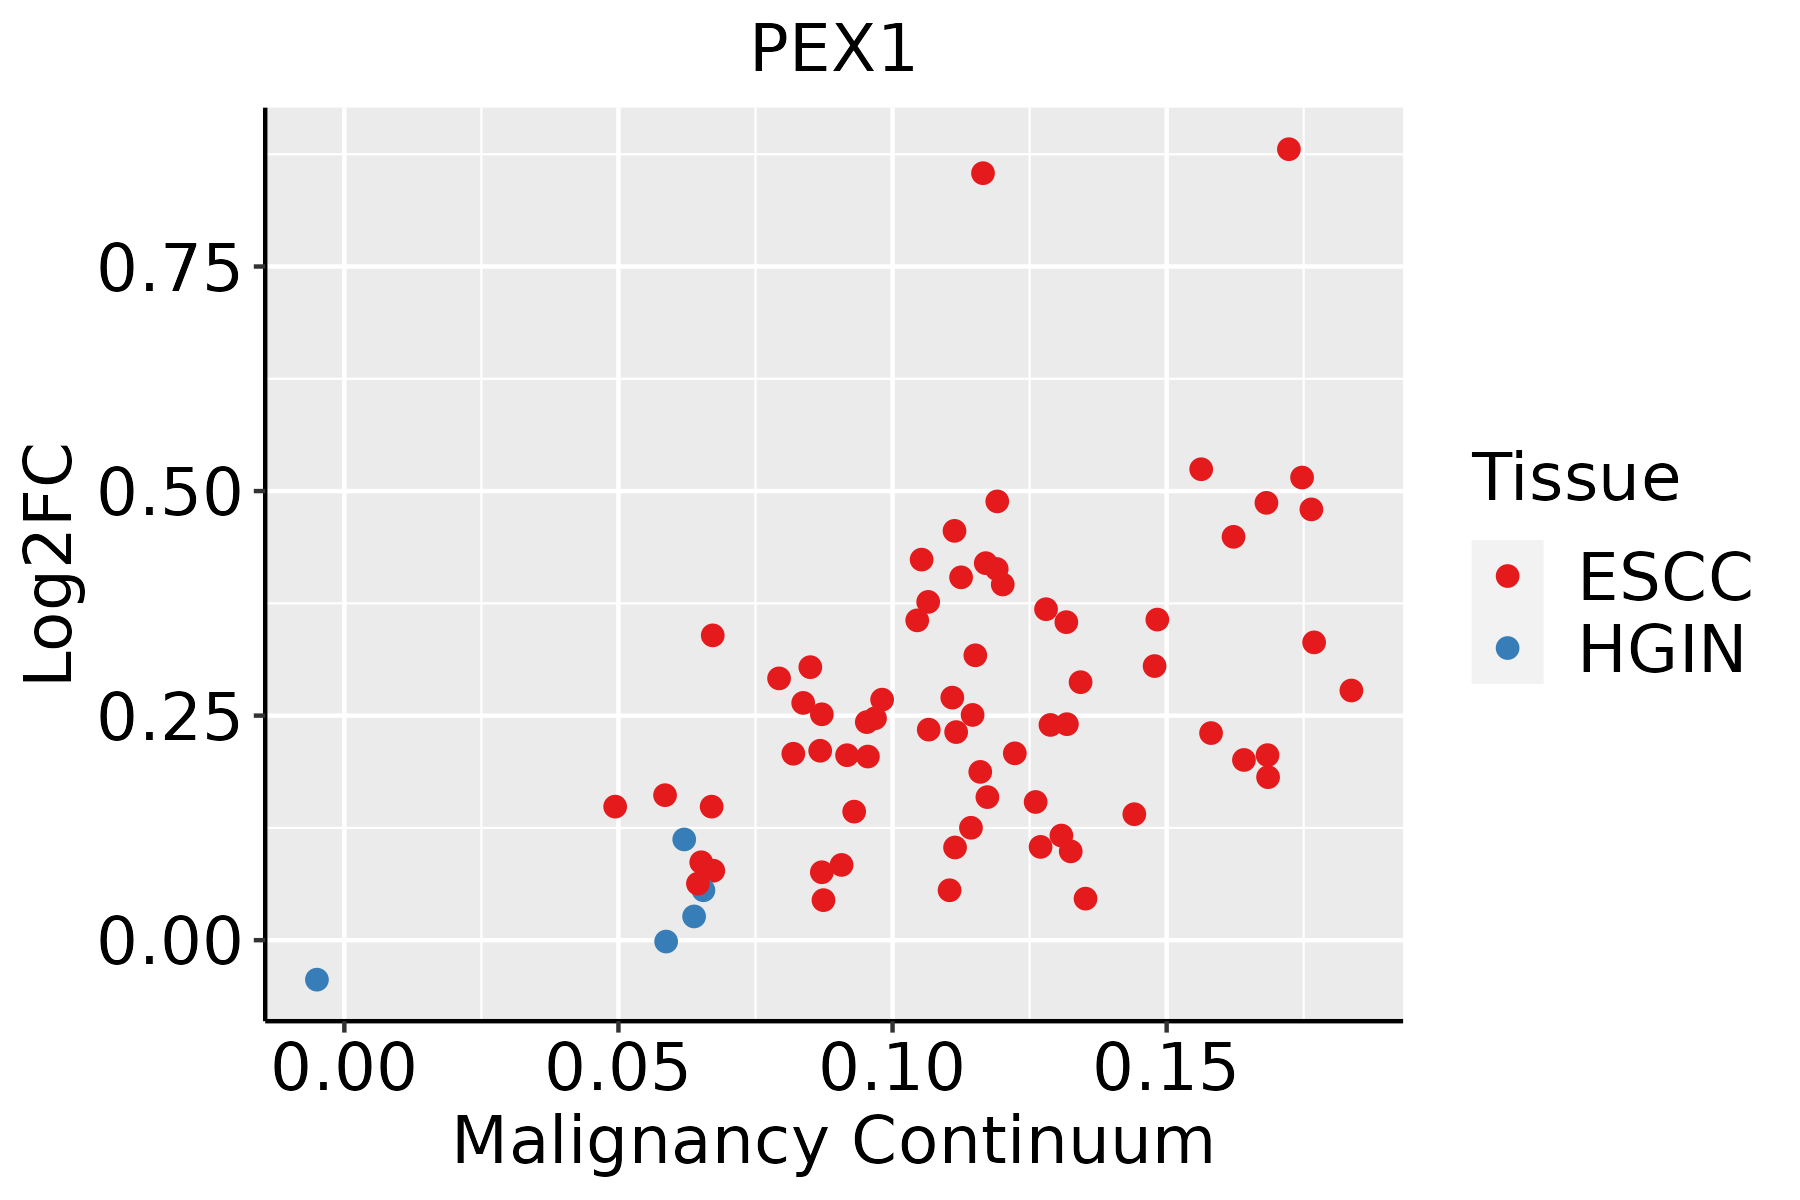 | ESCC: Esophageal squamous cell carcinoma |
| HGIN: High-grade intraepithelial neoplasias | ||
| LGIN: Low-grade intraepithelial neoplasias | ||
| Thyroid |  | ATC: Anaplastic thyroid cancer |
| HT: Hashimoto's thyroiditis | ||
| PTC: Papillary thyroid cancer |
| ∗log2FC in expression of this searched gene in stem-like cells from each diseased tissue sample relative to stem-like cells in normal samples in each tissue plotted against the malignancy continuum. Samples are colored based on if they are from different disease stage. |
Top |
Malignant transformation related pathway analysis |
| Find out the enriched GO biological processes and KEGG pathways involved in transition from healthy to precancer to cancer |
| Tissue | Disease Stage | Enriched GO biological Processes |
| Colorectum | AD |  |
| Colorectum | SER |  |
| Colorectum | MSS |  |
| Colorectum | MSI-H |  |
| Colorectum | FAP |  |
| ∗Top 15 enriched GO BP terms are showed in the bar plot of each disease state in each tissue. Each row represents a significant GO biological process which is colored according to the -log10(p.adjust). |
| Page: 1 2 3 4 5 6 7 8 9 |
| GO ID | Tissue | Disease Stage | Description | Gene Ratio | Bg Ratio | pvalue | p.adjust | Count |
| GO:004339310 | Endometrium | AEH | regulation of protein binding | 42/2100 | 196/18723 | 2.58e-05 | 4.86e-04 | 42 |
| GO:00400134 | Endometrium | AEH | negative regulation of locomotion | 70/2100 | 391/18723 | 4.95e-05 | 8.05e-04 | 70 |
| GO:00329848 | Endometrium | AEH | protein-containing complex disassembly | 45/2100 | 224/18723 | 7.16e-05 | 1.10e-03 | 45 |
| GO:00194399 | Endometrium | AEH | aromatic compound catabolic process | 80/2100 | 467/18723 | 7.21e-05 | 1.10e-03 | 80 |
| GO:003461415 | Endometrium | AEH | cellular response to reactive oxygen species | 34/2100 | 155/18723 | 9.00e-05 | 1.30e-03 | 34 |
| GO:19013619 | Endometrium | AEH | organic cyclic compound catabolic process | 83/2100 | 495/18723 | 1.13e-04 | 1.60e-03 | 83 |
| GO:19016539 | Endometrium | AEH | cellular response to peptide | 64/2100 | 359/18723 | 1.16e-04 | 1.63e-03 | 64 |
| GO:004545410 | Endometrium | AEH | cell redox homeostasis | 12/2100 | 35/18723 | 2.69e-04 | 3.12e-03 | 12 |
| GO:00457877 | Endometrium | AEH | positive regulation of cell cycle | 56/2100 | 313/18723 | 2.73e-04 | 3.14e-03 | 56 |
| GO:004343410 | Endometrium | AEH | response to peptide hormone | 70/2100 | 414/18723 | 2.93e-04 | 3.35e-03 | 70 |
| GO:000756810 | Endometrium | AEH | aging | 59/2100 | 339/18723 | 4.00e-04 | 4.28e-03 | 59 |
| GO:00307058 | Endometrium | AEH | cytoskeleton-dependent intracellular transport | 38/2100 | 195/18723 | 4.72e-04 | 4.91e-03 | 38 |
| GO:000072310 | Endometrium | AEH | telomere maintenance | 28/2100 | 131/18723 | 5.62e-04 | 5.62e-03 | 28 |
| GO:005110010 | Endometrium | AEH | negative regulation of binding | 32/2100 | 162/18723 | 1.00e-03 | 8.94e-03 | 32 |
| GO:005159116 | Endometrium | AEH | response to cAMP | 21/2100 | 93/18723 | 1.27e-03 | 1.09e-02 | 21 |
| GO:00713758 | Endometrium | AEH | cellular response to peptide hormone stimulus | 49/2100 | 290/18723 | 2.24e-03 | 1.72e-02 | 49 |
| GO:00447726 | Endometrium | AEH | mitotic cell cycle phase transition | 67/2100 | 424/18723 | 2.37e-03 | 1.78e-02 | 67 |
| GO:00510905 | Endometrium | AEH | regulation of DNA-binding transcription factor activity | 69/2100 | 440/18723 | 2.51e-03 | 1.87e-02 | 69 |
| GO:00170389 | Endometrium | AEH | protein import | 37/2100 | 206/18723 | 2.56e-03 | 1.89e-02 | 37 |
| GO:00900686 | Endometrium | AEH | positive regulation of cell cycle process | 41/2100 | 236/18723 | 2.94e-03 | 2.09e-02 | 41 |
| Page: 1 2 3 4 5 6 7 8 9 10 11 12 13 14 15 16 17 18 19 20 21 22 23 24 25 26 27 28 29 30 31 32 33 34 35 36 37 38 39 40 41 42 43 44 45 46 47 48 49 50 51 52 53 54 55 56 57 |
| Pathway ID | Tissue | Disease Stage | Description | Gene Ratio | Bg Ratio | pvalue | p.adjust | qvalue | Count |
| hsa041467 | Esophagus | ESCC | Peroxisome | 55/4205 | 82/8465 | 1.04e-03 | 3.27e-03 | 1.68e-03 | 55 |
| hsa0414612 | Esophagus | ESCC | Peroxisome | 55/4205 | 82/8465 | 1.04e-03 | 3.27e-03 | 1.68e-03 | 55 |
| Page: 1 |
Top |
Cell-cell communication analysis |
| Identification of potential cell-cell interactions between two cell types and their ligand-receptor pairs for different disease states |
| Ligand | Receptor | LRpair | Pathway | Tissue | Disease Stage |
| Page: 1 |
Top |
Single-cell gene regulatory network inference analysis |
| Find out the significant the regulons (TFs) and the target genes of each regulon across cell types for different disease states |
| TF | Cell Type | Tissue | Disease Stage | Target Gene | RSS | Regulon Activity |
| ∗The dot plots of a searched regulon are shown for all cell subpopulations in each disease state of each tissue based on the regulon specific score inferred using pySCENIC and by calculating the average expression. |
| Page: 1 |
Top |
Somatic mutation of malignant transformation related genes |
| Annotation of somatic variants for genes involved in malignant transformation |
| Hugo Symbol | Variant Class | Variant Classification | dbSNP RS | HGVSc | HGVSp | HGVSp Short | SWISSPROT | BIOTYPE | SIFT | PolyPhen | Tumor Sample Barcode | Tissue | Histology | Sex | Age | Stage | Therapy Types | Drugs | Outcome |
| PEX1 | SNV | Missense_Mutation | c.749G>A | p.Gly250Glu | p.G250E | O43933 | protein_coding | tolerated(0.06) | possibly_damaging(0.896) | TCGA-A2-A0YK-01 | Breast | breast invasive carcinoma | Female | <65 | I/II | Chemotherapy | cytoxan | SD | |
| PEX1 | SNV | Missense_Mutation | novel | c.171C>A | p.Phe57Leu | p.F57L | O43933 | protein_coding | tolerated(0.09) | benign(0.298) | TCGA-AN-A046-01 | Breast | breast invasive carcinoma | Female | >=65 | I/II | Unknown | Unknown | SD |
| PEX1 | SNV | Missense_Mutation | novel | c.3025N>C | p.Asp1009His | p.D1009H | O43933 | protein_coding | deleterious(0) | probably_damaging(0.946) | TCGA-BH-A0B6-01 | Breast | breast invasive carcinoma | Female | <65 | I/II | Unknown | Unknown | SD |
| PEX1 | SNV | Missense_Mutation | rs780349018 | c.1285G>A | p.Val429Ile | p.V429I | O43933 | protein_coding | tolerated(0.11) | benign(0.083) | TCGA-BH-A0BP-01 | Breast | breast invasive carcinoma | Female | >=65 | I/II | Unknown | Unknown | SD |
| PEX1 | SNV | Missense_Mutation | c.3581A>G | p.Asp1194Gly | p.D1194G | O43933 | protein_coding | deleterious(0) | benign(0.133) | TCGA-E9-A1R7-01 | Breast | breast invasive carcinoma | Female | <65 | I/II | Hormone Therapy | fareston | SD | |
| PEX1 | SNV | Missense_Mutation | c.3146N>G | p.Ala1049Gly | p.A1049G | O43933 | protein_coding | deleterious(0) | probably_damaging(0.949) | TCGA-E9-A244-01 | Breast | breast invasive carcinoma | Female | <65 | I/II | Chemotherapy | cyclophosphamide | SD | |
| PEX1 | SNV | Missense_Mutation | c.1970N>G | p.Ser657Cys | p.S657C | O43933 | protein_coding | deleterious(0) | probably_damaging(0.995) | TCGA-GM-A2DO-01 | Breast | breast invasive carcinoma | Female | <65 | I/II | Hormone Therapy | tamoxiphen | CR | |
| PEX1 | insertion | Frame_Shift_Ins | novel | c.429dupT | p.Pro144SerfsTer5 | p.P144Sfs*5 | O43933 | protein_coding | TCGA-A8-A09Z-01 | Breast | breast invasive carcinoma | Female | >=65 | I/II | Unknown | Unknown | SD | ||
| PEX1 | insertion | Frame_Shift_Ins | novel | c.437_438insCTTAGATA | p.Trp146CysfsTer18 | p.W146Cfs*18 | O43933 | protein_coding | TCGA-AO-A0JB-01 | Breast | breast invasive carcinoma | Female | <65 | III/IV | Chemotherapy | cyclophosphamide | SD | ||
| PEX1 | SNV | Missense_Mutation | novel | c.1883N>G | p.Asp628Gly | p.D628G | O43933 | protein_coding | deleterious(0.01) | benign(0.024) | TCGA-5M-AAT6-01 | Colorectum | colon adenocarcinoma | Female | <65 | III/IV | Unknown | Unknown | PD |
| Page: 1 2 3 4 5 6 7 8 9 10 11 12 |
Top |
Related drugs of malignant transformation related genes |
| Identification of chemicals and drugs interact with genes involved in malignant transfromation |
| (DGIdb 4.0) |
| Entrez ID | Symbol | Category | Interaction Types | Drug Claim Name | Drug Name | PMIDs |
| Page: 1 |

Copyright 2023-Present -The University of Texas Health Science Center at Houston |