Schematic overview of the cellular and molecular mechanisms involved in the cancer progression, including the proposed cellular and molecular mechanisms in cancer cells trajectory. AT1: alveolar type 1 cells; AT2: alveolar type 2 cells; AAH: atypical adenomatous hyperplasia; AIS: adenocarcinoma in situ; MIA: minimally invasive adenocarcinoma; IA: invasive adenocarcinoma; EMT: epithelial-mesenchymal transition

Home

Download

Statistics

Help

Contact

Center for Computational Systems Medicine
leaf

Gene summary

leaf

Malignant transformation analysis

leaf

Malignant transformation related pathway analysis

leaf

Cell-cell communication analysis

leaf

Single-cell gene regulatory network inference analysis

leaf

Somatic mutation of malignant transformation related genes

leaf

Related drugs of malignant transformation related genes

Gene: MAP4K4

Gene summary for MAP4K4

check button Gene summary.

Gene informationSpeciesHuman
Gene symbol

MAP4K4

Gene ID

9448

Gene namemitogen-activated protein kinase kinase kinase kinase 4
Gene AliasFLH21957
Cytomap2q11.2
Gene Typeprotein-coding
GO ID

GO:0000165

UniProtAcc

O95819


Top

Malignant transformation analysis

check button Identification of the aberrant gene expression in precancerous and cancerous lesions by comparing the gene expression of stem-like cells in diseased tissues with normal stem cells
check button Malignant transformation involving gene list.
Entrez IDSymbolReplicatesSpeciesOrganTissueAdj P-valueLog2FCMalignancy
9448MAP4K4LZE2THumanEsophagusESCC5.45e-089.26e-010.082
9448MAP4K4LZE4THumanEsophagusESCC1.90e-141.01e-010.0811
9448MAP4K4LZE7THumanEsophagusESCC6.00e-095.96e-010.0667
9448MAP4K4LZE22THumanEsophagusESCC2.98e-033.74e-010.068
9448MAP4K4LZE24THumanEsophagusESCC1.31e-121.70e-010.0596
9448MAP4K4LZE6THumanEsophagusESCC2.12e-031.10e-010.0845
9448MAP4K4P2T-EHumanEsophagusESCC1.75e-142.93e-010.1177
9448MAP4K4P4T-EHumanEsophagusESCC1.09e-184.98e-010.1323
9448MAP4K4P5T-EHumanEsophagusESCC1.79e-202.41e-010.1327
9448MAP4K4P8T-EHumanEsophagusESCC3.31e-232.34e-010.0889
9448MAP4K4P9T-EHumanEsophagusESCC2.70e-175.34e-010.1131
9448MAP4K4P10T-EHumanEsophagusESCC5.54e-417.78e-010.116
9448MAP4K4P11T-EHumanEsophagusESCC4.03e-114.21e-010.1426
9448MAP4K4P12T-EHumanEsophagusESCC1.64e-143.33e-010.1122
9448MAP4K4P15T-EHumanEsophagusESCC6.75e-145.09e-010.1149
9448MAP4K4P16T-EHumanEsophagusESCC2.64e-152.47e-010.1153
9448MAP4K4P17T-EHumanEsophagusESCC9.37e-092.46e-010.1278
9448MAP4K4P19T-EHumanEsophagusESCC3.83e-067.37e-010.1662
9448MAP4K4P21T-EHumanEsophagusESCC1.17e-336.90e-010.1617
9448MAP4K4P22T-EHumanEsophagusESCC8.00e-283.64e-010.1236
Page: 1 2 3 4 5 6 7 8 

check button Transcriptomic changes along malignancy continuum.
TissueExpression DynamicsAbbreviation
EsophagusThe image shows the transcriptomic changes along malignancy continuum.log2FC in expression of this searched gene in stem-like cells from each diseased tissue sample relative to stem-like cells in normal samples in each tissue plotted against the malignancy continuum. Samples are colored based on if they are from different disease stage.ESCC: Esophageal squamous cell carcinoma
HGIN: High-grade intraepithelial neoplasias
LGIN: Low-grade intraepithelial neoplasias
LiverThe image shows the transcriptomic changes along malignancy continuum.log2FC in expression of this searched gene in stem-like cells from each diseased tissue sample relative to stem-like cells in normal samples in each tissue plotted against the malignancy continuum. Samples are colored based on if they are from different disease stage.HCC: Hepatocellular carcinoma
NAFLD: Non-alcoholic fatty liver disease
LungThe image shows the transcriptomic changes along malignancy continuum.log2FC in expression of this searched gene in stem-like cells from each diseased tissue sample relative to stem-like cells in normal samples in each tissue plotted against the malignancy continuum. Samples are colored based on if they are from different disease stage.AAH: Atypical adenomatous hyperplasia
AIS: Adenocarcinoma in situ
IAC: Invasive lung adenocarcinoma
MIA: Minimally invasive adenocarcinoma
Oral CavityThe image shows the transcriptomic changes along malignancy continuum.log2FC in expression of this searched gene in stem-like cells from each diseased tissue sample relative to stem-like cells in normal samples in each tissue plotted against the malignancy continuum. Samples are colored based on if they are from different disease stage.EOLP: Erosive Oral lichen planus
LP: leukoplakia
NEOLP: Non-erosive oral lichen planus
OSCC: Oral squamous cell carcinoma
ProstateThe image shows the transcriptomic changes along malignancy continuum.log2FC in expression of this searched gene in stem-like cells from each diseased tissue sample relative to stem-like cells in normal samples in each tissue plotted against the malignancy continuum. Samples are colored based on if they are from different disease stage.BPH: Benign Prostatic Hyperplasia
SkinThe image shows the transcriptomic changes along malignancy continuum.log2FC in expression of this searched gene in stem-like cells from each diseased tissue sample relative to stem-like cells in normal samples in each tissue plotted against the malignancy continuum. Samples are colored based on if they are from different disease stage.AK: Actinic keratosis
cSCC: Cutaneous squamous cell carcinoma
SCCIS:squamous cell carcinoma in situ
ThyroidThe image shows the transcriptomic changes along malignancy continuum.log2FC in expression of this searched gene in stem-like cells from each diseased tissue sample relative to stem-like cells in normal samples in each tissue plotted against the malignancy continuum. Samples are colored based on if they are from different disease stage.
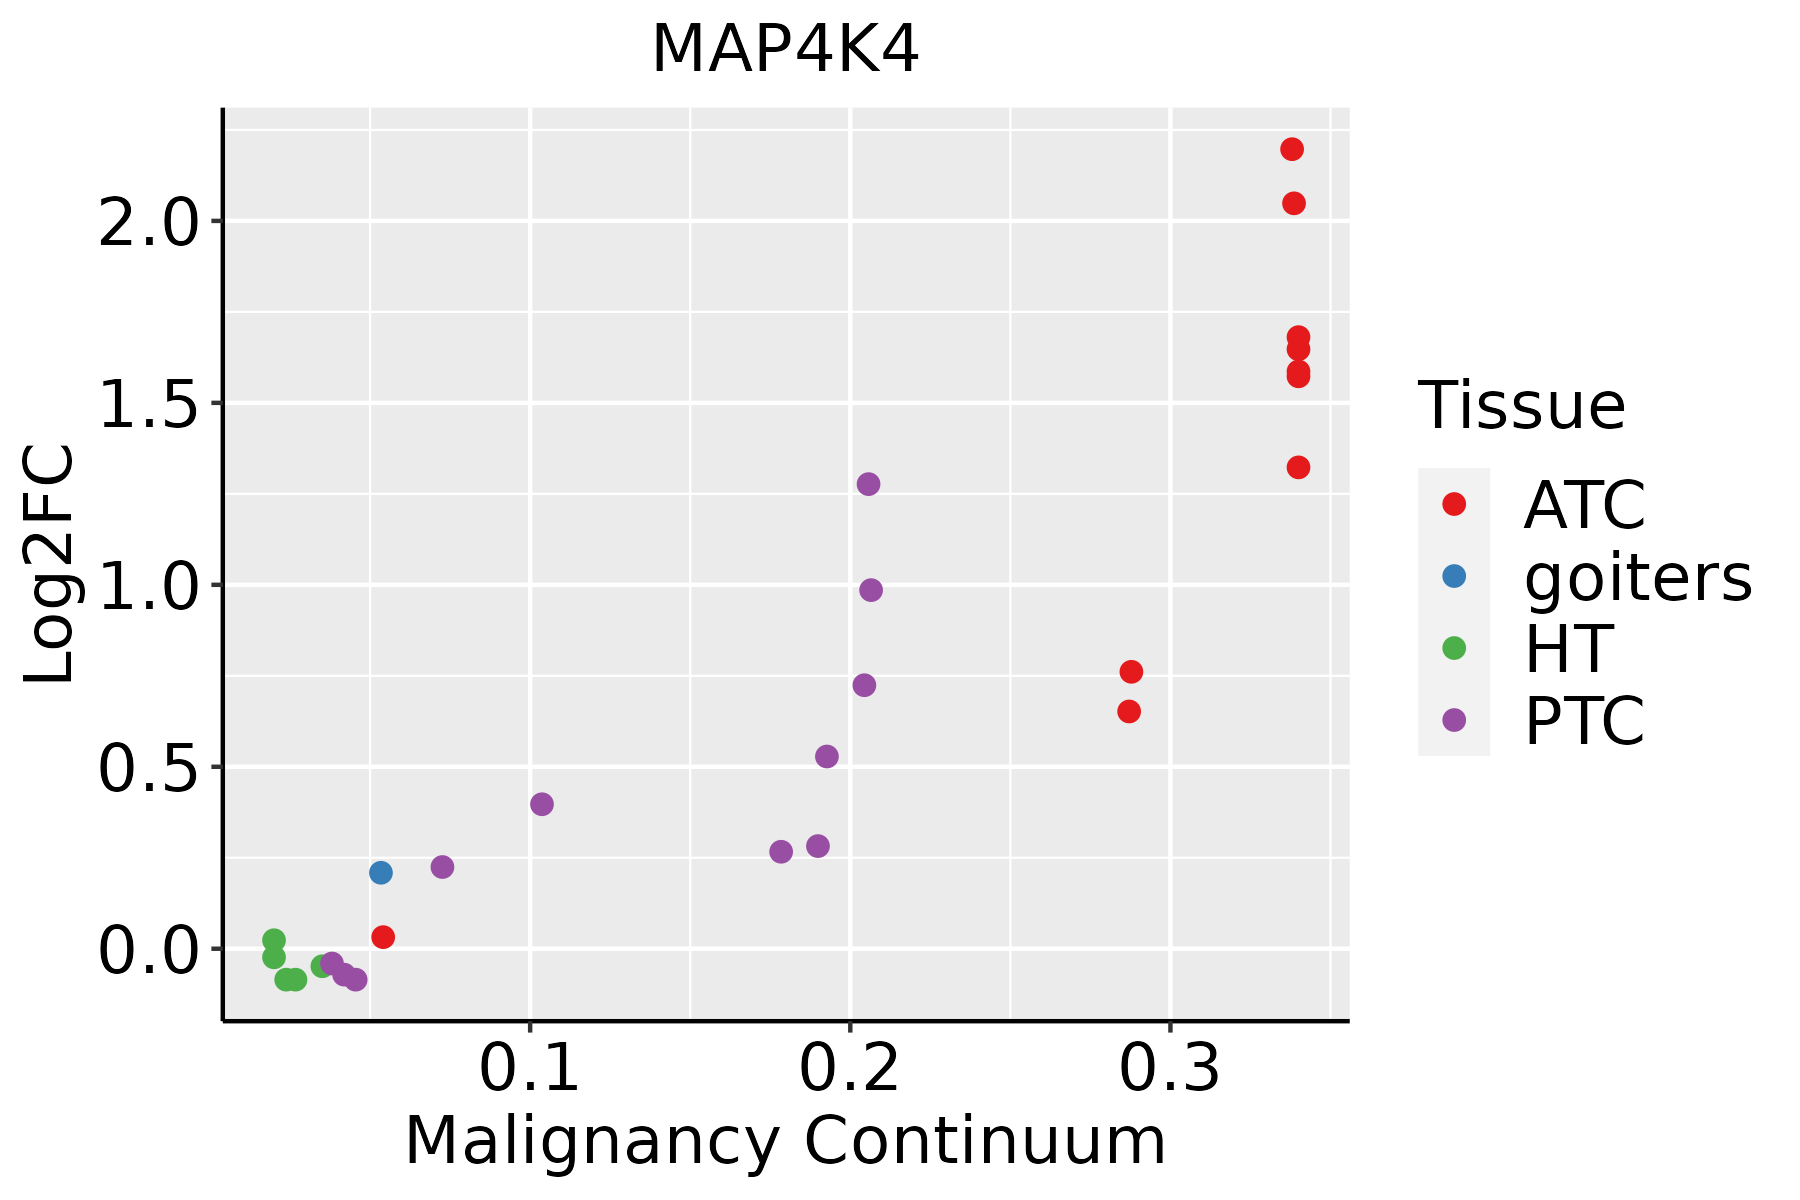
ATC: Anaplastic thyroid cancer
HT: Hashimoto's thyroiditis
PTC: Papillary thyroid cancer
∗log2FC in expression of this searched gene in stem-like cells from each diseased tissue sample relative to stem-like cells in normal samples in each tissue plotted against the malignancy continuum. Samples are colored based on if they are from different disease stage.

Top

Malignant transformation related pathway analysis

check buttonFind out the enriched GO biological processes and KEGG pathways involved in transition from healthy to precancer to cancer
check button Figure of enriched GO biological processes.
TissueDisease StageEnriched GO biological Processes
ColorectumADGO analysis - Figure of enriched GO biological processes: Top 15 enriched GO BP terms are showed in the bar plot of each disease state in each tissue. Each row represents a significant GO biological process which is colored according to the -log10(p.adjust).
ColorectumSERGO analysis - Figure of enriched GO biological processes: Top 15 enriched GO BP terms are showed in the bar plot of each disease state in each tissue. Each row represents a significant GO biological process which is colored according to the -log10(p.adjust).
ColorectumMSSGO analysis - Figure of enriched GO biological processes: Top 15 enriched GO BP terms are showed in the bar plot of each disease state in each tissue. Each row represents a significant GO biological process which is colored according to the -log10(p.adjust).
ColorectumMSI-HGO analysis - Figure of enriched GO biological processes: Top 15 enriched GO BP terms are showed in the bar plot of each disease state in each tissue. Each row represents a significant GO biological process which is colored according to the -log10(p.adjust).
ColorectumFAPGO analysis - Figure of enriched GO biological processes: Top 15 enriched GO BP terms are showed in the bar plot of each disease state in each tissue. Each row represents a significant GO biological process which is colored according to the -log10(p.adjust).
∗Top 15 enriched GO BP terms are showed in the bar plot of each disease state in each tissue. Each row represents a significant GO biological process which is colored according to the -log10(p.adjust).
Page: 1 2 3 4 5 6 7 8 9 

check button Enriched GO biological processes.
GO IDTissueDisease StageDescriptionGene RatioBg Ratiopvaluep.adjustCount
GO:00072548Oral cavityOSCCJNK cascade90/7305167/187236.49e-055.26e-0490
GO:00463288Oral cavityOSCCregulation of JNK cascade74/7305133/187237.22e-055.69e-0474
GO:001063118Oral cavityOSCCepithelial cell migration174/7305357/187231.04e-047.70e-04174
GO:000974320Oral cavityOSCCresponse to carbohydrate128/7305253/187231.11e-048.16e-04128
GO:000195416Oral cavityOSCCpositive regulation of cell-matrix adhesion37/730558/187231.15e-048.35e-0437
GO:009013218Oral cavityOSCCepithelium migration175/7305360/187231.18e-048.54e-04175
GO:19049504Oral cavityOSCCnegative regulation of establishment of protein localization72/7305131/187231.51e-041.06e-0372
GO:00512243Oral cavityOSCCnegative regulation of protein transport70/7305127/187231.65e-041.14e-0370
GO:009013018Oral cavityOSCCtissue migration176/7305365/187231.92e-041.29e-03176
GO:001097510Oral cavityOSCCregulation of neuron projection development210/7305445/187232.35e-041.52e-03210
GO:003428420Oral cavityOSCCresponse to monosaccharide114/7305225/187232.37e-041.54e-03114
GO:007133316Oral cavityOSCCcellular response to glucose stimulus79/7305151/187235.97e-043.39e-0379
GO:000974619Oral cavityOSCCresponse to hexose109/7305219/187237.41e-044.05e-03109
GO:000167816Oral cavityOSCCcellular glucose homeostasis88/7305172/187237.74e-044.22e-0388
GO:004308710Oral cavityOSCCregulation of GTPase activity165/7305348/187237.94e-044.27e-03165
GO:007133116Oral cavityOSCCcellular response to hexose stimulus79/7305153/187239.92e-045.17e-0379
GO:00071629Oral cavityOSCCnegative regulation of cell adhesion145/7305303/187239.95e-045.18e-03145
GO:000930610Oral cavityOSCCprotein secretion169/7305359/187231.04e-035.34e-03169
GO:000974917Oral cavityOSCCresponse to glucose105/7305212/187231.13e-035.78e-03105
GO:004259316Oral cavityOSCCglucose homeostasis125/7305258/187231.21e-036.08e-03125
Page: 1 2 3 4 5 6 7 8 9 10 11 12 13 14 15 16 17 18 19 20 21 22 23 24 25 26 27 28 29 30 31 32 33 34 35 36 37 38 39 40 41 

check button Enriched KEGG pathways.
Pathway IDTissueDisease StageDescriptionGene RatioBg Ratiopvaluep.adjustqvalueCount
hsa040108LungIACMAPK signaling pathway62/1053302/84653.54e-056.38e-044.24e-0462
hsa0401011LungIACMAPK signaling pathway62/1053302/84653.54e-056.38e-044.24e-0462
hsa0401021LungAISMAPK signaling pathway57/961302/84656.41e-059.43e-046.03e-0457
hsa0401031LungAISMAPK signaling pathway57/961302/84656.41e-059.43e-046.03e-0457
hsa0401014Oral cavityOSCCMAPK signaling pathway165/3704302/84657.11e-052.74e-041.40e-04165
hsa0401015Oral cavityOSCCMAPK signaling pathway165/3704302/84657.11e-052.74e-041.40e-04165
hsa0401023Oral cavityEOLPMAPK signaling pathway68/1218302/84657.48e-053.40e-042.01e-0468
hsa0401033Oral cavityEOLPMAPK signaling pathway68/1218302/84657.48e-053.40e-042.01e-0468
hsa0401041Oral cavityNEOLPMAPK signaling pathway59/1112302/84659.40e-044.67e-032.94e-0359
hsa0401051Oral cavityNEOLPMAPK signaling pathway59/1112302/84659.40e-044.67e-032.94e-0359
hsa0401010ProstateBPHMAPK signaling pathway87/1718302/84652.05e-041.13e-036.98e-0487
hsa0401013ProstateBPHMAPK signaling pathway87/1718302/84652.05e-041.13e-036.98e-0487
Page: 1 

Top

Cell-cell communication analysis

check buttonIdentification of potential cell-cell interactions between two cell types and their ligand-receptor pairs for different disease states
LigandReceptorLRpairPathwayTissueDisease Stage
Page: 1 

Top

Single-cell gene regulatory network inference analysis

check buttonFind out the significant the regulons (TFs) and the target genes of each regulon across cell types for different disease states
TFCell TypeTissueDisease StageTarget GeneRSSRegulon Activity
∗The dot plots of a searched regulon are shown for all cell subpopulations in each disease state of each tissue based on the regulon specific score inferred using pySCENIC and by calculating the average expression.
Page: 1 

Top

Somatic mutation of malignant transformation related genes

check buttonAnnotation of somatic variants for genes involved in malignant transformation
Hugo SymbolVariant ClassVariant ClassificationdbSNP RSHGVScHGVSpHGVSp ShortSWISSPROTBIOTYPESIFTPolyPhenTumor Sample BarcodeTissueHistologySexAgeStageTherapy TypesDrugsOutcome
MAP4K4SNVMissense_Mutationc.3526N>Tp.Val1176Phep.V1176Fprotein_codingdeleterious_low_confidence(0.01)probably_damaging(0.98)TCGA-A8-A09X-01Breastbreast invasive carcinomaFemale<65III/IVUnknownUnknownSD
MAP4K4SNVMissense_Mutationc.3715N>Cp.Phe1239Leup.F1239Lprotein_codingdeleterious_low_confidence(0)probably_damaging(0.931)TCGA-AC-A23H-01Breastbreast invasive carcinomaFemale>=65I/IIUnknownUnknownPD
MAP4K4SNVMissense_Mutationc.451N>Tp.His151Tyrp.H151Yprotein_codingdeleterious_low_confidence(0)probably_damaging(0.957)TCGA-AC-A2FG-01Breastbreast invasive carcinomaFemale>=65I/IIHormone TherapyarimidexCR
MAP4K4SNVMissense_Mutationnovelc.643N>Ap.Asp215Asnp.D215Nprotein_codingdeleterious_low_confidence(0)probably_damaging(0.994)TCGA-BH-A0B6-01Breastbreast invasive carcinomaFemale<65I/IIUnknownUnknownSD
MAP4K4SNVMissense_Mutationc.1246G>Cp.Glu416Glnp.E416Qprotein_codingtolerated_low_confidence(0.09)possibly_damaging(0.888)TCGA-D8-A27G-01Breastbreast invasive carcinomaFemale>=65I/IIUnknownUnknownSD
MAP4K4SNVMissense_Mutationc.592N>Ap.Glu198Lysp.E198Kprotein_codingdeleterious_low_confidence(0)probably_damaging(0.991)TCGA-E2-A1LG-01Breastbreast invasive carcinomaFemale<65I/IIChemotherapydoxorubicinSD
MAP4K4SNVMissense_Mutationc.673N>Cp.Glu225Glnp.E225Qprotein_codingdeleterious_low_confidence(0.02)probably_damaging(0.991)TCGA-E2-A1LG-01Breastbreast invasive carcinomaFemale<65I/IIChemotherapydoxorubicinSD
MAP4K4SNVMissense_Mutationc.2322N>Cp.Leu774Phep.L774Fprotein_codingtolerated_low_confidence(0.59)probably_damaging(0.991)TCGA-GM-A2DI-01Breastbreast invasive carcinomaFemale<65I/IIChemotherapytaxotereCR
MAP4K4SNVMissense_Mutationnovelc.2741N>Cp.Gly914Alap.G914Aprotein_codingtolerated_low_confidence(0.39)probably_damaging(0.997)TCGA-OL-A5RW-01Breastbreast invasive carcinomaFemale<65I/IIChemotherapyadriamycinCR
MAP4K4insertionNonsense_Mutationnovelc.1598_1599insGGAGGGTCAGACATAGACACAAGAGACGTAGATp.Asp533delinsGluGluGlyGlnThrTerThrGlnGluThrTerIlep.D533delinsEEGQT*TQET*Iprotein_codingTCGA-AO-A0J9-01Breastbreast invasive carcinomaFemale<65III/IVChemotherapycyclophosphamidePD
Page: 1 2 3 4 5 6 7 8 9 10 11 12 

Top

Related drugs of malignant transformation related genes

check buttonIdentification of chemicals and drugs interact with genes involved in malignant transfromation
(DGIdb 4.0)
Entrez IDSymbolCategoryInteraction TypesDrug Claim NameDrug NamePMIDs
9448MAP4K4DRUGGABLE GENOME, KINASE, SERINE THREONINE KINASE, ENZYMECYC-116CYC-116
9448MAP4K4DRUGGABLE GENOME, KINASE, SERINE THREONINE KINASE, ENZYMESOTRASTAURINSOTRASTAURIN
9448MAP4K4DRUGGABLE GENOME, KINASE, SERINE THREONINE KINASE, ENZYMEPAZOPANIBPAZOPANIB
9448MAP4K4DRUGGABLE GENOME, KINASE, SERINE THREONINE KINASE, ENZYMEDNDI1417467CHEMBL1997335
9448MAP4K4DRUGGABLE GENOME, KINASE, SERINE THREONINE KINASE, ENZYMEAST-487AST-487
9448MAP4K4DRUGGABLE GENOME, KINASE, SERINE THREONINE KINASE, ENZYMEPD-0166285PD-0166285
9448MAP4K4DRUGGABLE GENOME, KINASE, SERINE THREONINE KINASE, ENZYMESB-220025SB-220025
9448MAP4K4DRUGGABLE GENOME, KINASE, SERINE THREONINE KINASE, ENZYMECEDIRANIBCEDIRANIB
9448MAP4K4DRUGGABLE GENOME, KINASE, SERINE THREONINE KINASE, ENZYMEOSI-632OSI-632
9448MAP4K4DRUGGABLE GENOME, KINASE, SERINE THREONINE KINASE, ENZYMEAZD-1152-HQPAAZD-1152-HQPA
Page: 1 2 3 4 5