
|
|||||
|
 | |
| |
| |
| |
| |
| |
|
Gene: LAMP1 |
Gene summary for LAMP1 |
| Gene information | Species | Human | Gene symbol | LAMP1 | Gene ID | 3916 |
| Gene name | lysosomal associated membrane protein 1 | |
| Gene Alias | CD107a | |
| Cytomap | 13q34 | |
| Gene Type | protein-coding | GO ID | GO:0001775 | UniProtAcc | A0A024RDY3 |
Top |
Malignant transformation analysis |
| Identification of the aberrant gene expression in precancerous and cancerous lesions by comparing the gene expression of stem-like cells in diseased tissues with normal stem cells |
| Entrez ID | Symbol | Replicates | Species | Organ | Tissue | Adj P-value | Log2FC | Malignancy |
| 3916 | LAMP1 | HTA11_3410_2000001011 | Human | Colorectum | AD | 3.61e-08 | 3.28e-01 | 0.0155 |
| 3916 | LAMP1 | HTA11_2487_2000001011 | Human | Colorectum | SER | 1.36e-16 | 8.99e-01 | -0.1808 |
| 3916 | LAMP1 | HTA11_1938_2000001011 | Human | Colorectum | AD | 5.90e-25 | 1.08e+00 | -0.0811 |
| 3916 | LAMP1 | HTA11_78_2000001011 | Human | Colorectum | AD | 1.97e-14 | 7.22e-01 | -0.1088 |
| 3916 | LAMP1 | HTA11_347_2000001011 | Human | Colorectum | AD | 1.61e-40 | 1.02e+00 | -0.1954 |
| 3916 | LAMP1 | HTA11_411_2000001011 | Human | Colorectum | SER | 3.83e-11 | 1.57e+00 | -0.2602 |
| 3916 | LAMP1 | HTA11_2112_2000001011 | Human | Colorectum | SER | 4.60e-09 | 1.14e+00 | -0.2196 |
| 3916 | LAMP1 | HTA11_3361_2000001011 | Human | Colorectum | AD | 8.14e-04 | 5.64e-01 | -0.1207 |
| 3916 | LAMP1 | HTA11_83_2000001011 | Human | Colorectum | SER | 3.84e-16 | 1.02e+00 | -0.1526 |
| 3916 | LAMP1 | HTA11_696_2000001011 | Human | Colorectum | AD | 3.35e-41 | 1.03e+00 | -0.1464 |
| 3916 | LAMP1 | HTA11_866_2000001011 | Human | Colorectum | AD | 7.18e-18 | 5.52e-01 | -0.1001 |
| 3916 | LAMP1 | HTA11_1391_2000001011 | Human | Colorectum | AD | 1.08e-24 | 1.15e+00 | -0.059 |
| 3916 | LAMP1 | HTA11_2992_2000001011 | Human | Colorectum | SER | 2.22e-09 | 1.09e+00 | -0.1706 |
| 3916 | LAMP1 | HTA11_5212_2000001011 | Human | Colorectum | AD | 1.73e-17 | 1.38e+00 | -0.2061 |
| 3916 | LAMP1 | HTA11_546_2000001011 | Human | Colorectum | AD | 4.52e-06 | 5.69e-01 | -0.0842 |
| 3916 | LAMP1 | HTA11_7862_2000001011 | Human | Colorectum | AD | 3.11e-10 | 7.90e-01 | -0.0179 |
| 3916 | LAMP1 | HTA11_866_3004761011 | Human | Colorectum | AD | 7.89e-24 | 9.08e-01 | 0.096 |
| 3916 | LAMP1 | HTA11_4255_2000001011 | Human | Colorectum | SER | 6.61e-03 | 6.99e-01 | 0.0446 |
| 3916 | LAMP1 | HTA11_8622_2000001021 | Human | Colorectum | SER | 1.72e-07 | 7.32e-01 | 0.0528 |
| 3916 | LAMP1 | HTA11_7663_2000001011 | Human | Colorectum | SER | 7.50e-07 | 9.32e-01 | 0.0131 |
| Page: 1 2 3 4 5 6 7 8 9 10 |
| Tissue | Expression Dynamics | Abbreviation |
| Colorectum (GSE201348) |  | FAP: Familial adenomatous polyposis |
| CRC: Colorectal cancer | ||
| Colorectum (HTA11) |  | AD: Adenomas |
| SER: Sessile serrated lesions | ||
| MSI-H: Microsatellite-high colorectal cancer | ||
| MSS: Microsatellite stable colorectal cancer | ||
| Endometrium | 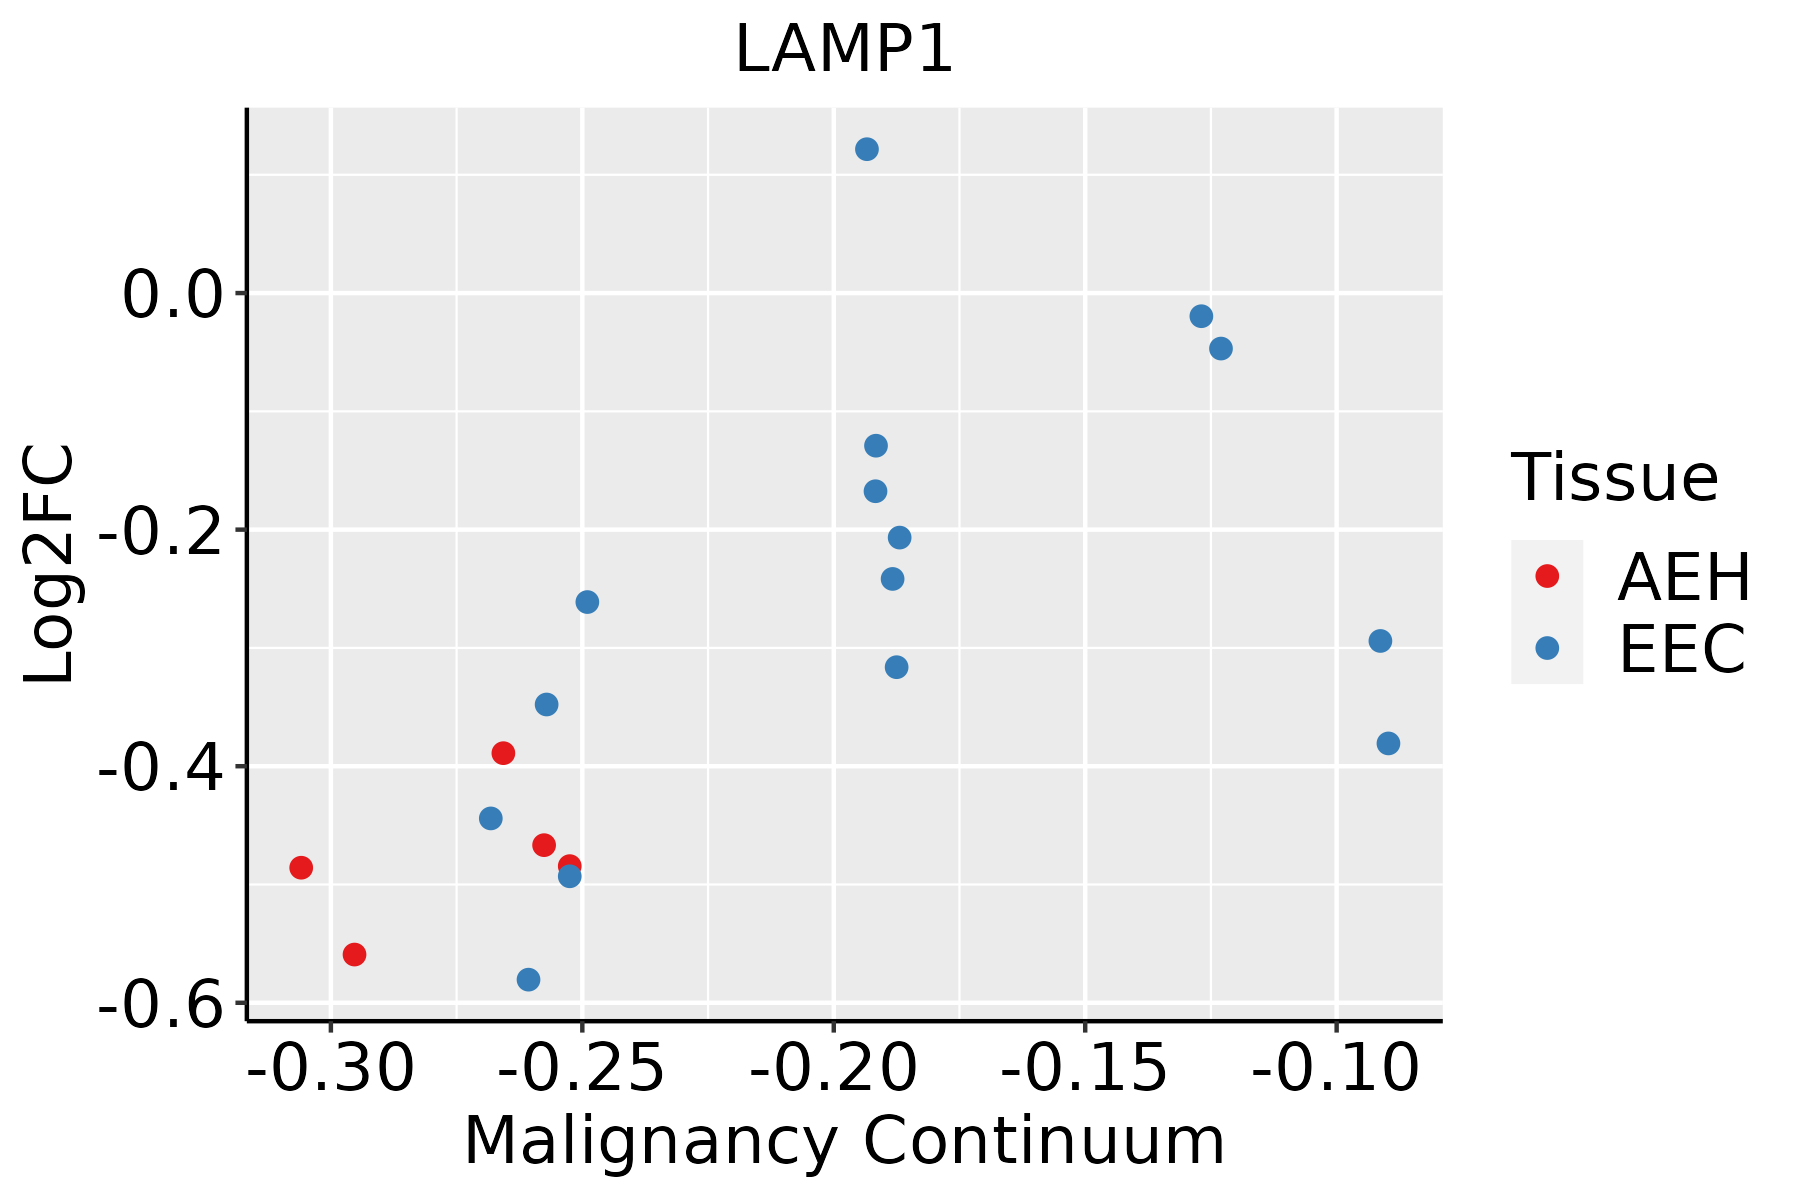 | AEH: Atypical endometrial hyperplasia |
| EEC: Endometrioid Cancer | ||
| Esophagus | 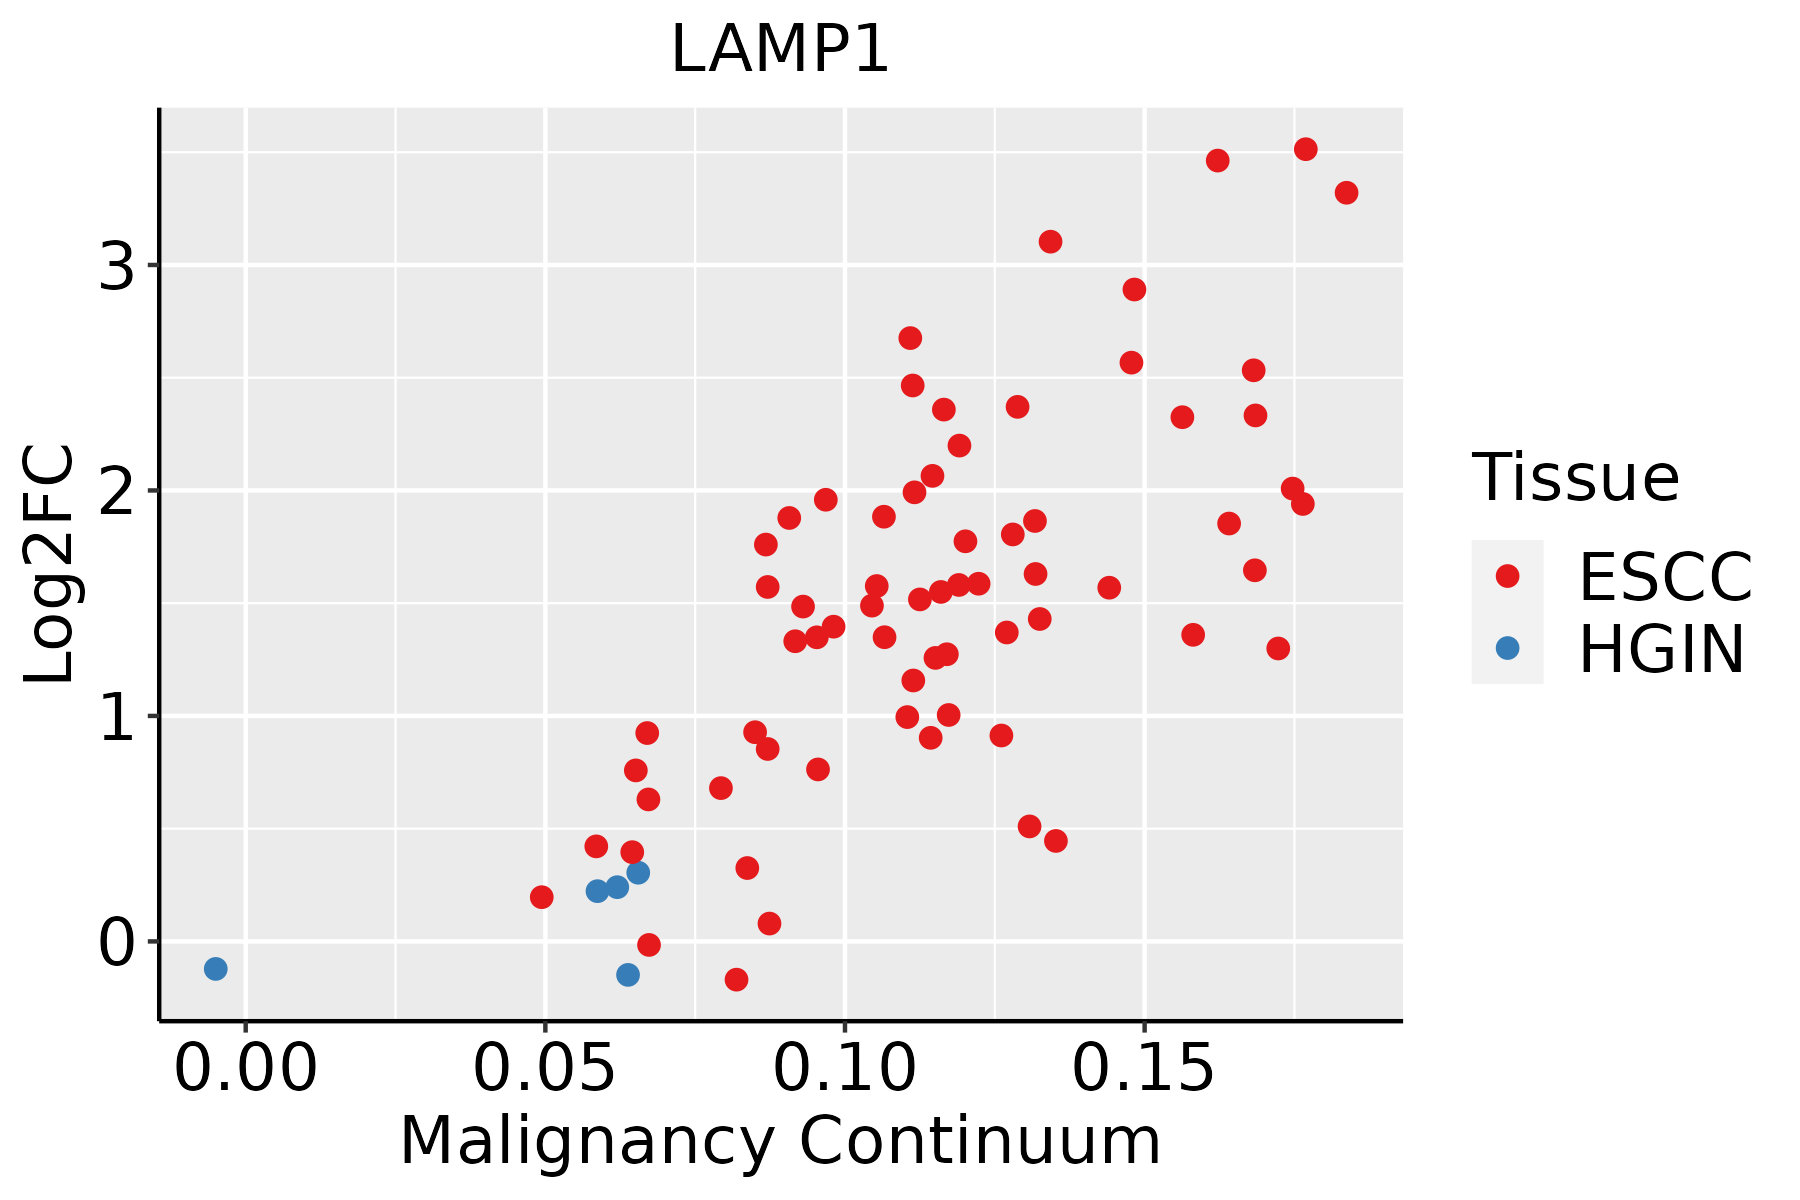 | ESCC: Esophageal squamous cell carcinoma |
| HGIN: High-grade intraepithelial neoplasias | ||
| LGIN: Low-grade intraepithelial neoplasias | ||
| Liver | 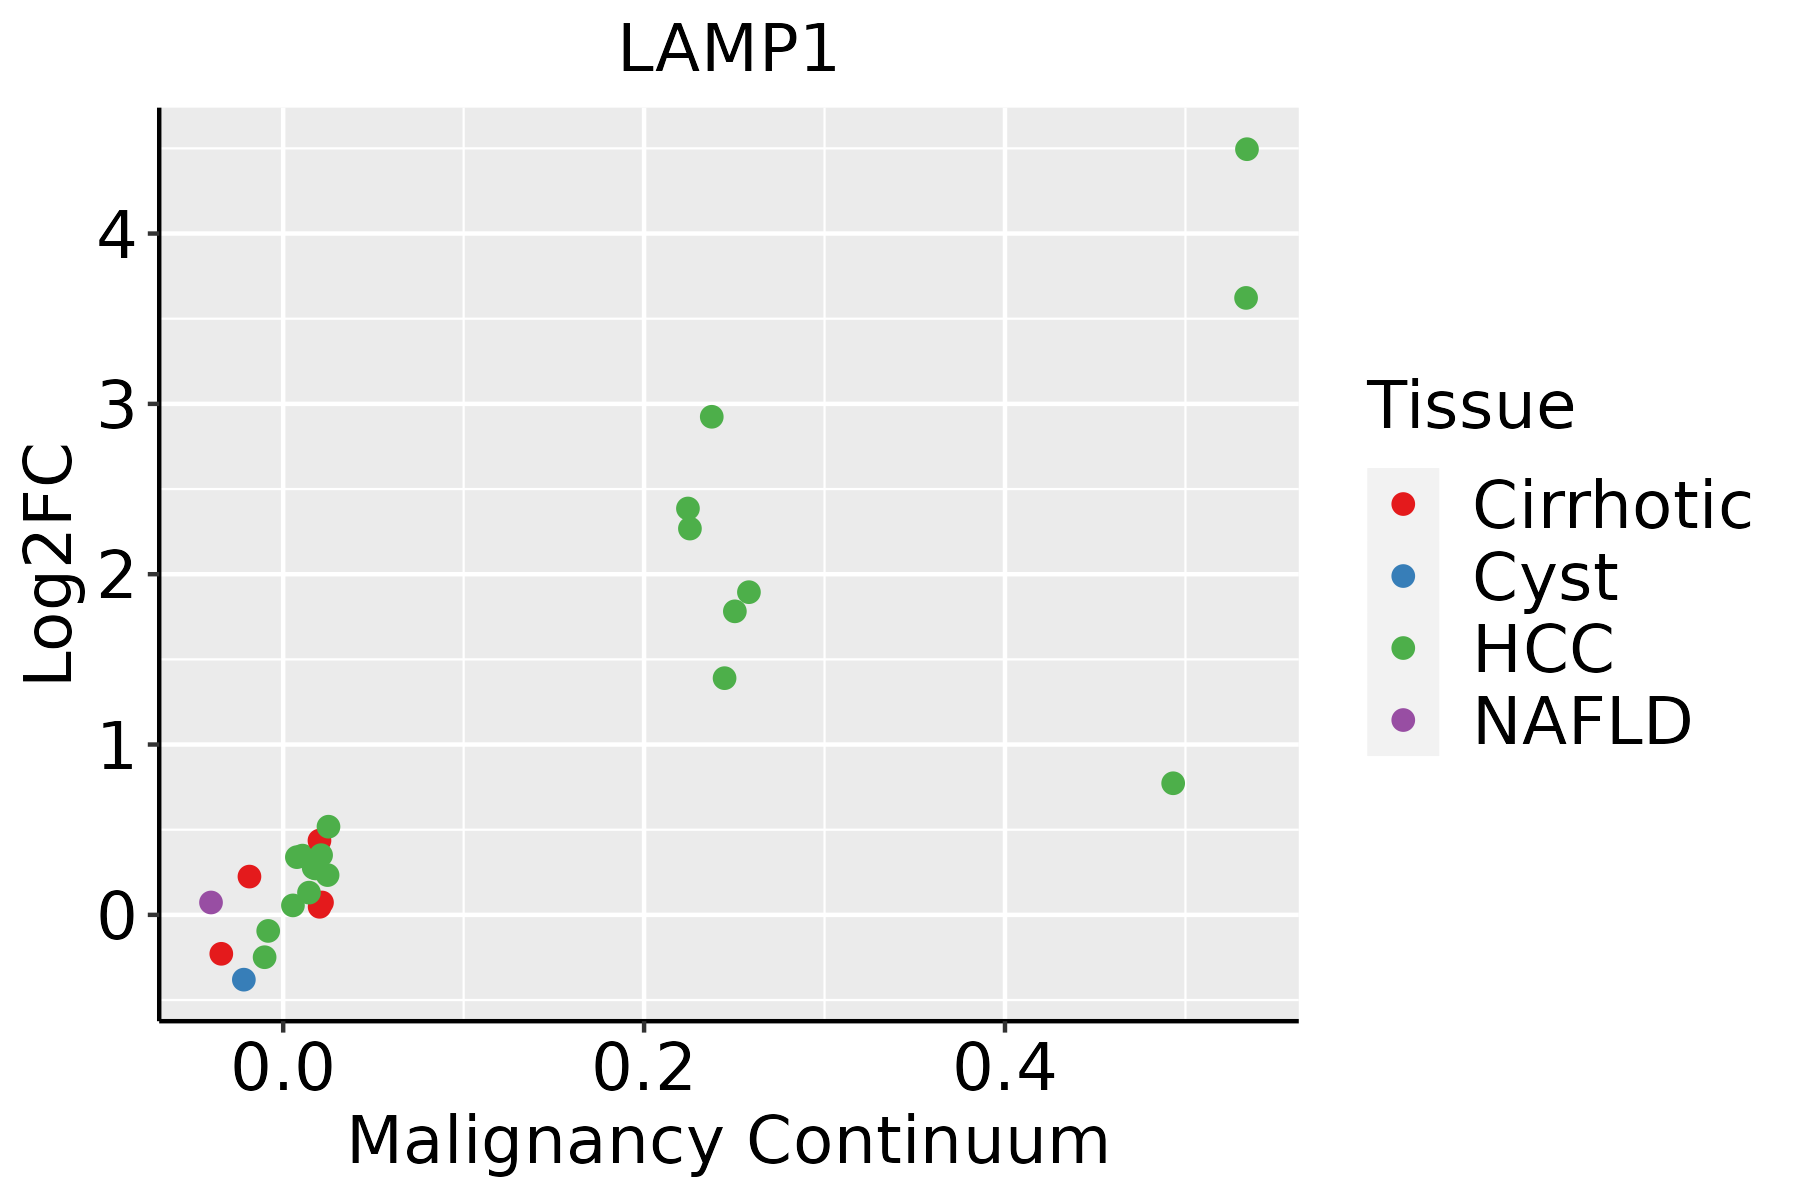 | HCC: Hepatocellular carcinoma |
| NAFLD: Non-alcoholic fatty liver disease | ||
| Oral Cavity | 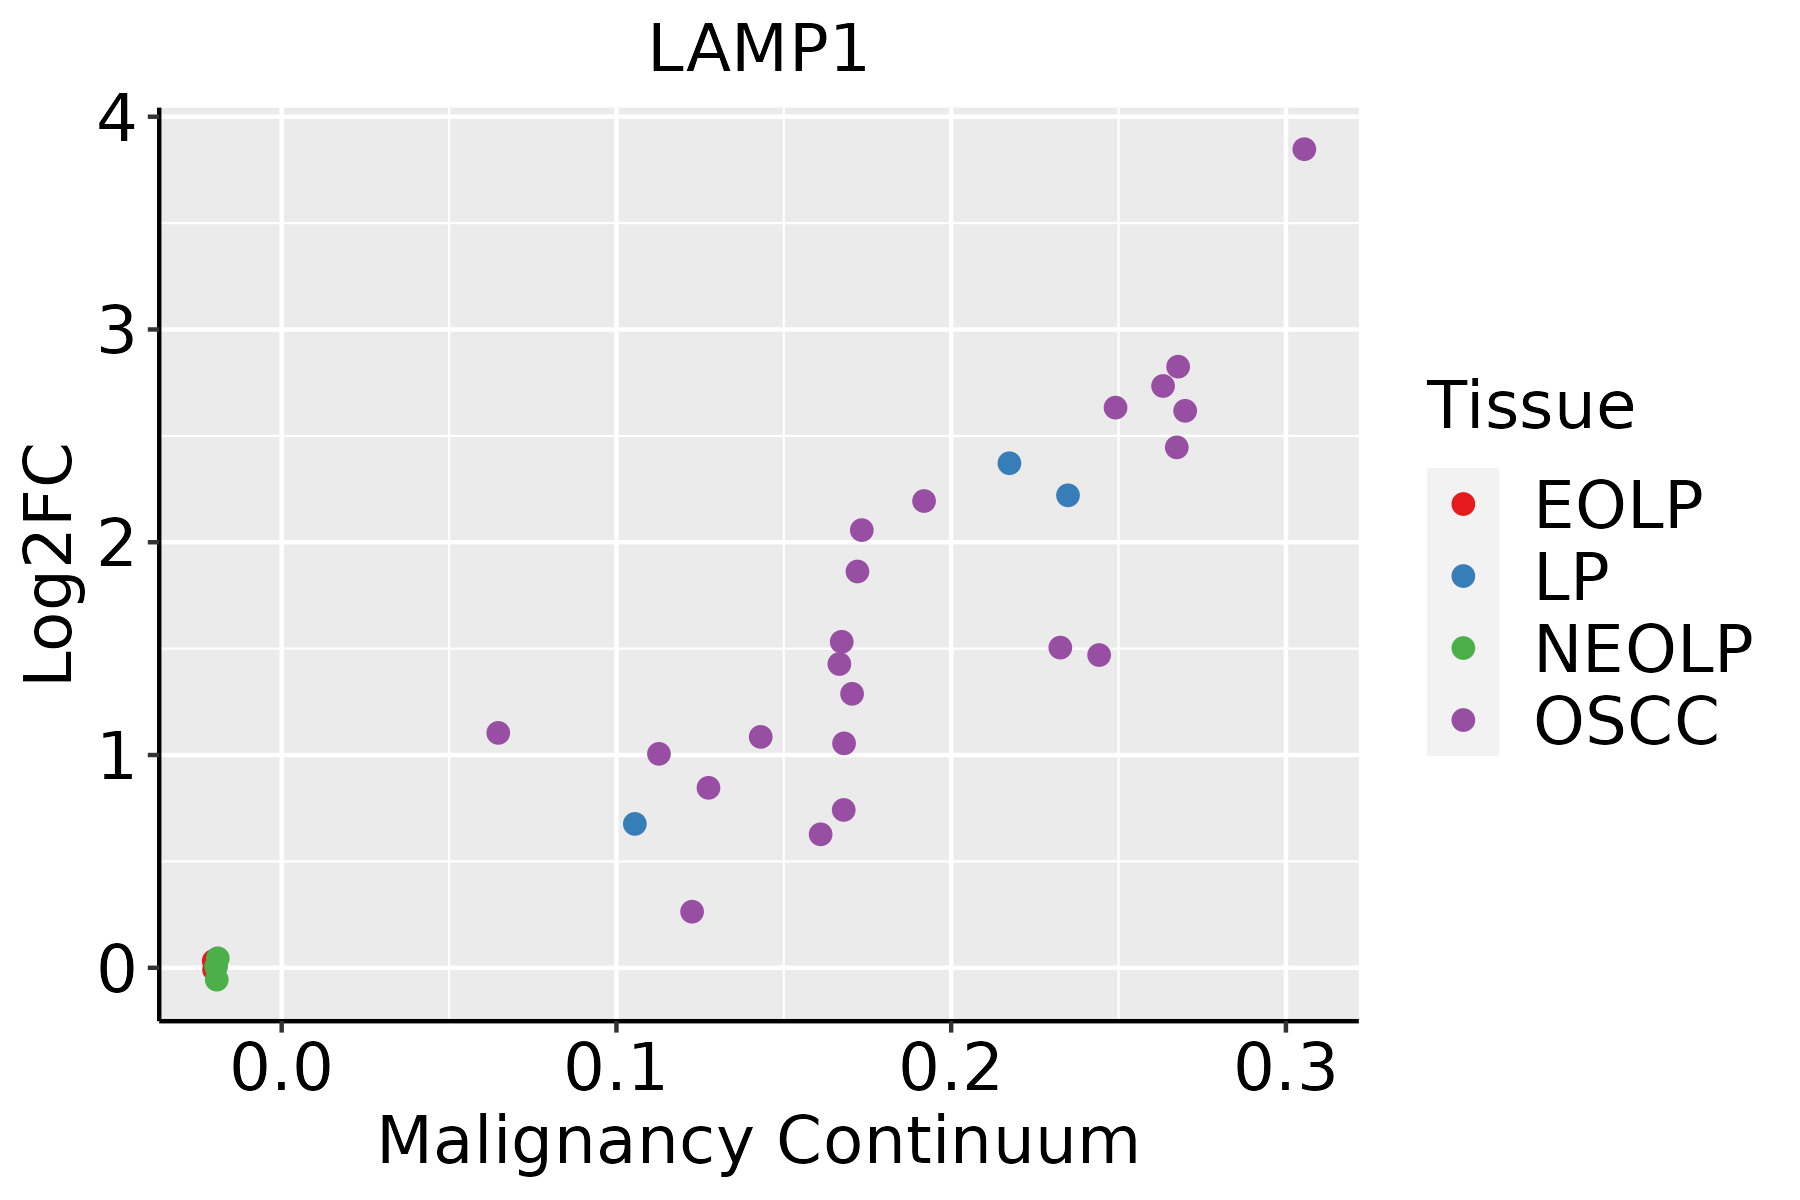 | EOLP: Erosive Oral lichen planus |
| LP: leukoplakia | ||
| NEOLP: Non-erosive oral lichen planus | ||
| OSCC: Oral squamous cell carcinoma | ||
| Prostate | 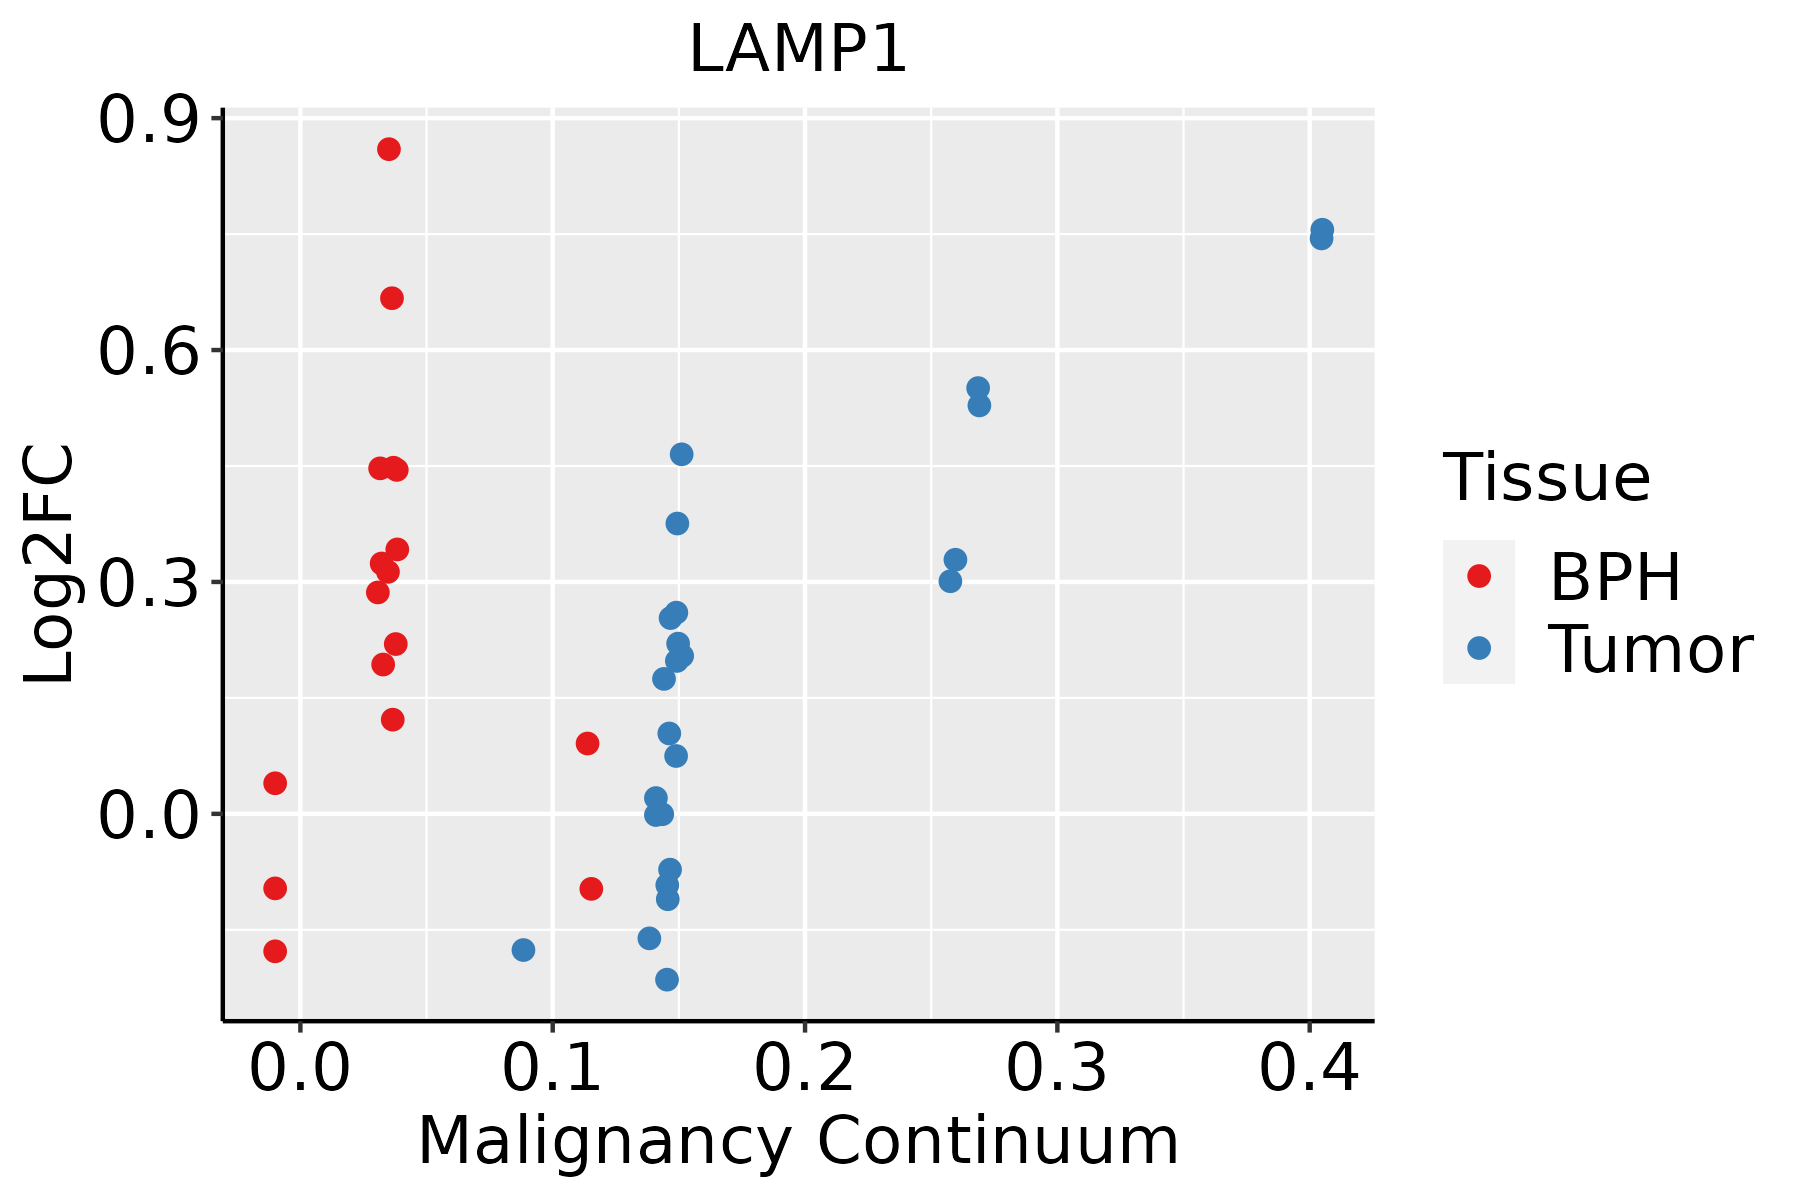 | BPH: Benign Prostatic Hyperplasia |
| Skin |  | AK: Actinic keratosis |
| cSCC: Cutaneous squamous cell carcinoma | ||
| SCCIS:squamous cell carcinoma in situ | ||
| Thyroid | 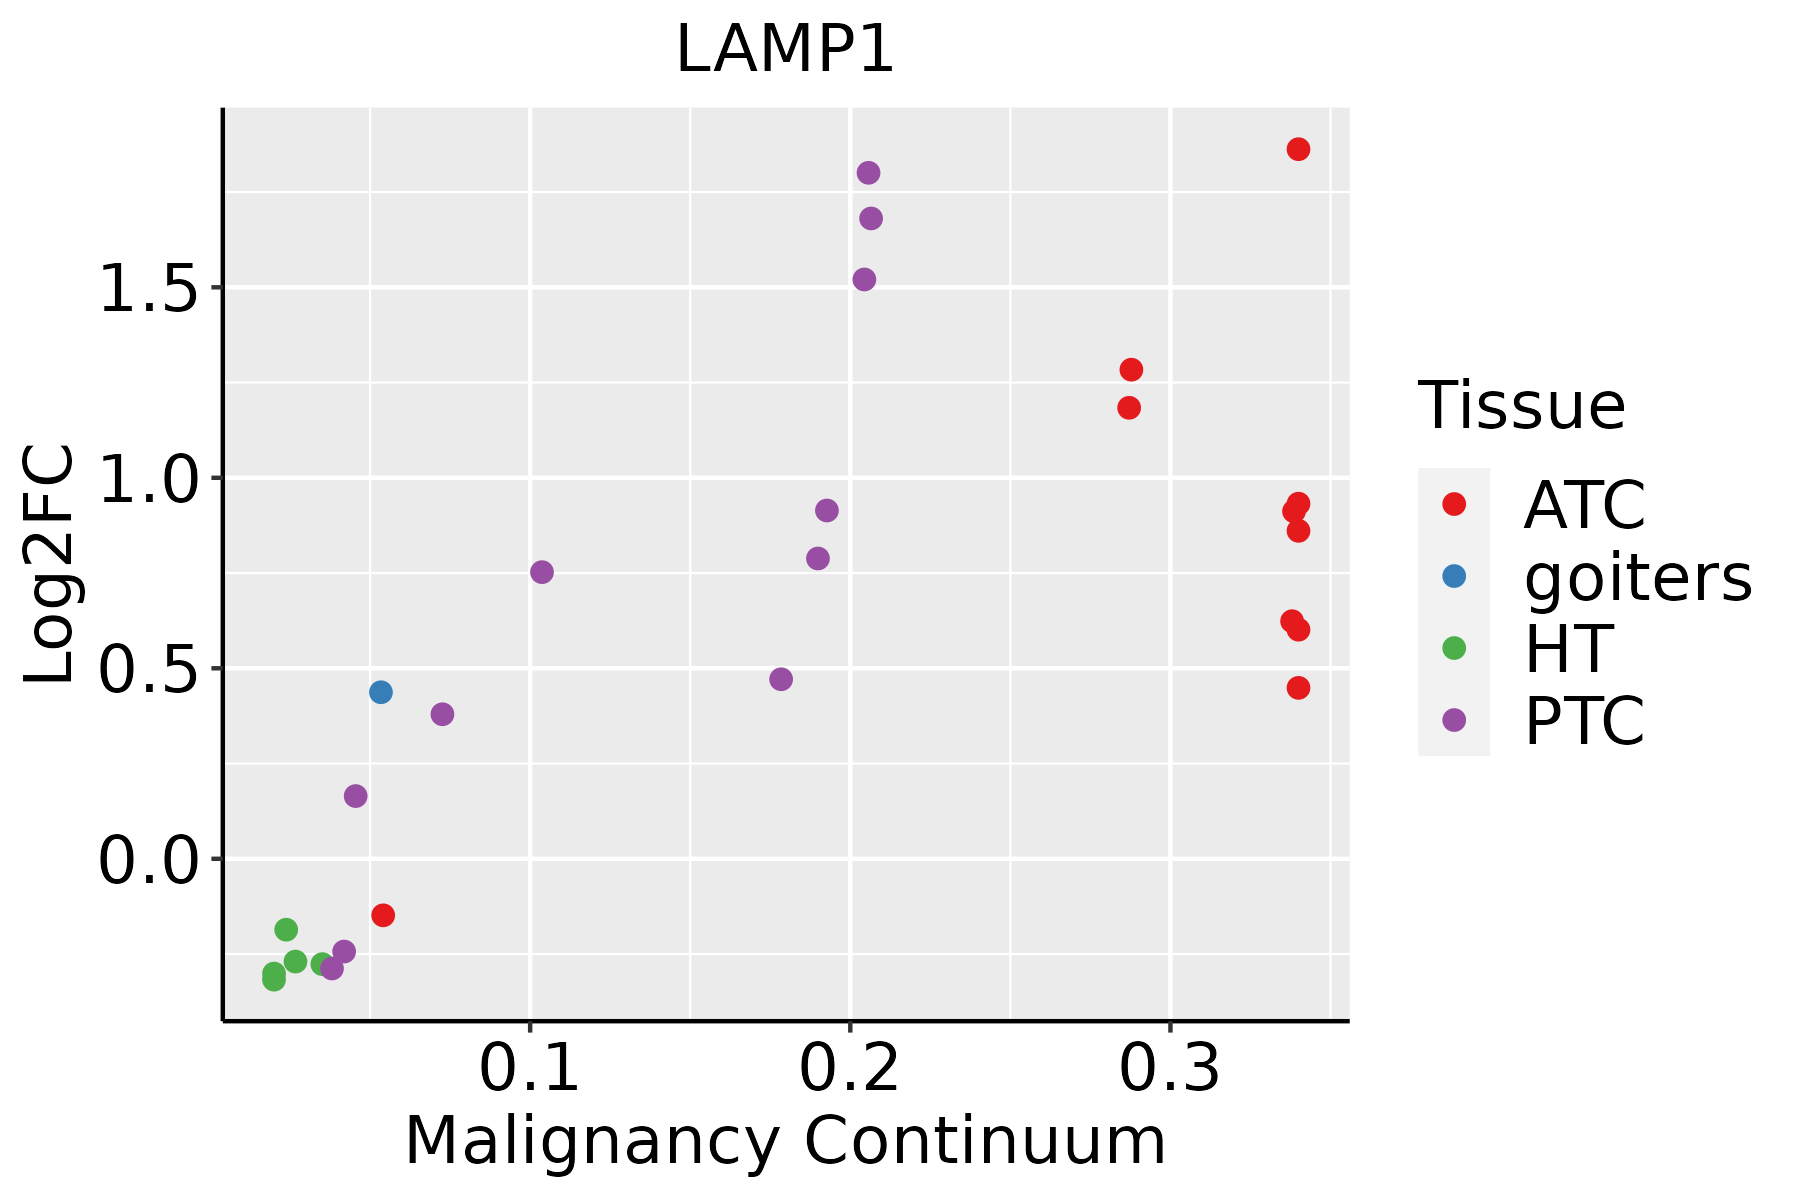 | ATC: Anaplastic thyroid cancer |
| HT: Hashimoto's thyroiditis | ||
| PTC: Papillary thyroid cancer |
| ∗log2FC in expression of this searched gene in stem-like cells from each diseased tissue sample relative to stem-like cells in normal samples in each tissue plotted against the malignancy continuum. Samples are colored based on if they are from different disease stage. |
Top |
Malignant transformation related pathway analysis |
| Find out the enriched GO biological processes and KEGG pathways involved in transition from healthy to precancer to cancer |
| Tissue | Disease Stage | Enriched GO biological Processes |
| Colorectum | AD |  |
| Colorectum | SER |  |
| Colorectum | MSS |  |
| Colorectum | MSI-H |  |
| Colorectum | FAP |  |
| ∗Top 15 enriched GO BP terms are showed in the bar plot of each disease state in each tissue. Each row represents a significant GO biological process which is colored according to the -log10(p.adjust). |
| Page: 1 2 3 4 5 6 7 8 9 |
| GO ID | Tissue | Disease Stage | Description | Gene Ratio | Bg Ratio | pvalue | p.adjust | Count |
| GO:004440333 | Oral cavity | NEOLP | biological process involved in symbiotic interaction | 64/2005 | 290/18723 | 1.28e-08 | 6.01e-07 | 64 |
| GO:007259432 | Oral cavity | NEOLP | establishment of protein localization to organelle | 84/2005 | 422/18723 | 1.30e-08 | 6.10e-07 | 84 |
| GO:003070531 | Oral cavity | NEOLP | cytoskeleton-dependent intracellular transport | 46/2005 | 195/18723 | 1.81e-07 | 6.18e-06 | 46 |
| GO:003210323 | Oral cavity | NEOLP | positive regulation of response to external stimulus | 81/2005 | 427/18723 | 2.04e-07 | 6.74e-06 | 81 |
| GO:005170133 | Oral cavity | NEOLP | biological process involved in interaction with host | 47/2005 | 203/18723 | 2.42e-07 | 7.85e-06 | 47 |
| GO:000283131 | Oral cavity | NEOLP | regulation of response to biotic stimulus | 65/2005 | 327/18723 | 5.93e-07 | 1.74e-05 | 65 |
| GO:004819331 | Oral cavity | NEOLP | Golgi vesicle transport | 60/2005 | 296/18723 | 8.09e-07 | 2.21e-05 | 60 |
| GO:004671832 | Oral cavity | NEOLP | viral entry into host cell | 36/2005 | 144/18723 | 8.75e-07 | 2.37e-05 | 36 |
| GO:005212632 | Oral cavity | NEOLP | movement in host environment | 41/2005 | 175/18723 | 9.99e-07 | 2.67e-05 | 41 |
| GO:004440932 | Oral cavity | NEOLP | entry into host | 37/2005 | 151/18723 | 1.05e-06 | 2.79e-05 | 37 |
| GO:000689231 | Oral cavity | NEOLP | post-Golgi vesicle-mediated transport | 27/2005 | 104/18723 | 9.30e-06 | 1.79e-04 | 27 |
| GO:005165631 | Oral cavity | NEOLP | establishment of organelle localization | 69/2005 | 390/18723 | 1.89e-05 | 3.16e-04 | 69 |
| GO:00450883 | Oral cavity | NEOLP | regulation of innate immune response | 43/2005 | 218/18723 | 5.49e-05 | 7.44e-04 | 43 |
| GO:001097031 | Oral cavity | NEOLP | transport along microtubule | 33/2005 | 155/18723 | 8.53e-05 | 1.06e-03 | 33 |
| GO:001648231 | Oral cavity | NEOLP | cytosolic transport | 32/2005 | 168/18723 | 8.71e-04 | 6.86e-03 | 32 |
| GO:003134922 | Oral cavity | NEOLP | positive regulation of defense response | 47/2005 | 278/18723 | 1.05e-03 | 7.99e-03 | 47 |
| GO:000703431 | Oral cavity | NEOLP | vacuolar transport | 30/2005 | 157/18723 | 1.18e-03 | 8.72e-03 | 30 |
| GO:009911111 | Oral cavity | NEOLP | microtubule-based transport | 34/2005 | 190/18723 | 1.87e-03 | 1.28e-02 | 34 |
| GO:007238431 | Oral cavity | NEOLP | organelle transport along microtubule | 18/2005 | 85/18723 | 3.45e-03 | 2.05e-02 | 18 |
| GO:000704131 | Oral cavity | NEOLP | lysosomal transport | 22/2005 | 114/18723 | 4.42e-03 | 2.49e-02 | 22 |
| Page: 1 2 3 4 5 6 7 8 9 10 11 12 13 14 15 16 17 18 19 20 21 22 23 24 |
| Pathway ID | Tissue | Disease Stage | Description | Gene Ratio | Bg Ratio | pvalue | p.adjust | qvalue | Count |
| hsa04140 | Colorectum | AD | Autophagy - animal | 49/2092 | 141/8465 | 4.58e-03 | 2.20e-02 | 1.40e-02 | 49 |
| hsa041401 | Colorectum | AD | Autophagy - animal | 49/2092 | 141/8465 | 4.58e-03 | 2.20e-02 | 1.40e-02 | 49 |
| hsa04142 | Colorectum | SER | Lysosome | 38/1580 | 132/8465 | 2.87e-03 | 2.03e-02 | 1.47e-02 | 38 |
| hsa041402 | Colorectum | SER | Autophagy - animal | 39/1580 | 141/8465 | 5.43e-03 | 3.28e-02 | 2.38e-02 | 39 |
| hsa041421 | Colorectum | SER | Lysosome | 38/1580 | 132/8465 | 2.87e-03 | 2.03e-02 | 1.47e-02 | 38 |
| hsa041403 | Colorectum | SER | Autophagy - animal | 39/1580 | 141/8465 | 5.43e-03 | 3.28e-02 | 2.38e-02 | 39 |
| hsa041404 | Colorectum | MSS | Autophagy - animal | 45/1875 | 141/8465 | 4.42e-03 | 1.90e-02 | 1.16e-02 | 45 |
| hsa041405 | Colorectum | MSS | Autophagy - animal | 45/1875 | 141/8465 | 4.42e-03 | 1.90e-02 | 1.16e-02 | 45 |
| hsa04145 | Colorectum | MSI-H | Phagosome | 27/797 | 152/8465 | 8.74e-04 | 1.01e-02 | 8.48e-03 | 27 |
| hsa041451 | Colorectum | MSI-H | Phagosome | 27/797 | 152/8465 | 8.74e-04 | 1.01e-02 | 8.48e-03 | 27 |
| hsa0414524 | Endometrium | AEH | Phagosome | 41/1197 | 152/8465 | 2.12e-05 | 2.22e-04 | 1.63e-04 | 41 |
| hsa04145111 | Endometrium | AEH | Phagosome | 41/1197 | 152/8465 | 2.12e-05 | 2.22e-04 | 1.63e-04 | 41 |
| hsa0414525 | Endometrium | EEC | Phagosome | 42/1237 | 152/8465 | 2.01e-05 | 2.28e-04 | 1.70e-04 | 42 |
| hsa0414534 | Endometrium | EEC | Phagosome | 42/1237 | 152/8465 | 2.01e-05 | 2.28e-04 | 1.70e-04 | 42 |
| hsa041426 | Esophagus | HGIN | Lysosome | 33/1383 | 132/8465 | 6.65e-03 | 4.37e-02 | 3.47e-02 | 33 |
| hsa0414213 | Esophagus | HGIN | Lysosome | 33/1383 | 132/8465 | 6.65e-03 | 4.37e-02 | 3.47e-02 | 33 |
| hsa0414222 | Esophagus | ESCC | Lysosome | 102/4205 | 132/8465 | 5.11e-11 | 7.13e-10 | 3.65e-10 | 102 |
| hsa0414010 | Esophagus | ESCC | Autophagy - animal | 101/4205 | 141/8465 | 7.60e-08 | 6.21e-07 | 3.18e-07 | 101 |
| hsa0414530 | Esophagus | ESCC | Phagosome | 100/4205 | 152/8465 | 3.81e-05 | 1.72e-04 | 8.82e-05 | 100 |
| hsa051527 | Esophagus | ESCC | Tuberculosis | 111/4205 | 180/8465 | 7.14e-04 | 2.32e-03 | 1.19e-03 | 111 |
| Page: 1 2 3 4 |
Top |
Cell-cell communication analysis |
| Identification of potential cell-cell interactions between two cell types and their ligand-receptor pairs for different disease states |
| Ligand | Receptor | LRpair | Pathway | Tissue | Disease Stage |
| Page: 1 |
Top |
Single-cell gene regulatory network inference analysis |
| Find out the significant the regulons (TFs) and the target genes of each regulon across cell types for different disease states |
| TF | Cell Type | Tissue | Disease Stage | Target Gene | RSS | Regulon Activity |
| ∗The dot plots of a searched regulon are shown for all cell subpopulations in each disease state of each tissue based on the regulon specific score inferred using pySCENIC and by calculating the average expression. |
| Page: 1 |
Top |
Somatic mutation of malignant transformation related genes |
| Annotation of somatic variants for genes involved in malignant transformation |
| Hugo Symbol | Variant Class | Variant Classification | dbSNP RS | HGVSc | HGVSp | HGVSp Short | SWISSPROT | BIOTYPE | SIFT | PolyPhen | Tumor Sample Barcode | Tissue | Histology | Sex | Age | Stage | Therapy Types | Drugs | Outcome |
| LAMP1 | SNV | Missense_Mutation | c.484N>A | p.His162Asn | p.H162N | P11279 | protein_coding | tolerated(0.51) | benign(0.009) | TCGA-C8-A1HJ-01 | Breast | breast invasive carcinoma | Female | <65 | I/II | Unknown | Unknown | SD | |
| LAMP1 | insertion | Frame_Shift_Ins | novel | c.166_167insGGATTTTAAATGAAAAG | p.Thr56ArgfsTer14 | p.T56Rfs*14 | P11279 | protein_coding | TCGA-BH-A0BR-01 | Breast | breast invasive carcinoma | Female | <65 | I/II | Unknown | Unknown | SD | ||
| LAMP1 | insertion | Frame_Shift_Ins | novel | c.167_168insTAAGCATCCTCTCTTT | p.Ser58HisfsTer9 | p.S58Hfs*9 | P11279 | protein_coding | TCGA-BH-A0BR-01 | Breast | breast invasive carcinoma | Female | <65 | I/II | Unknown | Unknown | SD | ||
| LAMP1 | SNV | Missense_Mutation | novel | c.127A>C | p.Met43Leu | p.M43L | P11279 | protein_coding | tolerated(0.42) | benign(0.003) | TCGA-2W-A8YY-01 | Cervix | cervical & endocervical cancer | Female | <65 | I/II | Chemotherapy | cisplatin | CR |
| LAMP1 | SNV | Missense_Mutation | c.1065C>G | p.Phe355Leu | p.F355L | P11279 | protein_coding | deleterious(0) | possibly_damaging(0.792) | TCGA-C5-A1M6-01 | Cervix | cervical & endocervical cancer | Female | <65 | I/II | Chemotherapy | cisplatin | PD | |
| LAMP1 | SNV | Missense_Mutation | rs370286796 | c.752N>T | p.Thr251Met | p.T251M | P11279 | protein_coding | tolerated(0.24) | possibly_damaging(0.462) | TCGA-A6-2681-01 | Colorectum | colon adenocarcinoma | Female | >=65 | I/II | Unknown | Unknown | PD |
| LAMP1 | SNV | Missense_Mutation | rs757618803 | c.1046N>T | p.Ala349Val | p.A349V | P11279 | protein_coding | tolerated(0.15) | benign(0.08) | TCGA-AA-3877-01 | Colorectum | colon adenocarcinoma | Female | >=65 | I/II | Unknown | Unknown | SD |
| LAMP1 | SNV | Missense_Mutation | rs371034089 | c.967G>A | p.Gly323Ser | p.G323S | P11279 | protein_coding | tolerated(1) | benign(0.001) | TCGA-AD-6895-01 | Colorectum | colon adenocarcinoma | Male | >=65 | III/IV | Unknown | Unknown | SD |
| LAMP1 | SNV | Missense_Mutation | rs767683537 | c.1033N>T | p.Arg345Cys | p.R345C | P11279 | protein_coding | tolerated(0.17) | possibly_damaging(0.759) | TCGA-AD-6964-01 | Colorectum | colon adenocarcinoma | Male | <65 | III/IV | Chemotherapy | folfox | PD |
| LAMP1 | SNV | Missense_Mutation | c.1169N>A | p.Gly390Asp | p.G390D | P11279 | protein_coding | deleterious(0) | probably_damaging(0.98) | TCGA-F4-6570-01 | Colorectum | colon adenocarcinoma | Female | >=65 | I/II | Unknown | Unknown | SD |
| Page: 1 2 3 4 |
Top |
Related drugs of malignant transformation related genes |
| Identification of chemicals and drugs interact with genes involved in malignant transfromation |
| (DGIdb 4.0) |
| Entrez ID | Symbol | Category | Interaction Types | Drug Claim Name | Drug Name | PMIDs |
| 3916 | LAMP1 | DRUGGABLE GENOME, EXTERNAL SIDE OF PLASMA MEMBRANE | DIMETHYL SULFOXIDE | 2243101 |
| Page: 1 |

Copyright 2023-Present -The University of Texas Health Science Center at Houston |