
|
|||||
|
 | |
| |
| |
| |
| |
| |
|
Gene: JUP |
Gene summary for JUP |
| Gene information | Species | Human | Gene symbol | JUP | Gene ID | 3728 |
| Gene name | junction plakoglobin | |
| Gene Alias | CTNNG | |
| Cytomap | 17q21.2 | |
| Gene Type | protein-coding | GO ID | GO:0001508 | UniProtAcc | A0A0S2Z487 |
Top |
Malignant transformation analysis |
| Identification of the aberrant gene expression in precancerous and cancerous lesions by comparing the gene expression of stem-like cells in diseased tissues with normal stem cells |
| Entrez ID | Symbol | Replicates | Species | Organ | Tissue | Adj P-value | Log2FC | Malignancy |
| 3728 | JUP | CA_HPV_1 | Human | Cervix | CC | 2.27e-15 | -4.54e-01 | 0.0264 |
| 3728 | JUP | CA_HPV_3 | Human | Cervix | CC | 2.58e-02 | 2.68e-01 | 0.0414 |
| 3728 | JUP | N_HPV_1 | Human | Cervix | N_HPV | 7.83e-05 | -3.61e-01 | 0.0079 |
| 3728 | JUP | CCI_1 | Human | Cervix | CC | 2.14e-05 | 6.72e-01 | 0.528 |
| 3728 | JUP | CCI_3 | Human | Cervix | CC | 3.47e-03 | 6.41e-01 | 0.516 |
| 3728 | JUP | Tumor | Human | Cervix | CC | 1.42e-40 | 8.08e-01 | 0.1241 |
| 3728 | JUP | sample3 | Human | Cervix | CC | 1.13e-47 | 7.85e-01 | 0.1387 |
| 3728 | JUP | L1 | Human | Cervix | CC | 4.14e-12 | 4.55e-01 | 0.0802 |
| 3728 | JUP | T3 | Human | Cervix | CC | 7.08e-42 | 7.84e-01 | 0.1389 |
| 3728 | JUP | HTA11_3410_2000001011 | Human | Colorectum | AD | 5.37e-40 | 9.97e-01 | 0.0155 |
| 3728 | JUP | HTA11_2487_2000001011 | Human | Colorectum | SER | 1.28e-40 | 1.61e+00 | -0.1808 |
| 3728 | JUP | HTA11_2951_2000001011 | Human | Colorectum | AD | 9.47e-14 | 1.32e+00 | 0.0216 |
| 3728 | JUP | HTA11_1938_2000001011 | Human | Colorectum | AD | 4.13e-34 | 1.42e+00 | -0.0811 |
| 3728 | JUP | HTA11_78_2000001011 | Human | Colorectum | AD | 2.23e-17 | 8.59e-01 | -0.1088 |
| 3728 | JUP | HTA11_347_2000001011 | Human | Colorectum | AD | 7.55e-59 | 1.38e+00 | -0.1954 |
| 3728 | JUP | HTA11_411_2000001011 | Human | Colorectum | SER | 7.64e-15 | 2.32e+00 | -0.2602 |
| 3728 | JUP | HTA11_2112_2000001011 | Human | Colorectum | SER | 1.98e-19 | 1.83e+00 | -0.2196 |
| 3728 | JUP | HTA11_3361_2000001011 | Human | Colorectum | AD | 1.87e-21 | 1.19e+00 | -0.1207 |
| 3728 | JUP | HTA11_83_2000001011 | Human | Colorectum | SER | 1.04e-28 | 1.29e+00 | -0.1526 |
| 3728 | JUP | HTA11_696_2000001011 | Human | Colorectum | AD | 7.71e-54 | 1.33e+00 | -0.1464 |
| Page: 1 2 3 4 5 6 7 8 9 10 11 |
| Tissue | Expression Dynamics | Abbreviation |
| Cervix | 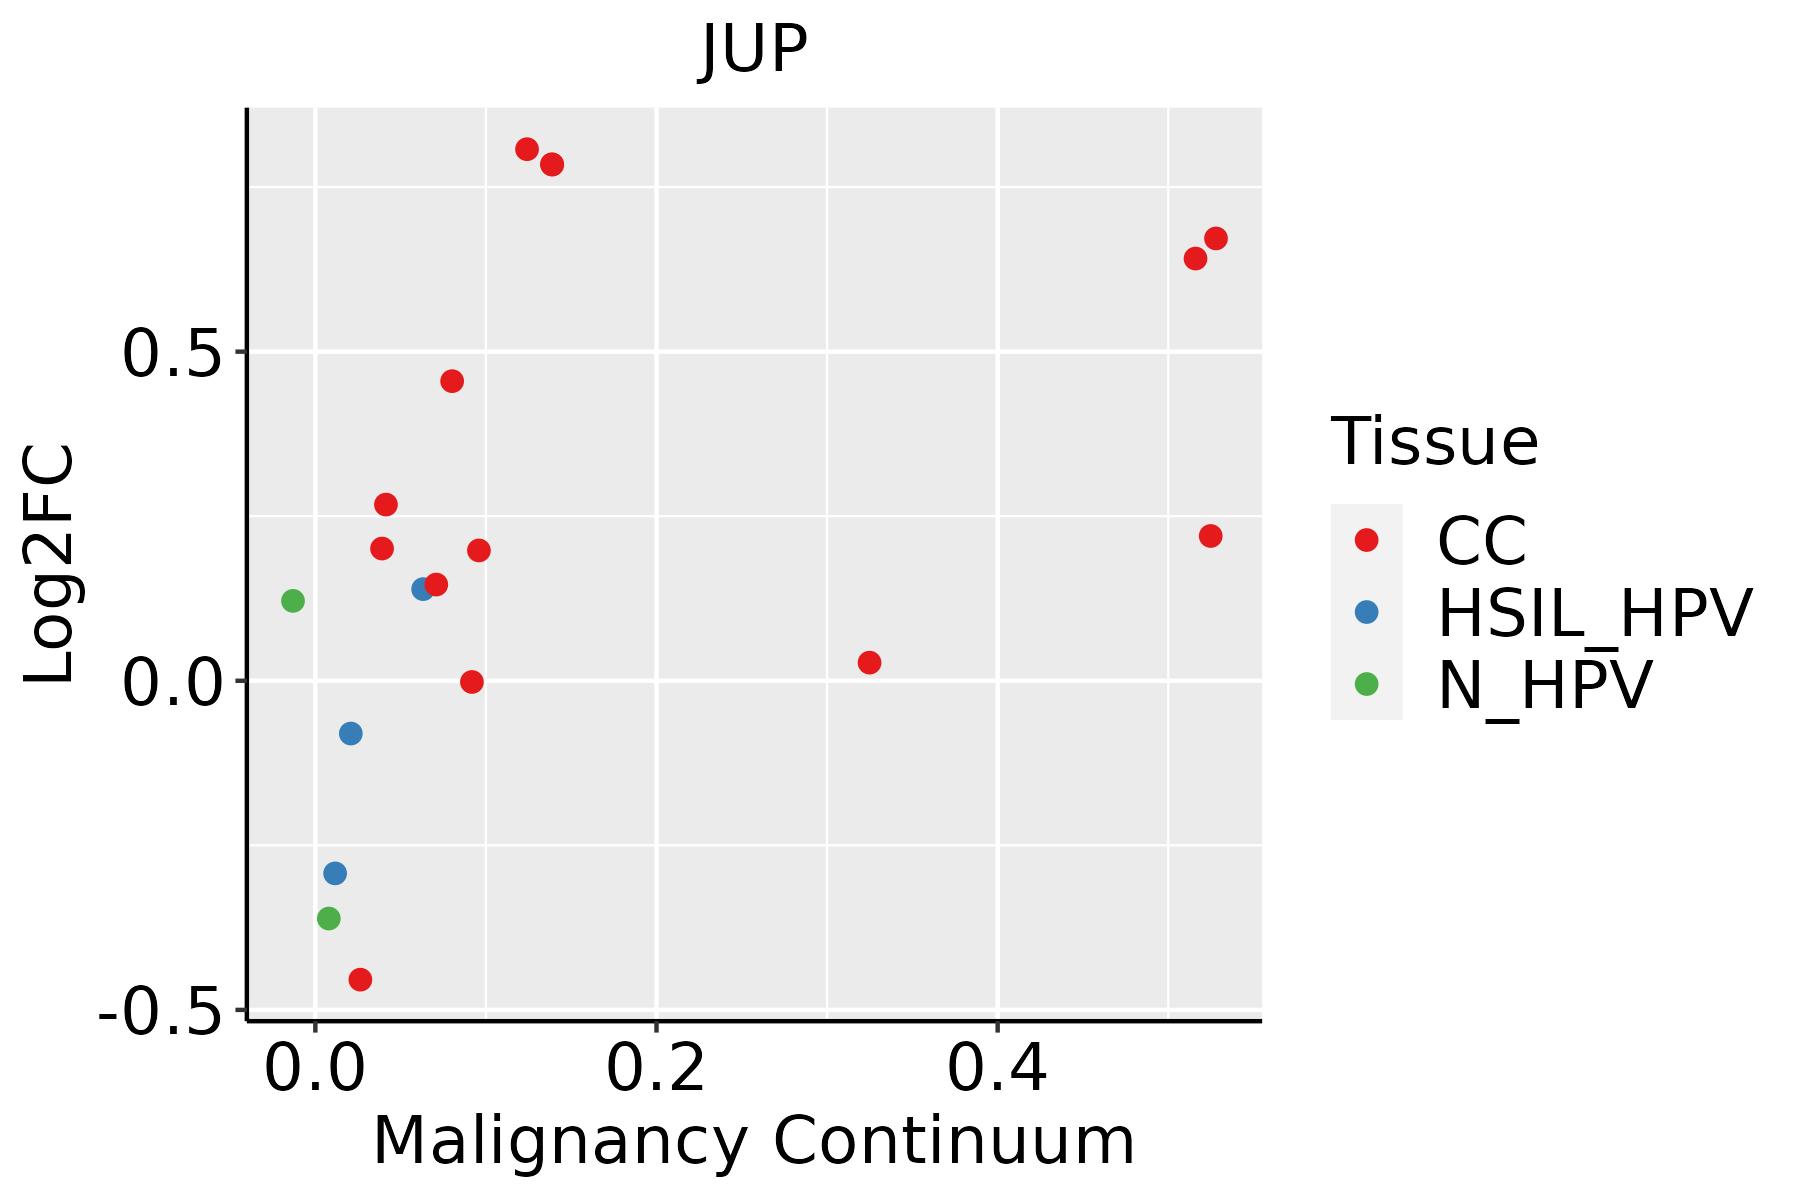 | CC: Cervix cancer |
| HSIL_HPV: HPV-infected high-grade squamous intraepithelial lesions | ||
| N_HPV: HPV-infected normal cervix | ||
| Colorectum (GSE201348) |  | FAP: Familial adenomatous polyposis |
| CRC: Colorectal cancer | ||
| Colorectum (HTA11) | 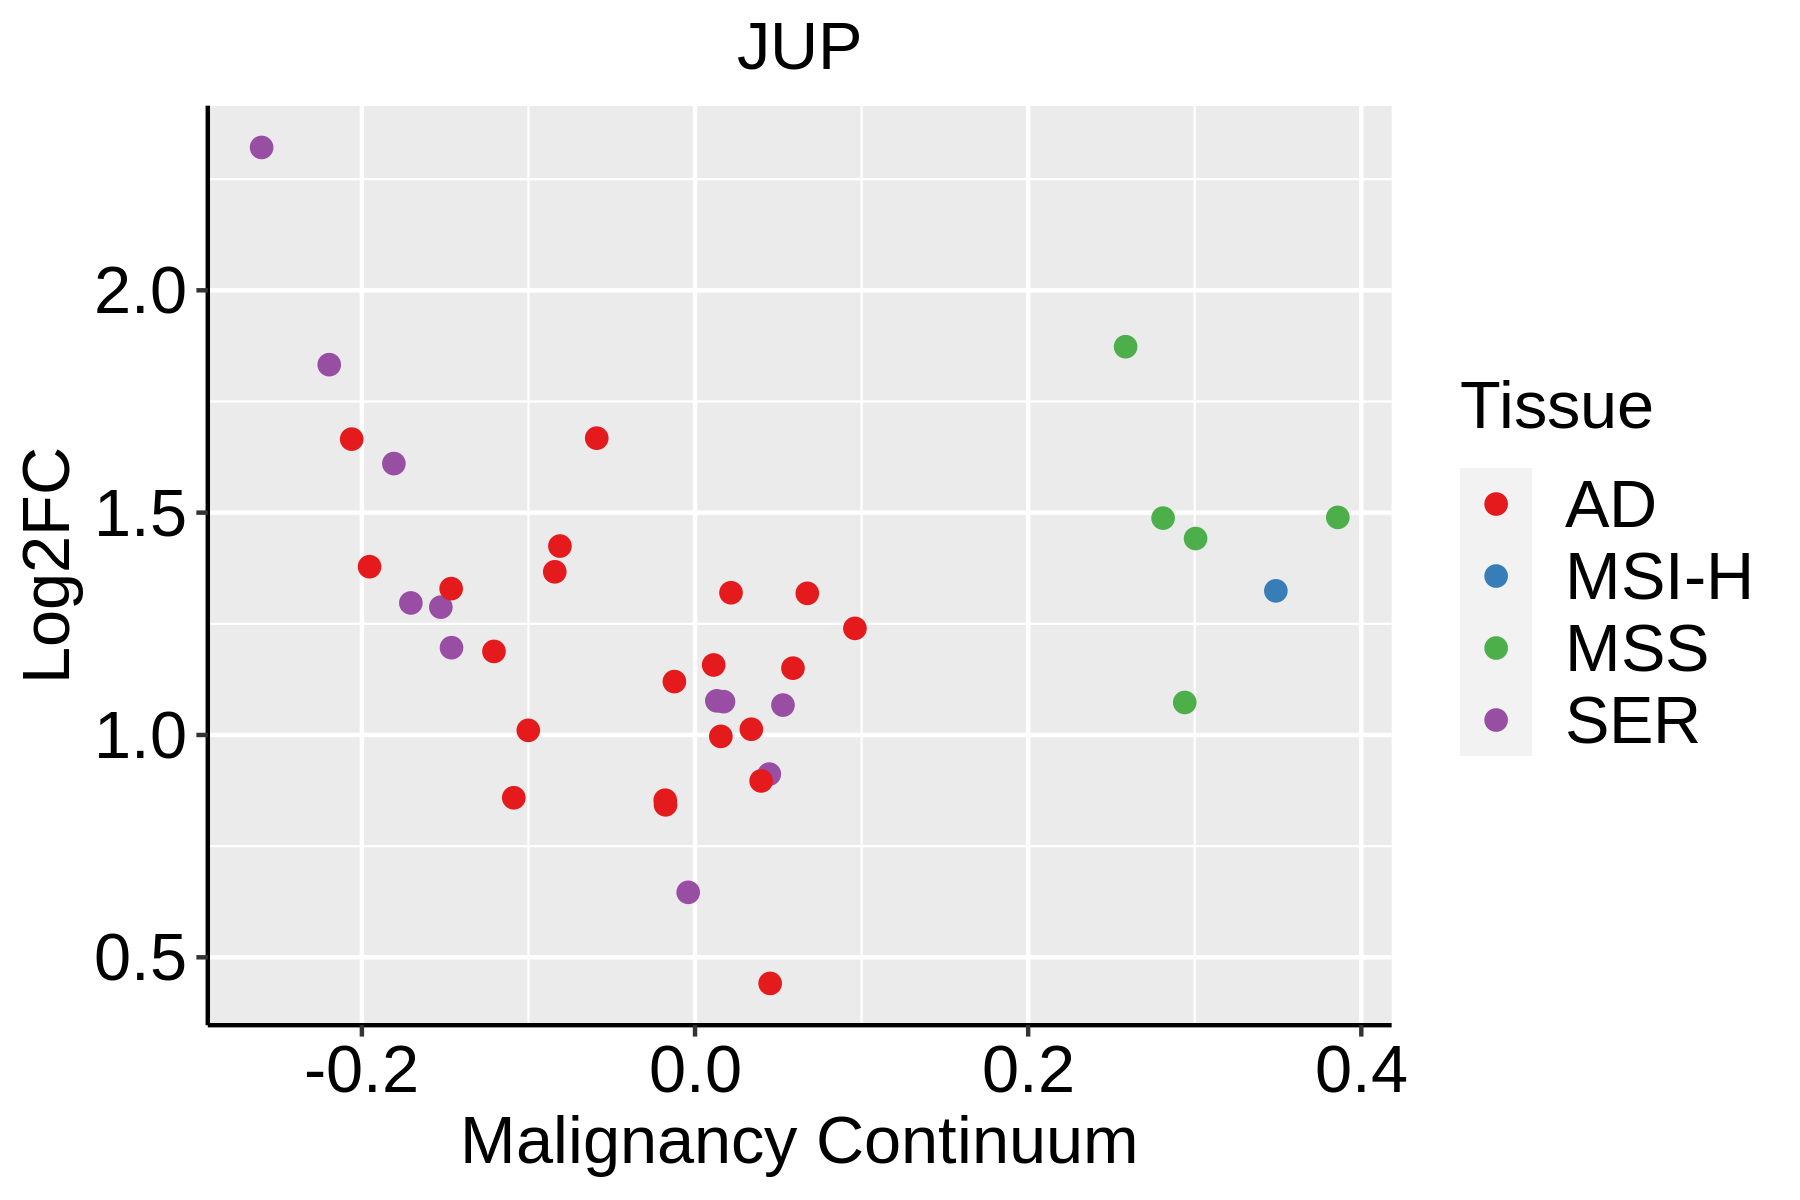 | AD: Adenomas |
| SER: Sessile serrated lesions | ||
| MSI-H: Microsatellite-high colorectal cancer | ||
| MSS: Microsatellite stable colorectal cancer | ||
| Endometrium | 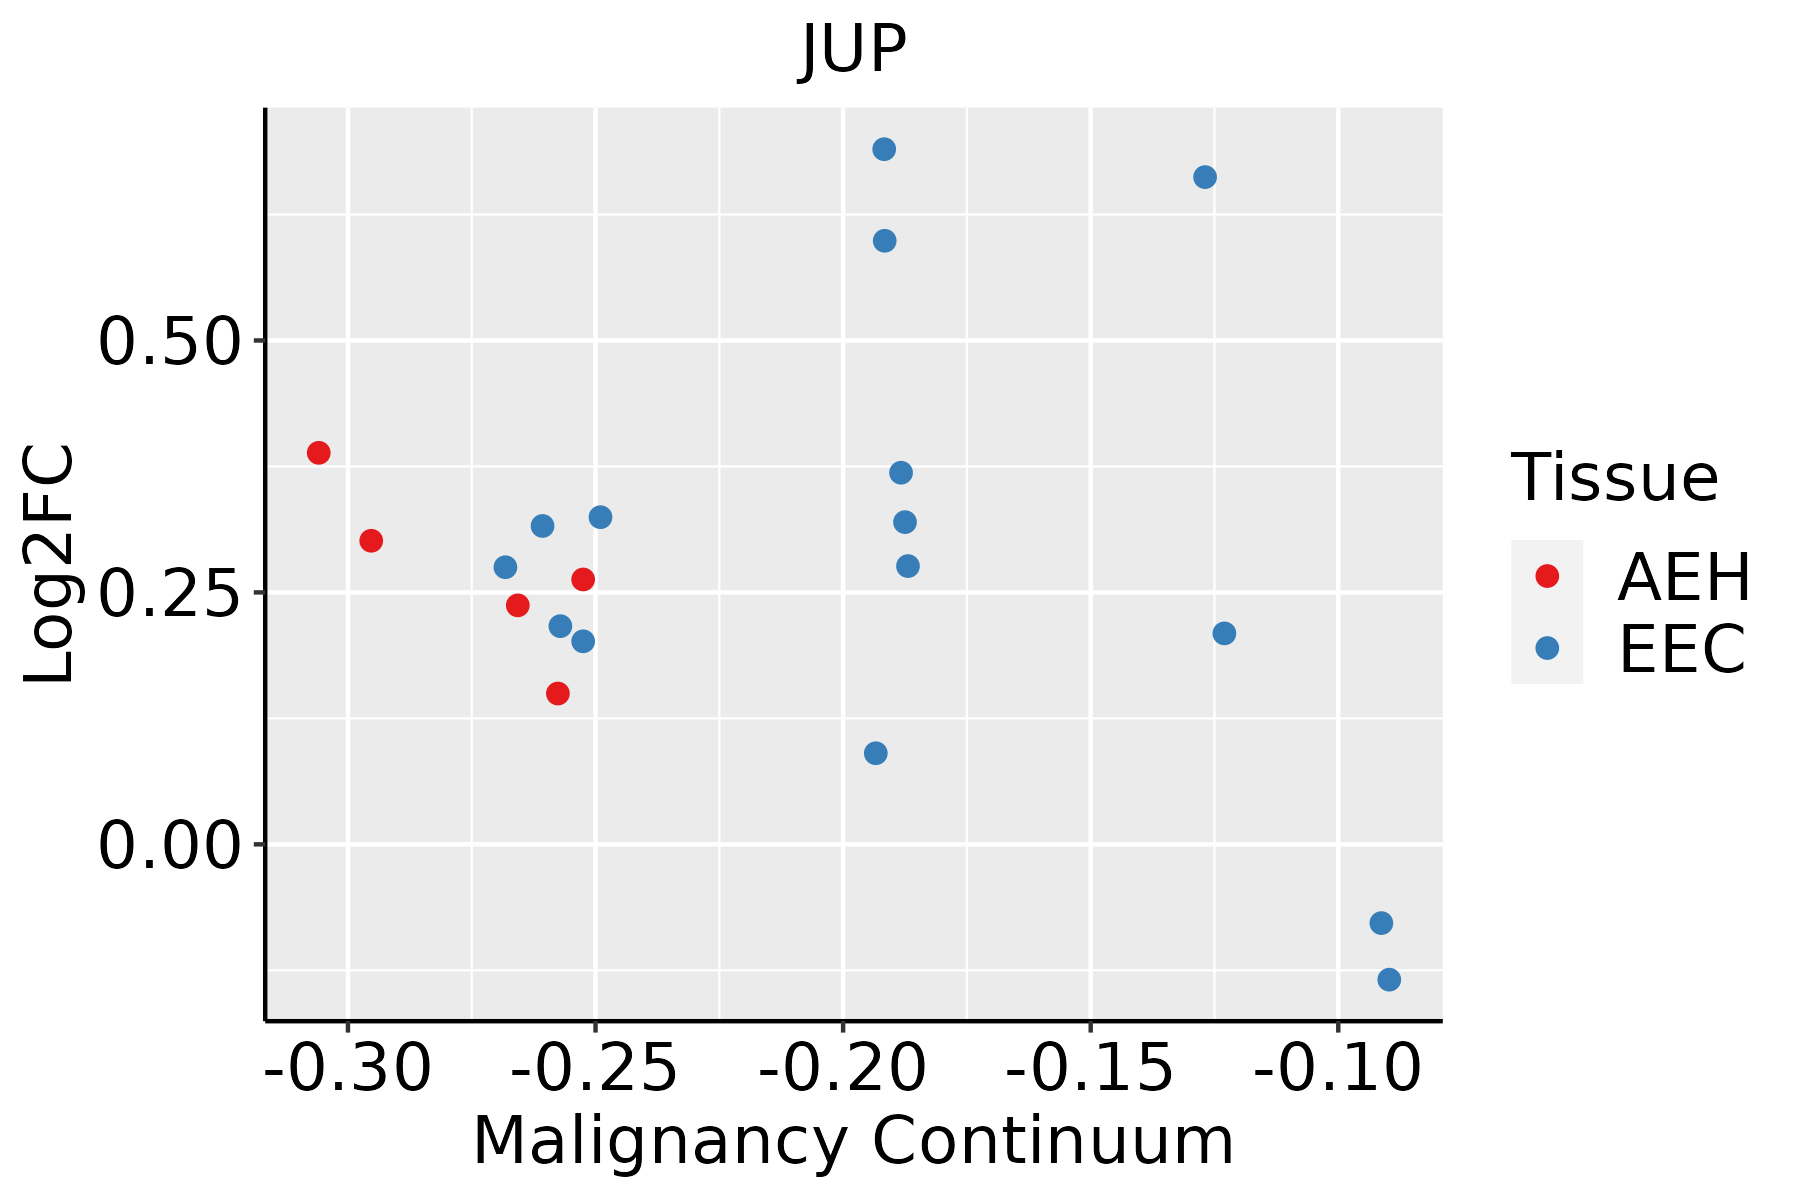 | AEH: Atypical endometrial hyperplasia |
| EEC: Endometrioid Cancer | ||
| Esophagus | 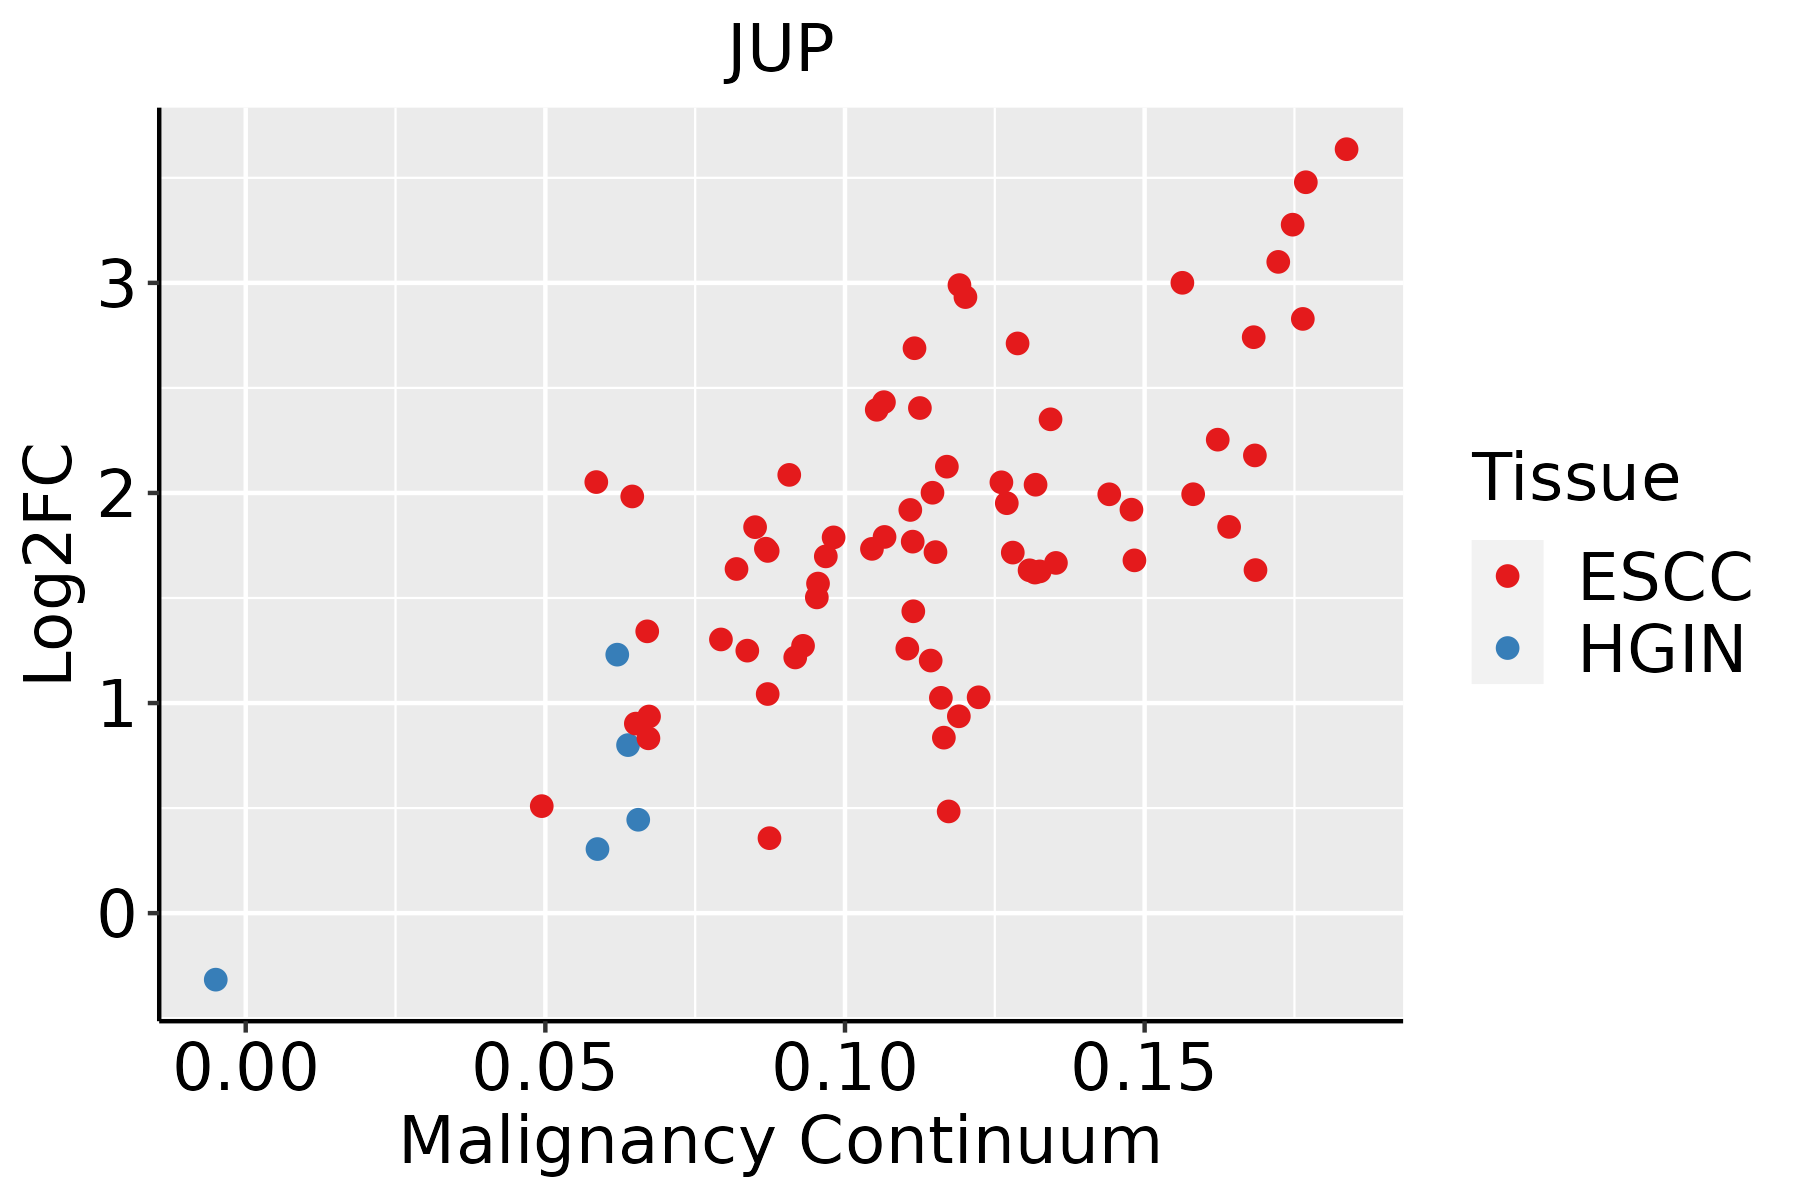 | ESCC: Esophageal squamous cell carcinoma |
| HGIN: High-grade intraepithelial neoplasias | ||
| LGIN: Low-grade intraepithelial neoplasias | ||
| Liver | 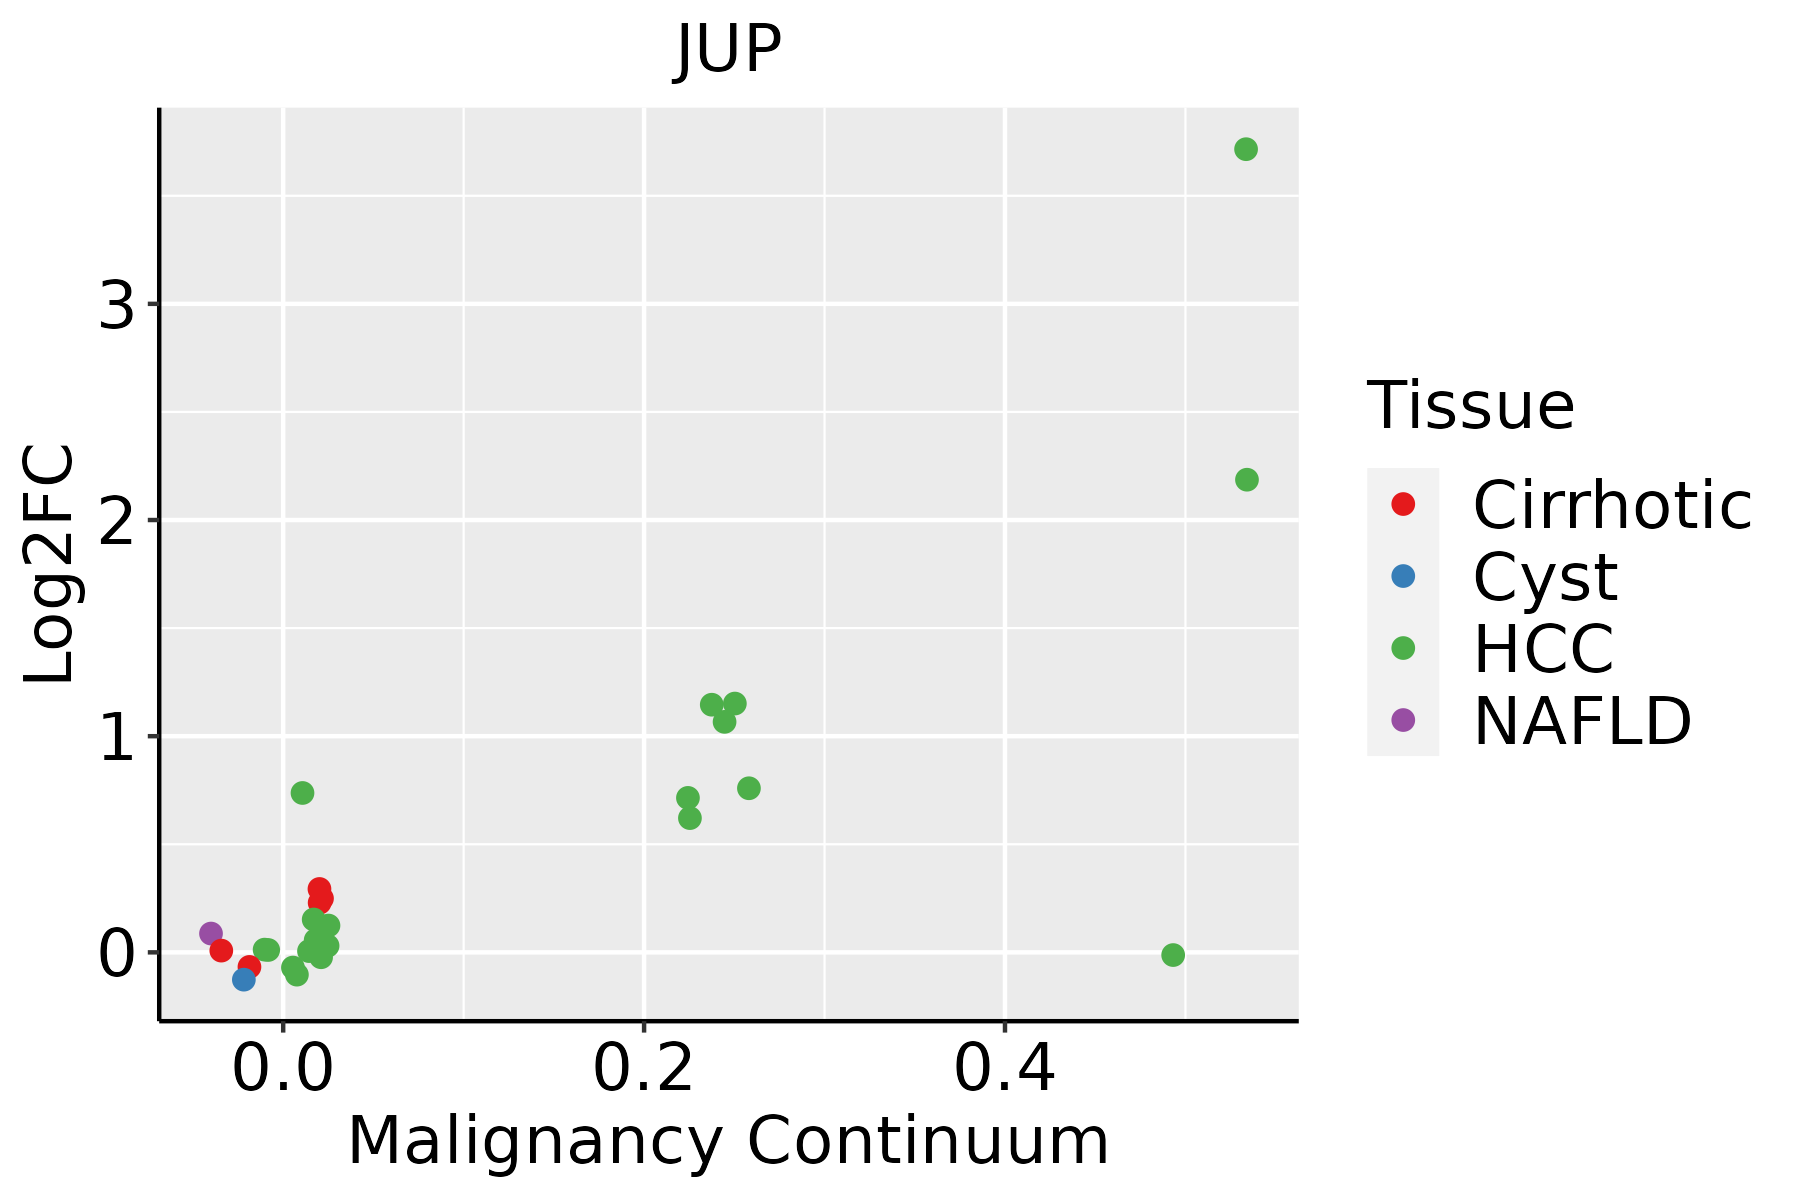 | HCC: Hepatocellular carcinoma |
| NAFLD: Non-alcoholic fatty liver disease | ||
| Oral Cavity |  | EOLP: Erosive Oral lichen planus |
| LP: leukoplakia | ||
| NEOLP: Non-erosive oral lichen planus | ||
| OSCC: Oral squamous cell carcinoma | ||
| Skin | 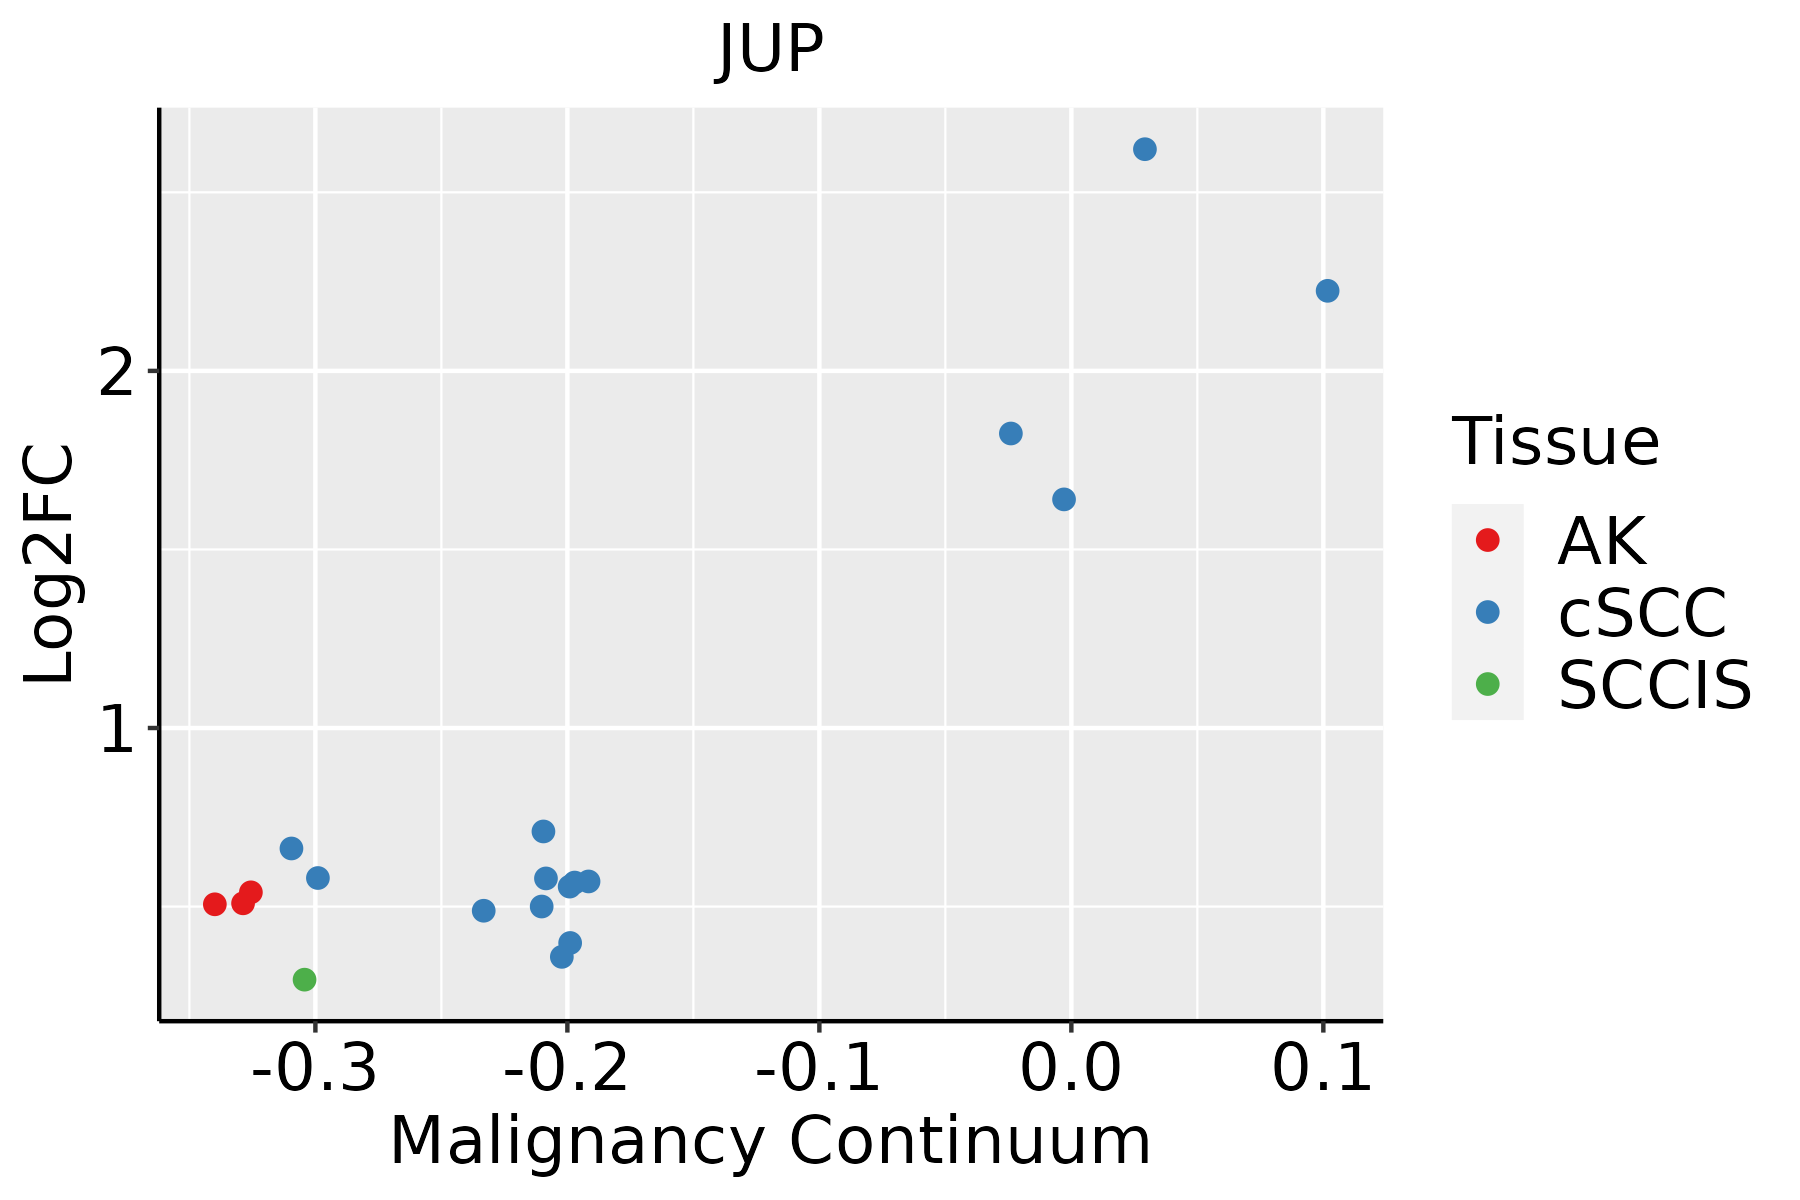 | AK: Actinic keratosis |
| cSCC: Cutaneous squamous cell carcinoma | ||
| SCCIS:squamous cell carcinoma in situ | ||
| Thyroid | 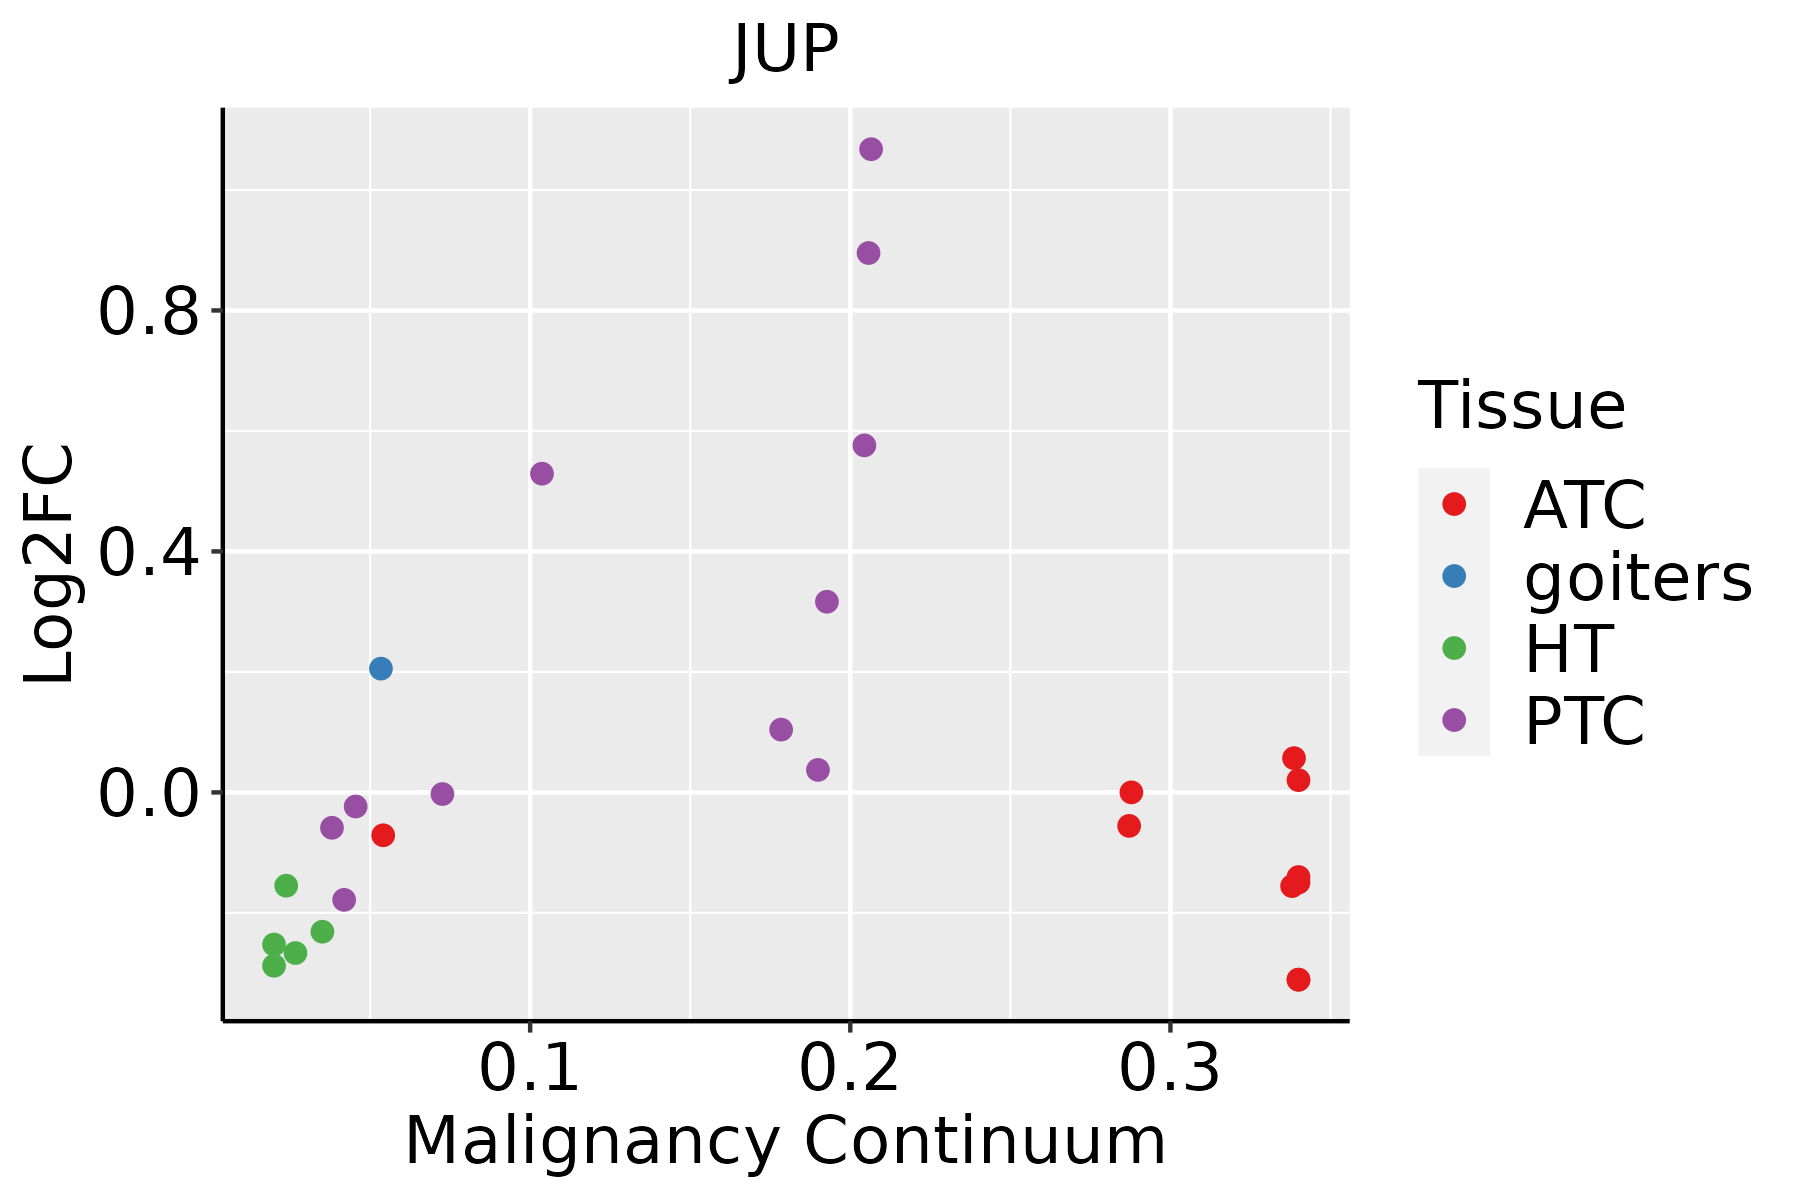 | ATC: Anaplastic thyroid cancer |
| HT: Hashimoto's thyroiditis | ||
| PTC: Papillary thyroid cancer |
| ∗log2FC in expression of this searched gene in stem-like cells from each diseased tissue sample relative to stem-like cells in normal samples in each tissue plotted against the malignancy continuum. Samples are colored based on if they are from different disease stage. |
Top |
Malignant transformation related pathway analysis |
| Find out the enriched GO biological processes and KEGG pathways involved in transition from healthy to precancer to cancer |
| Tissue | Disease Stage | Enriched GO biological Processes |
| Colorectum | AD |  |
| Colorectum | SER |  |
| Colorectum | MSS |  |
| Colorectum | MSI-H |  |
| Colorectum | FAP |  |
| ∗Top 15 enriched GO BP terms are showed in the bar plot of each disease state in each tissue. Each row represents a significant GO biological process which is colored according to the -log10(p.adjust). |
| Page: 1 2 3 4 5 6 7 8 9 |
| GO ID | Tissue | Disease Stage | Description | Gene Ratio | Bg Ratio | pvalue | p.adjust | Count |
| GO:00901322 | Colorectum | MSS | epithelium migration | 93/3467 | 360/18723 | 3.30e-04 | 4.24e-03 | 93 |
| GO:00106312 | Colorectum | MSS | epithelial cell migration | 92/3467 | 357/18723 | 3.87e-04 | 4.86e-03 | 92 |
| GO:00860042 | Colorectum | MSS | regulation of cardiac muscle cell contraction | 15/3467 | 34/18723 | 5.22e-04 | 5.99e-03 | 15 |
| GO:00106322 | Colorectum | MSS | regulation of epithelial cell migration | 77/3467 | 292/18723 | 5.39e-04 | 6.04e-03 | 77 |
| GO:00901302 | Colorectum | MSS | tissue migration | 93/3467 | 365/18723 | 5.42e-04 | 6.06e-03 | 93 |
| GO:00423062 | Colorectum | MSS | regulation of protein import into nucleus | 22/3467 | 60/18723 | 6.99e-04 | 7.52e-03 | 22 |
| GO:0086001 | Colorectum | MSS | cardiac muscle cell action potential | 26/3467 | 76/18723 | 8.18e-04 | 8.59e-03 | 26 |
| GO:00510912 | Colorectum | MSS | positive regulation of DNA-binding transcription factor activity | 69/3467 | 260/18723 | 8.44e-04 | 8.71e-03 | 69 |
| GO:0086065 | Colorectum | MSS | cell communication involved in cardiac conduction | 21/3467 | 58/18723 | 1.11e-03 | 1.09e-02 | 21 |
| GO:00902572 | Colorectum | MSS | regulation of muscle system process | 66/3467 | 252/18723 | 1.55e-03 | 1.41e-02 | 66 |
| GO:00423072 | Colorectum | MSS | positive regulation of protein import into nucleus | 16/3467 | 41/18723 | 1.71e-03 | 1.54e-02 | 16 |
| GO:00973051 | Colorectum | MSS | response to alcohol | 66/3467 | 253/18723 | 1.73e-03 | 1.54e-02 | 66 |
| GO:0051090 | Colorectum | MSS | regulation of DNA-binding transcription factor activity | 106/3467 | 440/18723 | 1.88e-03 | 1.65e-02 | 106 |
| GO:00902631 | Colorectum | MSS | positive regulation of canonical Wnt signaling pathway | 32/3467 | 106/18723 | 2.41e-03 | 1.96e-02 | 32 |
| GO:0086005 | Colorectum | MSS | ventricular cardiac muscle cell action potential | 14/3467 | 35/18723 | 2.50e-03 | 2.01e-02 | 14 |
| GO:0086091 | Colorectum | MSS | regulation of heart rate by cardiac conduction | 15/3467 | 39/18723 | 2.80e-03 | 2.19e-02 | 15 |
| GO:1903115 | Colorectum | MSS | regulation of actin filament-based movement | 15/3467 | 39/18723 | 2.80e-03 | 2.19e-02 | 15 |
| GO:00435422 | Colorectum | MSS | endothelial cell migration | 70/3467 | 279/18723 | 3.69e-03 | 2.71e-02 | 70 |
| GO:0070252 | Colorectum | MSS | actin-mediated cell contraction | 29/3467 | 97/18723 | 4.38e-03 | 3.10e-02 | 29 |
| GO:0086003 | Colorectum | MSS | cardiac muscle cell contraction | 23/3467 | 73/18723 | 5.22e-03 | 3.57e-02 | 23 |
| Page: 1 2 3 4 5 6 7 8 9 10 11 12 13 14 15 16 17 18 19 20 21 22 23 24 25 26 27 28 29 30 31 32 33 34 35 36 37 38 39 40 41 42 43 44 45 46 47 48 49 50 51 52 53 54 55 56 57 58 |
| Pathway ID | Tissue | Disease Stage | Description | Gene Ratio | Bg Ratio | pvalue | p.adjust | qvalue | Count |
| hsa05412 | Colorectum | FAP | Arrhythmogenic right ventricular cardiomyopathy | 23/1404 | 77/8465 | 2.58e-03 | 1.19e-02 | 7.23e-03 | 23 |
| hsa05202 | Colorectum | FAP | Transcriptional misregulation in cancer | 45/1404 | 193/8465 | 9.19e-03 | 3.33e-02 | 2.03e-02 | 45 |
| hsa054121 | Colorectum | FAP | Arrhythmogenic right ventricular cardiomyopathy | 23/1404 | 77/8465 | 2.58e-03 | 1.19e-02 | 7.23e-03 | 23 |
| hsa052021 | Colorectum | FAP | Transcriptional misregulation in cancer | 45/1404 | 193/8465 | 9.19e-03 | 3.33e-02 | 2.03e-02 | 45 |
| hsa052215 | Esophagus | ESCC | Acute myeloid leukemia | 49/4205 | 67/8465 | 7.43e-05 | 3.07e-04 | 1.57e-04 | 49 |
| hsa052028 | Esophagus | ESCC | Transcriptional misregulation in cancer | 116/4205 | 193/8465 | 2.08e-03 | 5.95e-03 | 3.05e-03 | 116 |
| hsa0522113 | Esophagus | ESCC | Acute myeloid leukemia | 49/4205 | 67/8465 | 7.43e-05 | 3.07e-04 | 1.57e-04 | 49 |
| hsa0520213 | Esophagus | ESCC | Transcriptional misregulation in cancer | 116/4205 | 193/8465 | 2.08e-03 | 5.95e-03 | 3.05e-03 | 116 |
| hsa05221 | Liver | HCC | Acute myeloid leukemia | 41/4020 | 67/8465 | 1.64e-02 | 3.90e-02 | 2.17e-02 | 41 |
| hsa052211 | Liver | HCC | Acute myeloid leukemia | 41/4020 | 67/8465 | 1.64e-02 | 3.90e-02 | 2.17e-02 | 41 |
| hsa052214 | Oral cavity | OSCC | Acute myeloid leukemia | 42/3704 | 67/8465 | 1.34e-03 | 3.75e-03 | 1.91e-03 | 42 |
| hsa0522112 | Oral cavity | OSCC | Acute myeloid leukemia | 42/3704 | 67/8465 | 1.34e-03 | 3.75e-03 | 1.91e-03 | 42 |
| hsa0522121 | Oral cavity | EOLP | Acute myeloid leukemia | 19/1218 | 67/8465 | 2.20e-03 | 7.32e-03 | 4.32e-03 | 19 |
| hsa052213 | Oral cavity | EOLP | Acute myeloid leukemia | 19/1218 | 67/8465 | 2.20e-03 | 7.32e-03 | 4.32e-03 | 19 |
| Page: 1 |
Top |
Cell-cell communication analysis |
| Identification of potential cell-cell interactions between two cell types and their ligand-receptor pairs for different disease states |
| Ligand | Receptor | LRpair | Pathway | Tissue | Disease Stage |
| Page: 1 |
Top |
Single-cell gene regulatory network inference analysis |
| Find out the significant the regulons (TFs) and the target genes of each regulon across cell types for different disease states |
| TF | Cell Type | Tissue | Disease Stage | Target Gene | RSS | Regulon Activity |
| ∗The dot plots of a searched regulon are shown for all cell subpopulations in each disease state of each tissue based on the regulon specific score inferred using pySCENIC and by calculating the average expression. |
| Page: 1 |
Top |
Somatic mutation of malignant transformation related genes |
| Annotation of somatic variants for genes involved in malignant transformation |
| Hugo Symbol | Variant Class | Variant Classification | dbSNP RS | HGVSc | HGVSp | HGVSp Short | SWISSPROT | BIOTYPE | SIFT | PolyPhen | Tumor Sample Barcode | Tissue | Histology | Sex | Age | Stage | Therapy Types | Drugs | Outcome |
| JUP | SNV | Missense_Mutation | novel | c.1576N>A | p.Arg526Ser | p.R526S | P14923 | protein_coding | deleterious(0.05) | benign(0.382) | TCGA-A7-A0DB-01 | Breast | breast invasive carcinoma | Female | <65 | I/II | Hormone Therapy | arimidex | SD |
| JUP | SNV | Missense_Mutation | novel | c.538N>T | p.Met180Leu | p.M180L | P14923 | protein_coding | tolerated(0.05) | benign(0.055) | TCGA-AC-A62Y-01 | Breast | breast invasive carcinoma | Female | >=65 | I/II | Unknown | Unknown | SD |
| JUP | SNV | Missense_Mutation | c.1643N>T | p.Gln548Leu | p.Q548L | P14923 | protein_coding | tolerated(0.17) | benign(0.035) | TCGA-D8-A1XQ-01 | Breast | breast invasive carcinoma | Female | >=65 | I/II | Unknown | Unknown | SD | |
| JUP | SNV | Missense_Mutation | novel | c.1800N>G | p.Ile600Met | p.I600M | P14923 | protein_coding | deleterious(0.04) | probably_damaging(0.992) | TCGA-S3-A6ZF-01 | Breast | breast invasive carcinoma | Female | <65 | I/II | Chemotherapy | taxotere | CR |
| JUP | insertion | Frame_Shift_Ins | novel | c.104_105insT | p.Ser36LeufsTer12 | p.S36Lfs*12 | P14923 | protein_coding | TCGA-A7-A0CJ-01 | Breast | breast invasive carcinoma | Female | <65 | I/II | Chemotherapy | cytoxan | SD | ||
| JUP | insertion | Frame_Shift_Ins | novel | c.103_104insTCTCTGAACCCACAGCCCTGACTTTCCCTCTGAT | p.Pro35LeufsTer24 | p.P35Lfs*24 | P14923 | protein_coding | TCGA-A7-A0CJ-01 | Breast | breast invasive carcinoma | Female | <65 | I/II | Chemotherapy | cytoxan | SD | ||
| JUP | insertion | In_Frame_Ins | novel | c.1850_1851insTGTGAGTATCCTAGGTTGGACCGCAGTAGTTGGTTGTGCAAGTTG | p.Ala617_Ala618insValSerIleLeuGlyTrpThrAlaValValGlyCysAlaSerTrp | p.A617_A618insVSILGWTAVVGCASW | P14923 | protein_coding | TCGA-AN-A0FS-01 | Breast | breast invasive carcinoma | Female | <65 | I/II | Unknown | Unknown | SD | ||
| JUP | SNV | Missense_Mutation | rs781883243,rs794729051 | c.1880N>T | p.Ser627Leu | p.S627L | P14923 | protein_coding | tolerated(0.06) | benign(0.219) | TCGA-DG-A2KH-01 | Cervix | cervical & endocervical cancer | Female | <65 | I/II | Unknown | Unknown | SD |
| JUP | SNV | Missense_Mutation | rs781883243,rs794729051 | c.1880N>T | p.Ser627Leu | p.S627L | P14923 | protein_coding | tolerated(0.06) | benign(0.219) | TCGA-Q1-A73O-01 | Cervix | cervical & endocervical cancer | Female | <65 | I/II | Chemotherapy | cisplatin | CR |
| JUP | insertion | Frame_Shift_Ins | novel | c.1550_1551insC | p.Leu518AlafsTer93 | p.L518Afs*93 | P14923 | protein_coding | TCGA-C5-A8XJ-01 | Cervix | cervical & endocervical cancer | Female | >=65 | I/II | Chemotherapy | cisplatin | SD |
| Page: 1 2 3 4 5 6 7 8 9 10 |
Top |
Related drugs of malignant transformation related genes |
| Identification of chemicals and drugs interact with genes involved in malignant transfromation |
| (DGIdb 4.0) |
| Entrez ID | Symbol | Category | Interaction Types | Drug Claim Name | Drug Name | PMIDs |
| Page: 1 |

Copyright 2023-Present -The University of Texas Health Science Center at Houston |