
|
|||||
|
 | |
| |
| |
| |
| |
| |
|
Gene: IMPACT |
Gene summary for IMPACT |
| Gene information | Species | Human | Gene symbol | IMPACT | Gene ID | 55364 |
| Gene name | impact RWD domain protein | |
| Gene Alias | RWDD5 | |
| Cytomap | 18q11.2 | |
| Gene Type | protein-coding | GO ID | GO:0000122 | UniProtAcc | A0A024RC24 |
Top |
Malignant transformation analysis |
| Identification of the aberrant gene expression in precancerous and cancerous lesions by comparing the gene expression of stem-like cells in diseased tissues with normal stem cells |
| Entrez ID | Symbol | Replicates | Species | Organ | Tissue | Adj P-value | Log2FC | Malignancy |
| 55364 | IMPACT | LZE2T | Human | Esophagus | ESCC | 1.34e-05 | 7.14e-01 | 0.082 |
| 55364 | IMPACT | LZE4T | Human | Esophagus | ESCC | 7.96e-07 | 2.07e-01 | 0.0811 |
| 55364 | IMPACT | LZE5T | Human | Esophagus | ESCC | 2.22e-04 | 2.16e-01 | 0.0514 |
| 55364 | IMPACT | LZE7T | Human | Esophagus | ESCC | 3.32e-02 | 2.03e-01 | 0.0667 |
| 55364 | IMPACT | LZE8T | Human | Esophagus | ESCC | 1.28e-03 | 1.26e-01 | 0.067 |
| 55364 | IMPACT | LZE20T | Human | Esophagus | ESCC | 9.91e-04 | 1.44e-01 | 0.0662 |
| 55364 | IMPACT | LZE22T | Human | Esophagus | ESCC | 1.17e-02 | 2.16e-01 | 0.068 |
| 55364 | IMPACT | LZE24T | Human | Esophagus | ESCC | 7.27e-09 | 3.34e-01 | 0.0596 |
| 55364 | IMPACT | P1T-E | Human | Esophagus | ESCC | 3.45e-12 | 3.51e-01 | 0.0875 |
| 55364 | IMPACT | P2T-E | Human | Esophagus | ESCC | 1.60e-31 | 5.94e-01 | 0.1177 |
| 55364 | IMPACT | P4T-E | Human | Esophagus | ESCC | 8.47e-29 | 7.00e-01 | 0.1323 |
| 55364 | IMPACT | P5T-E | Human | Esophagus | ESCC | 9.40e-21 | 3.90e-01 | 0.1327 |
| 55364 | IMPACT | P8T-E | Human | Esophagus | ESCC | 3.37e-18 | 3.07e-01 | 0.0889 |
| 55364 | IMPACT | P9T-E | Human | Esophagus | ESCC | 1.02e-16 | 5.09e-01 | 0.1131 |
| 55364 | IMPACT | P10T-E | Human | Esophagus | ESCC | 2.61e-25 | 4.89e-01 | 0.116 |
| 55364 | IMPACT | P11T-E | Human | Esophagus | ESCC | 1.75e-03 | 1.29e-01 | 0.1426 |
| 55364 | IMPACT | P12T-E | Human | Esophagus | ESCC | 1.53e-19 | 3.95e-01 | 0.1122 |
| 55364 | IMPACT | P15T-E | Human | Esophagus | ESCC | 3.28e-27 | 5.70e-01 | 0.1149 |
| 55364 | IMPACT | P16T-E | Human | Esophagus | ESCC | 3.88e-28 | 5.50e-01 | 0.1153 |
| 55364 | IMPACT | P17T-E | Human | Esophagus | ESCC | 2.39e-06 | 4.06e-01 | 0.1278 |
| Page: 1 2 3 4 5 6 |
| Tissue | Expression Dynamics | Abbreviation |
| Esophagus | 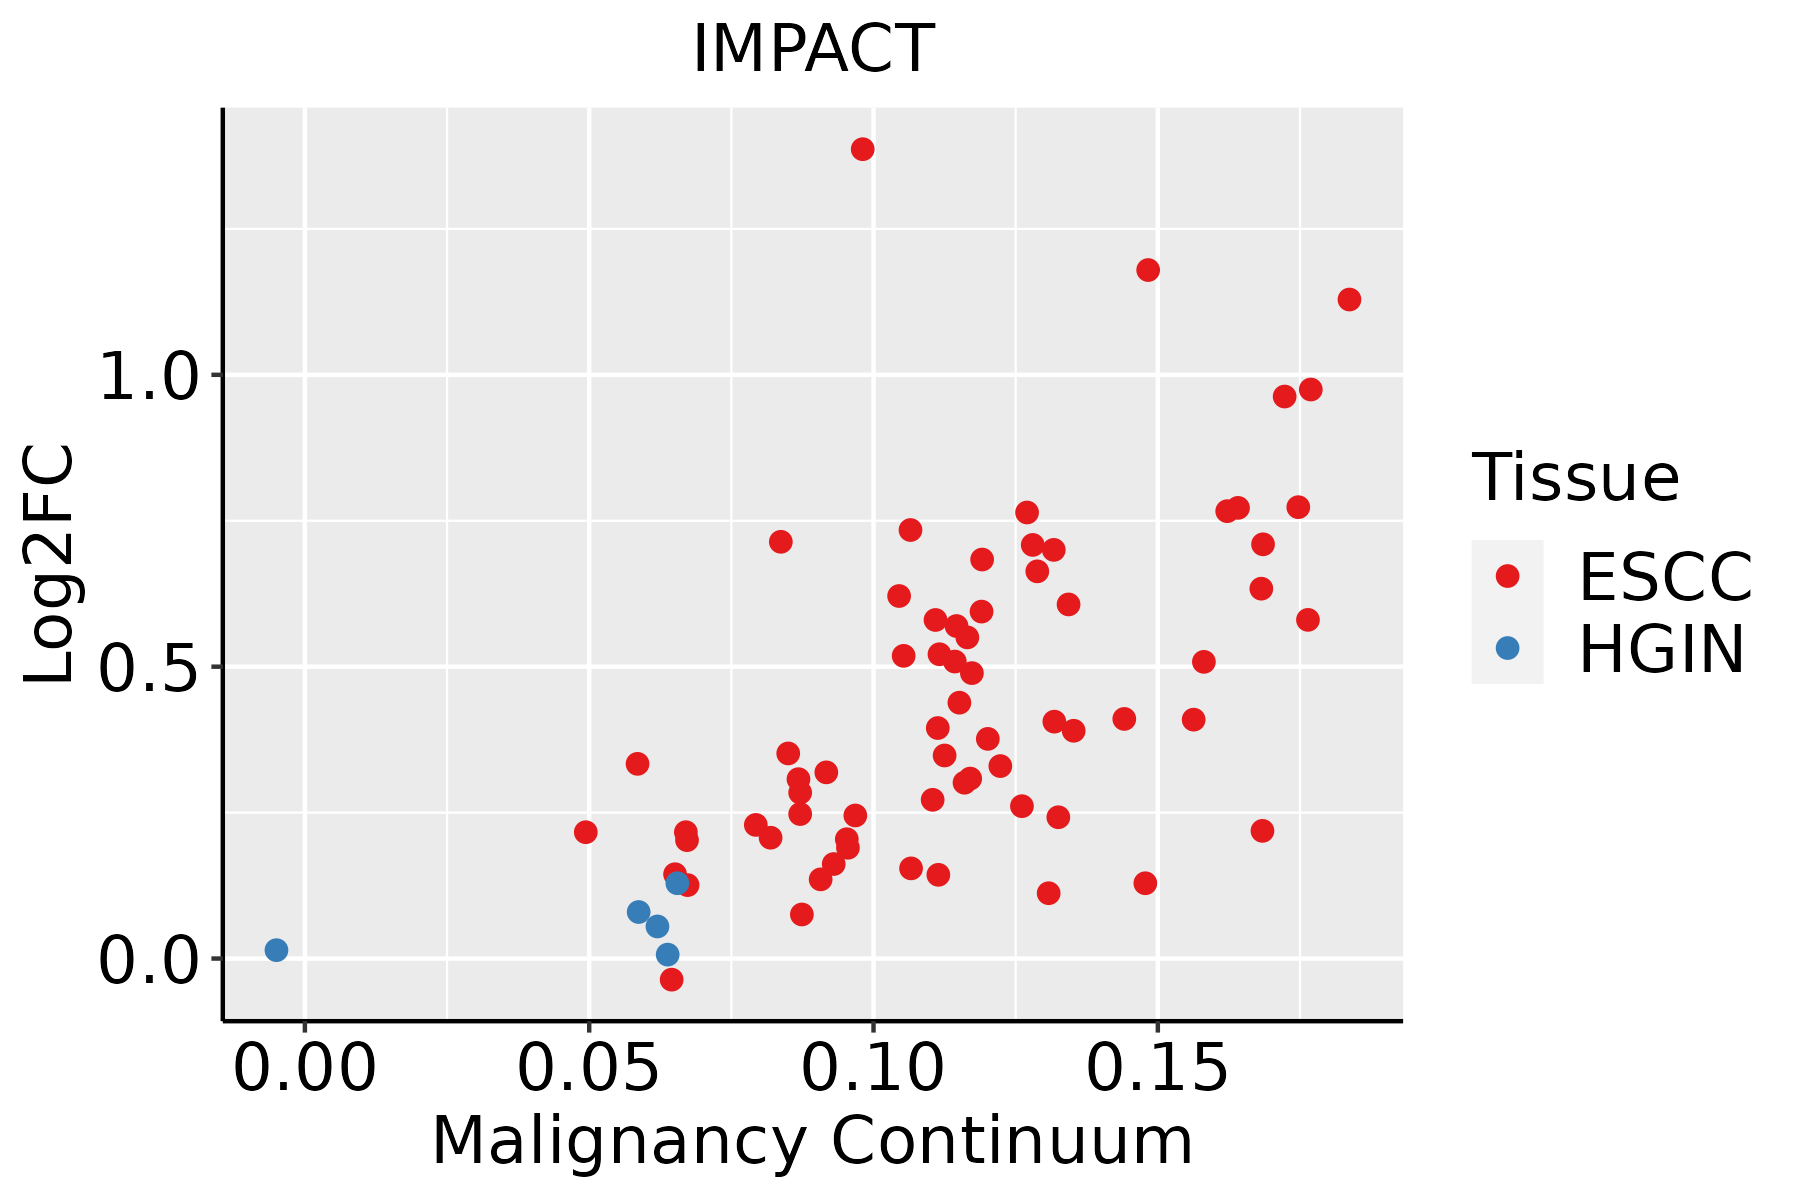 | ESCC: Esophageal squamous cell carcinoma |
| HGIN: High-grade intraepithelial neoplasias | ||
| LGIN: Low-grade intraepithelial neoplasias | ||
| Liver | 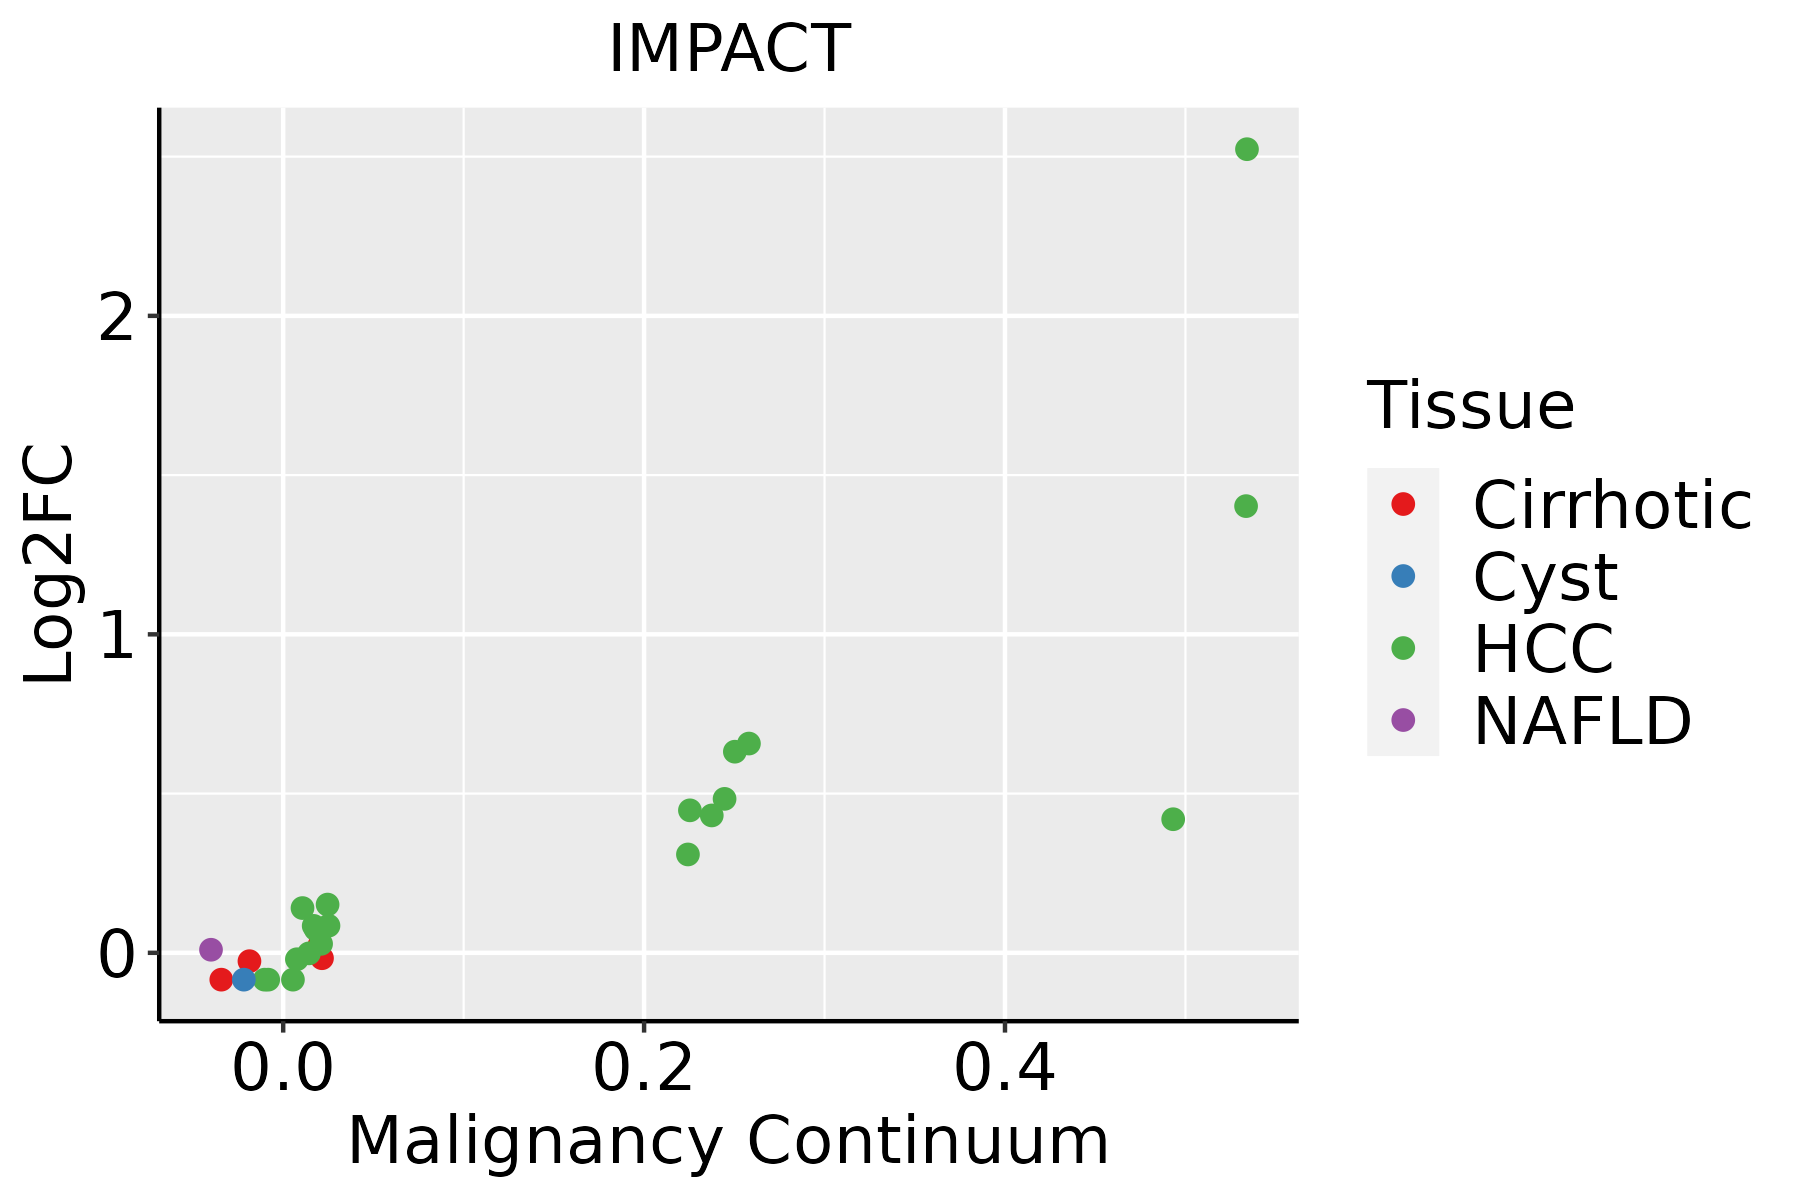 | HCC: Hepatocellular carcinoma |
| NAFLD: Non-alcoholic fatty liver disease | ||
| Oral Cavity | 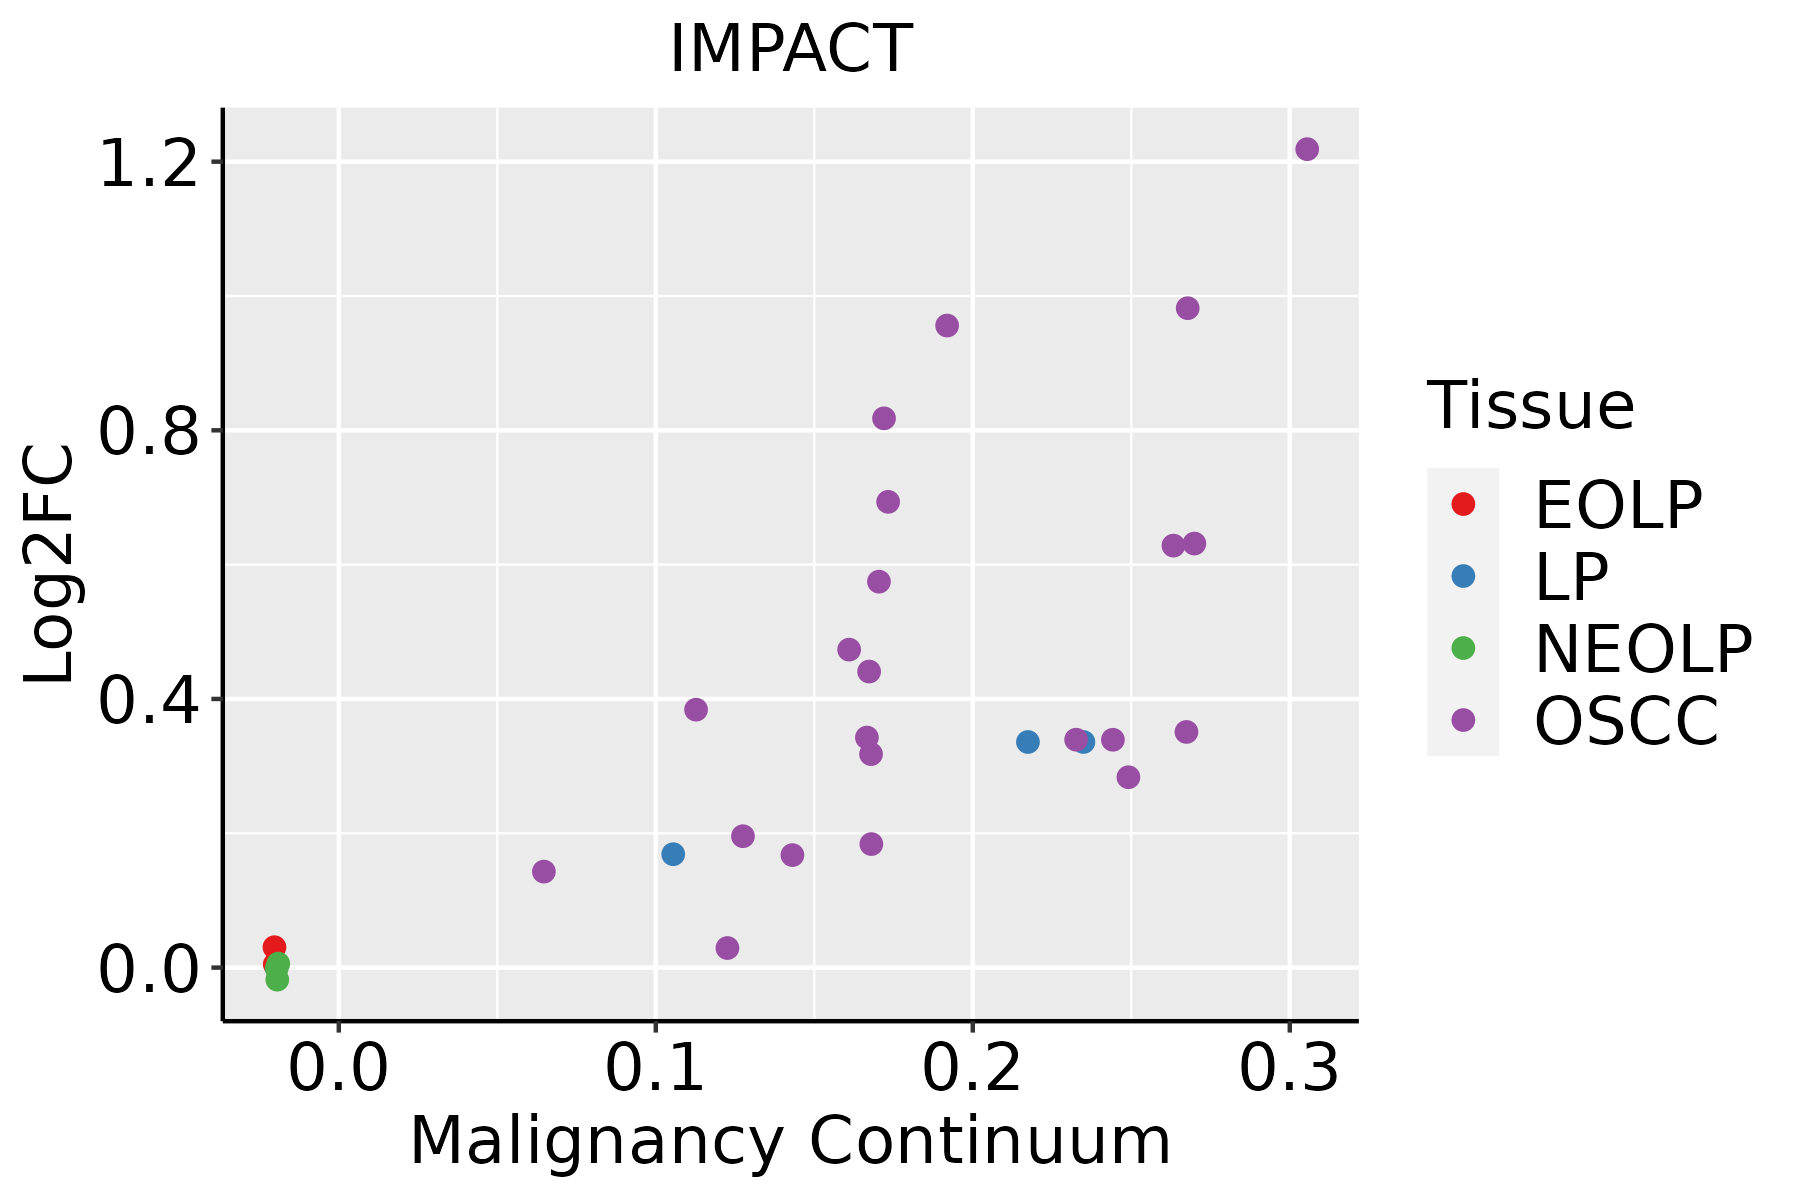 | EOLP: Erosive Oral lichen planus |
| LP: leukoplakia | ||
| NEOLP: Non-erosive oral lichen planus | ||
| OSCC: Oral squamous cell carcinoma | ||
| Skin | 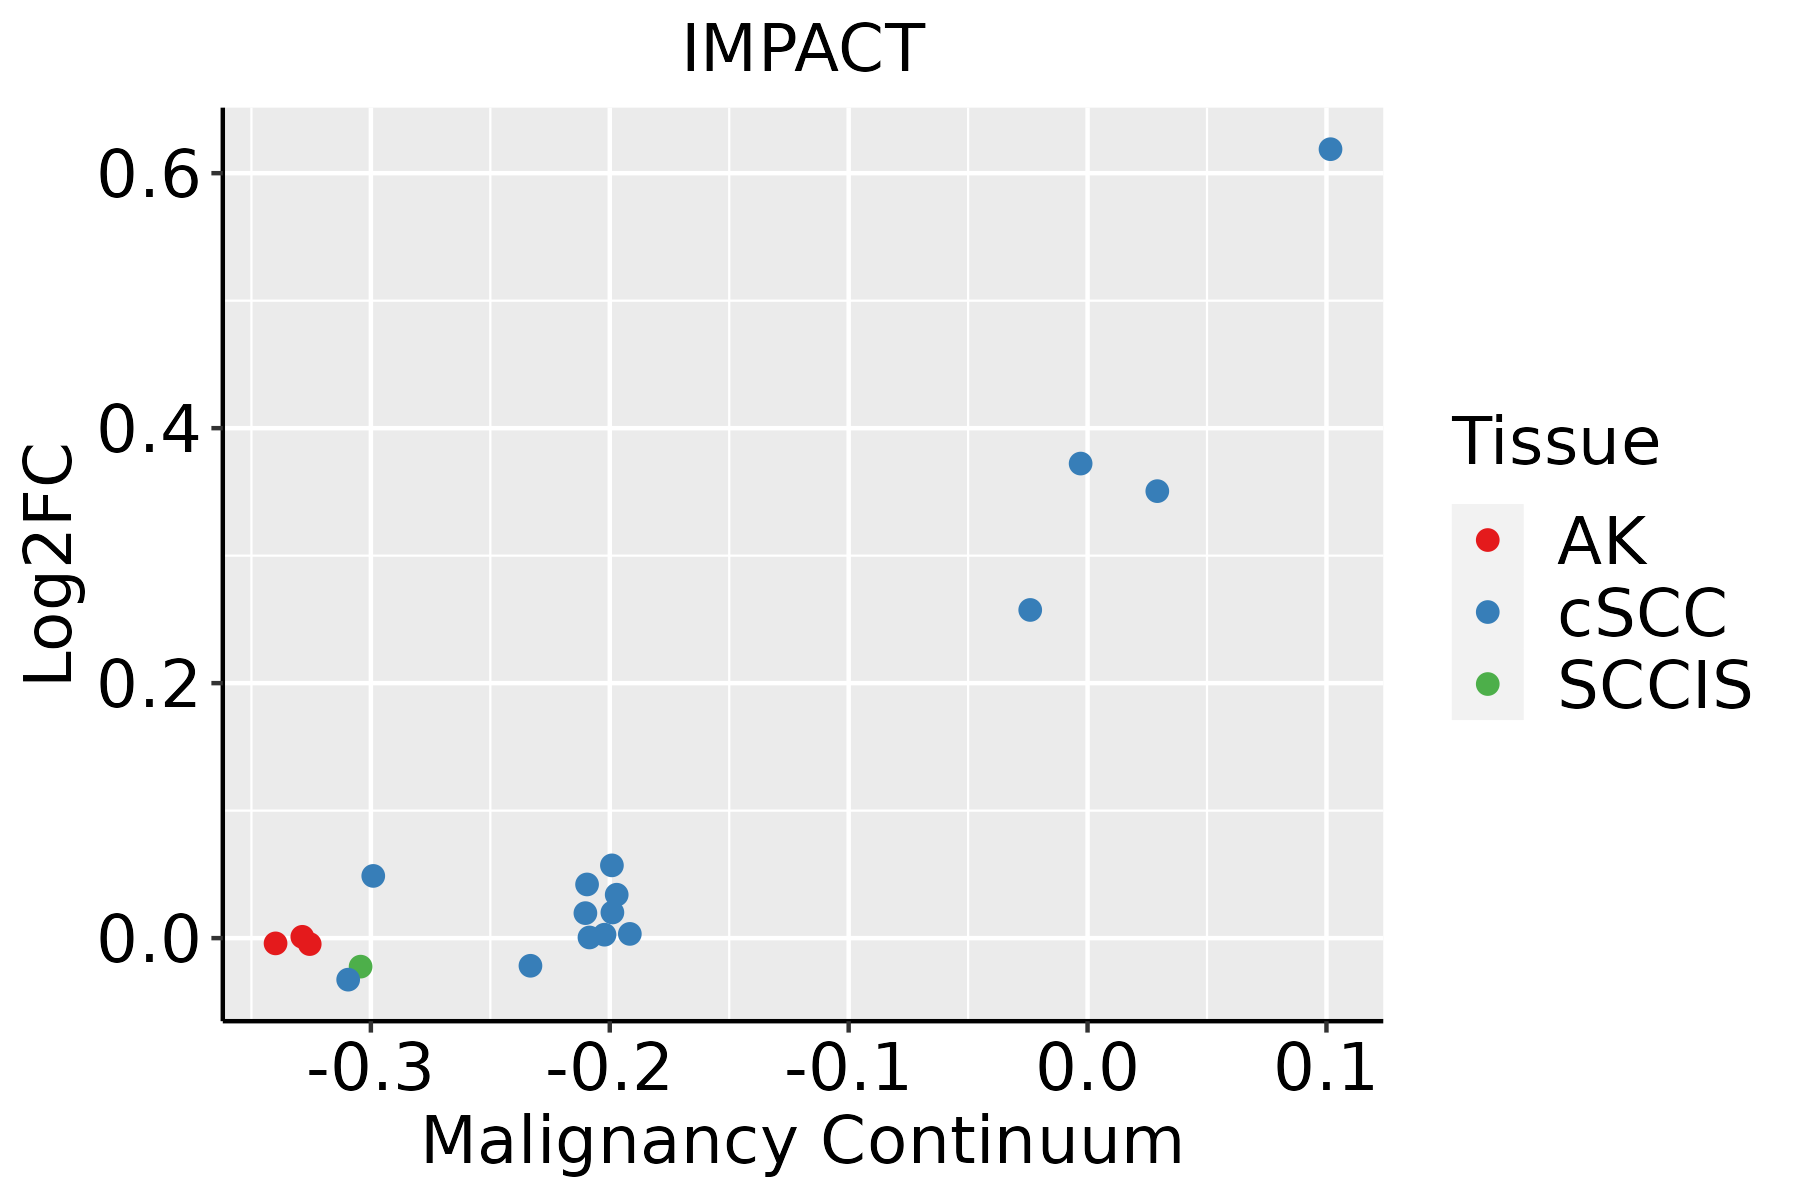 | AK: Actinic keratosis |
| cSCC: Cutaneous squamous cell carcinoma | ||
| SCCIS:squamous cell carcinoma in situ | ||
| Thyroid | 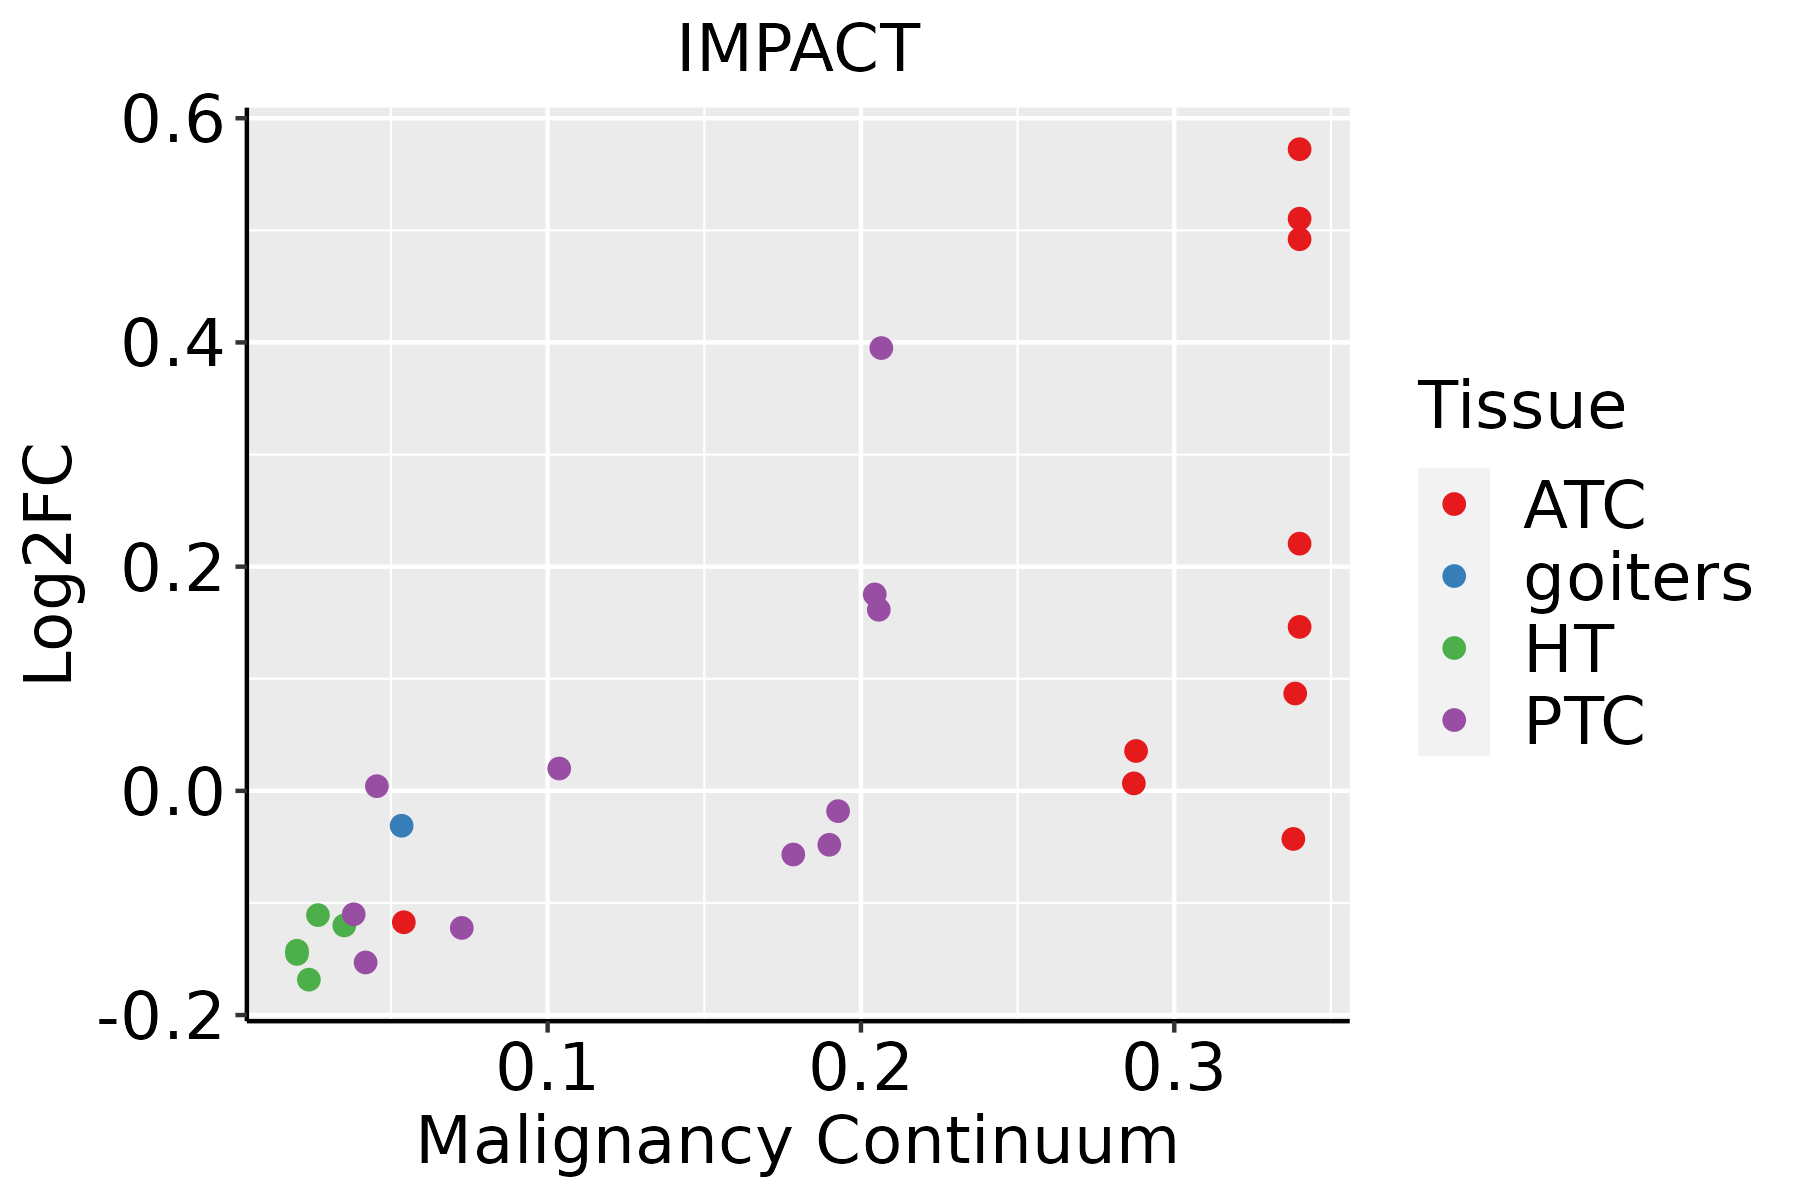 | ATC: Anaplastic thyroid cancer |
| HT: Hashimoto's thyroiditis | ||
| PTC: Papillary thyroid cancer |
| ∗log2FC in expression of this searched gene in stem-like cells from each diseased tissue sample relative to stem-like cells in normal samples in each tissue plotted against the malignancy continuum. Samples are colored based on if they are from different disease stage. |
Top |
Malignant transformation related pathway analysis |
| Find out the enriched GO biological processes and KEGG pathways involved in transition from healthy to precancer to cancer |
| Tissue | Disease Stage | Enriched GO biological Processes |
| Colorectum | AD |  |
| Colorectum | SER |  |
| Colorectum | MSS |  |
| Colorectum | MSI-H |  |
| Colorectum | FAP |  |
| ∗Top 15 enriched GO BP terms are showed in the bar plot of each disease state in each tissue. Each row represents a significant GO biological process which is colored according to the -log10(p.adjust). |
| Page: 1 2 3 4 5 6 7 8 9 |
| GO ID | Tissue | Disease Stage | Description | Gene Ratio | Bg Ratio | pvalue | p.adjust | Count |
| GO:004572733 | Thyroid | ATC | positive regulation of translation | 85/6293 | 136/18723 | 4.71e-12 | 1.84e-10 | 85 |
| GO:003425034 | Thyroid | ATC | positive regulation of cellular amide metabolic process | 97/6293 | 162/18723 | 5.97e-12 | 2.30e-10 | 97 |
| GO:0071496210 | Thyroid | ATC | cellular response to external stimulus | 165/6293 | 320/18723 | 2.01e-11 | 7.23e-10 | 165 |
| GO:007121427 | Thyroid | ATC | cellular response to abiotic stimulus | 169/6293 | 331/18723 | 3.24e-11 | 1.08e-09 | 169 |
| GO:010400427 | Thyroid | ATC | cellular response to environmental stimulus | 169/6293 | 331/18723 | 3.24e-11 | 1.08e-09 | 169 |
| GO:000644632 | Thyroid | ATC | regulation of translational initiation | 55/6293 | 79/18723 | 6.38e-11 | 2.06e-09 | 55 |
| GO:007147825 | Thyroid | ATC | cellular response to radiation | 101/6293 | 186/18723 | 4.67e-09 | 1.04e-07 | 101 |
| GO:003461433 | Thyroid | ATC | cellular response to reactive oxygen species | 87/6293 | 155/18723 | 6.54e-09 | 1.43e-07 | 87 |
| GO:000941115 | Thyroid | ATC | response to UV | 84/6293 | 149/18723 | 8.97e-09 | 1.90e-07 | 84 |
| GO:003166927 | Thyroid | ATC | cellular response to nutrient levels | 112/6293 | 215/18723 | 1.57e-08 | 3.20e-07 | 112 |
| GO:003166827 | Thyroid | ATC | cellular response to extracellular stimulus | 125/6293 | 246/18723 | 1.65e-08 | 3.31e-07 | 125 |
| GO:000931426 | Thyroid | ATC | response to radiation | 210/6293 | 456/18723 | 1.69e-08 | 3.39e-07 | 210 |
| GO:003464415 | Thyroid | ATC | cellular response to UV | 56/6293 | 90/18723 | 2.53e-08 | 4.86e-07 | 56 |
| GO:004259424 | Thyroid | ATC | response to starvation | 103/6293 | 197/18723 | 4.59e-08 | 8.31e-07 | 103 |
| GO:000926724 | Thyroid | ATC | cellular response to starvation | 85/6293 | 156/18723 | 6.14e-08 | 1.09e-06 | 85 |
| GO:004677717 | Thyroid | ATC | protein autophosphorylation | 114/6293 | 227/18723 | 1.54e-07 | 2.49e-06 | 114 |
| GO:007030122 | Thyroid | ATC | cellular response to hydrogen peroxide | 58/6293 | 98/18723 | 1.81e-07 | 2.86e-06 | 58 |
| GO:0031667210 | Thyroid | ATC | response to nutrient levels | 212/6293 | 474/18723 | 2.37e-07 | 3.70e-06 | 212 |
| GO:199013824 | Thyroid | ATC | neuron projection extension | 89/6293 | 172/18723 | 6.63e-07 | 9.13e-06 | 89 |
| GO:004858823 | Thyroid | ATC | developmental cell growth | 114/6293 | 234/18723 | 1.11e-06 | 1.44e-05 | 114 |
| Page: 1 2 3 4 5 6 7 8 9 10 11 12 13 14 15 16 |
| Pathway ID | Tissue | Disease Stage | Description | Gene Ratio | Bg Ratio | pvalue | p.adjust | qvalue | Count |
| Page: 1 |
Top |
Cell-cell communication analysis |
| Identification of potential cell-cell interactions between two cell types and their ligand-receptor pairs for different disease states |
| Ligand | Receptor | LRpair | Pathway | Tissue | Disease Stage |
| Page: 1 |
Top |
Single-cell gene regulatory network inference analysis |
| Find out the significant the regulons (TFs) and the target genes of each regulon across cell types for different disease states |
| TF | Cell Type | Tissue | Disease Stage | Target Gene | RSS | Regulon Activity |
| ∗The dot plots of a searched regulon are shown for all cell subpopulations in each disease state of each tissue based on the regulon specific score inferred using pySCENIC and by calculating the average expression. |
| Page: 1 |
Top |
Somatic mutation of malignant transformation related genes |
| Annotation of somatic variants for genes involved in malignant transformation |
| Hugo Symbol | Variant Class | Variant Classification | dbSNP RS | HGVSc | HGVSp | HGVSp Short | SWISSPROT | BIOTYPE | SIFT | PolyPhen | Tumor Sample Barcode | Tissue | Histology | Sex | Age | Stage | Therapy Types | Drugs | Outcome |
| IMPACT | SNV | Missense_Mutation | c.365N>G | p.Pro122Arg | p.P122R | Q9P2X3 | protein_coding | deleterious(0.03) | benign(0.074) | TCGA-A8-A075-01 | Breast | breast invasive carcinoma | Female | <65 | I/II | Chemotherapy | epirubicin | CR | |
| IMPACT | SNV | Missense_Mutation | c.76N>C | p.Glu26Gln | p.E26Q | Q9P2X3 | protein_coding | deleterious(0.01) | possibly_damaging(0.861) | TCGA-A8-A09G-01 | Breast | breast invasive carcinoma | Female | >=65 | III/IV | Unknown | Unknown | SD | |
| IMPACT | SNV | Missense_Mutation | novel | c.748N>T | p.His250Tyr | p.H250Y | Q9P2X3 | protein_coding | deleterious(0.03) | possibly_damaging(0.585) | TCGA-AC-A3TM-01 | Breast | breast invasive carcinoma | Female | <65 | III/IV | Chemotherapy | cytoxan | CR |
| IMPACT | deletion | Frame_Shift_Del | novel | c.435delN | p.Gln146SerfsTer20 | p.Q146Sfs*20 | Q9P2X3 | protein_coding | TCGA-EW-A2FV-01 | Breast | breast invasive carcinoma | Female | <65 | III/IV | Chemotherapy | docetaxel | SD | ||
| IMPACT | SNV | Missense_Mutation | c.130N>A | p.Asp44Asn | p.D44N | Q9P2X3 | protein_coding | tolerated(0.43) | benign(0.015) | TCGA-2W-A8YY-01 | Cervix | cervical & endocervical cancer | Female | <65 | I/II | Chemotherapy | cisplatin | CR | |
| IMPACT | SNV | Missense_Mutation | c.690N>T | p.Gln230His | p.Q230H | Q9P2X3 | protein_coding | tolerated(0.26) | benign(0.015) | TCGA-AA-3977-01 | Colorectum | colon adenocarcinoma | Male | >=65 | I/II | Unknown | Unknown | SD | |
| IMPACT | SNV | Missense_Mutation | c.171N>A | p.Met57Ile | p.M57I | Q9P2X3 | protein_coding | tolerated(1) | benign(0.003) | TCGA-AA-A00N-01 | Colorectum | colon adenocarcinoma | Male | >=65 | I/II | Unknown | Unknown | PD | |
| IMPACT | SNV | Missense_Mutation | c.941N>G | p.Asp314Gly | p.D314G | Q9P2X3 | protein_coding | deleterious_low_confidence(0.04) | benign(0.001) | TCGA-AA-A00N-01 | Colorectum | colon adenocarcinoma | Male | >=65 | I/II | Unknown | Unknown | PD | |
| IMPACT | SNV | Missense_Mutation | rs777647033 | c.541N>A | p.Asp181Asn | p.D181N | Q9P2X3 | protein_coding | deleterious(0) | probably_damaging(0.997) | TCGA-AZ-4315-01 | Colorectum | colon adenocarcinoma | Male | <65 | I/II | Unknown | Unknown | SD |
| IMPACT | SNV | Missense_Mutation | novel | c.542N>G | p.Asp181Gly | p.D181G | Q9P2X3 | protein_coding | deleterious(0) | probably_damaging(0.998) | TCGA-CA-6717-01 | Colorectum | colon adenocarcinoma | Male | <65 | I/II | Chemotherapy | oxaliplatin | CR |
| Page: 1 2 3 4 |
Top |
Related drugs of malignant transformation related genes |
| Identification of chemicals and drugs interact with genes involved in malignant transfromation |
| (DGIdb 4.0) |
| Entrez ID | Symbol | Category | Interaction Types | Drug Claim Name | Drug Name | PMIDs |
| Page: 1 |

Copyright 2023-Present -The University of Texas Health Science Center at Houston |