
|
|||||
|
 | |
| |
| |
| |
| |
| |
|
Gene: HIPK3 |
Gene summary for HIPK3 |
| Gene information | Species | Human | Gene symbol | HIPK3 | Gene ID | 10114 |
| Gene name | homeodomain interacting protein kinase 3 | |
| Gene Alias | DYRK6 | |
| Cytomap | 11p13 | |
| Gene Type | protein-coding | GO ID | GO:0000165 | UniProtAcc | Q9H422 |
Top |
Malignant transformation analysis |
| Identification of the aberrant gene expression in precancerous and cancerous lesions by comparing the gene expression of stem-like cells in diseased tissues with normal stem cells |
| Entrez ID | Symbol | Replicates | Species | Organ | Tissue | Adj P-value | Log2FC | Malignancy |
| 10114 | HIPK3 | LZE4T | Human | Esophagus | ESCC | 1.69e-04 | 4.00e-02 | 0.0811 |
| 10114 | HIPK3 | LZE5T | Human | Esophagus | ESCC | 1.00e-06 | 8.52e-02 | 0.0514 |
| 10114 | HIPK3 | LZE8T | Human | Esophagus | ESCC | 3.50e-05 | -1.22e-01 | 0.067 |
| 10114 | HIPK3 | LZE20T | Human | Esophagus | ESCC | 4.18e-02 | 4.18e-03 | 0.0662 |
| 10114 | HIPK3 | LZE22T | Human | Esophagus | ESCC | 6.65e-03 | 8.52e-02 | 0.068 |
| 10114 | HIPK3 | LZE24T | Human | Esophagus | ESCC | 6.01e-15 | 3.05e-01 | 0.0596 |
| 10114 | HIPK3 | P2T-E | Human | Esophagus | ESCC | 1.16e-13 | -1.02e-01 | 0.1177 |
| 10114 | HIPK3 | P4T-E | Human | Esophagus | ESCC | 3.48e-05 | -5.50e-02 | 0.1323 |
| 10114 | HIPK3 | P5T-E | Human | Esophagus | ESCC | 1.16e-05 | -1.87e-01 | 0.1327 |
| 10114 | HIPK3 | P8T-E | Human | Esophagus | ESCC | 9.57e-13 | 1.74e-01 | 0.0889 |
| 10114 | HIPK3 | P9T-E | Human | Esophagus | ESCC | 3.23e-09 | 6.67e-03 | 0.1131 |
| 10114 | HIPK3 | P10T-E | Human | Esophagus | ESCC | 4.83e-10 | -4.21e-02 | 0.116 |
| 10114 | HIPK3 | P11T-E | Human | Esophagus | ESCC | 2.98e-07 | 2.37e-01 | 0.1426 |
| 10114 | HIPK3 | P12T-E | Human | Esophagus | ESCC | 3.83e-18 | 2.72e-02 | 0.1122 |
| 10114 | HIPK3 | P15T-E | Human | Esophagus | ESCC | 8.12e-12 | 1.28e-01 | 0.1149 |
| 10114 | HIPK3 | P16T-E | Human | Esophagus | ESCC | 1.30e-08 | -1.43e-01 | 0.1153 |
| 10114 | HIPK3 | P17T-E | Human | Esophagus | ESCC | 9.14e-03 | -8.71e-02 | 0.1278 |
| 10114 | HIPK3 | P19T-E | Human | Esophagus | ESCC | 1.56e-03 | 5.01e-03 | 0.1662 |
| 10114 | HIPK3 | P20T-E | Human | Esophagus | ESCC | 7.22e-11 | -8.12e-02 | 0.1124 |
| 10114 | HIPK3 | P21T-E | Human | Esophagus | ESCC | 1.95e-18 | 3.52e-02 | 0.1617 |
| Page: 1 2 3 4 5 6 7 |
| Tissue | Expression Dynamics | Abbreviation |
| Liver | 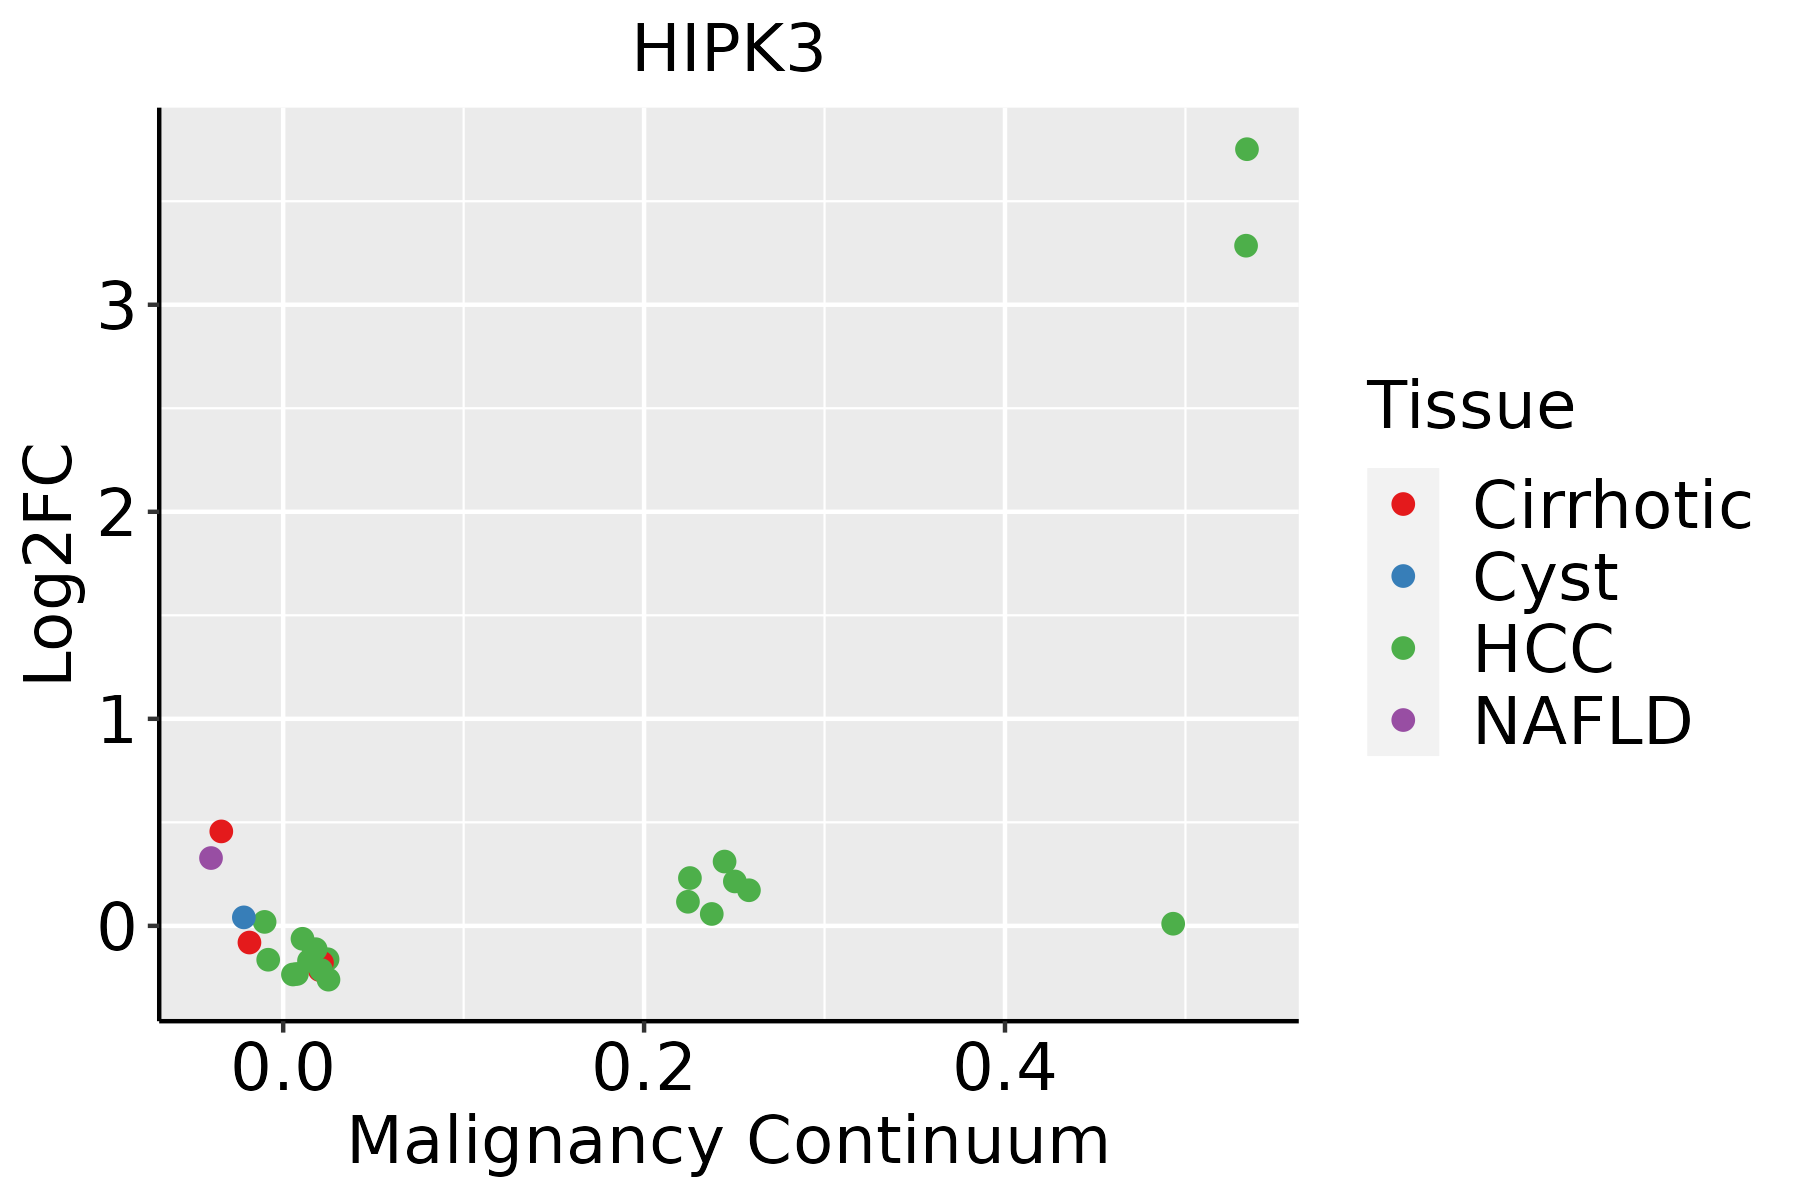 | HCC: Hepatocellular carcinoma |
| NAFLD: Non-alcoholic fatty liver disease | ||
| Lung |  | AAH: Atypical adenomatous hyperplasia |
| AIS: Adenocarcinoma in situ | ||
| IAC: Invasive lung adenocarcinoma | ||
| MIA: Minimally invasive adenocarcinoma | ||
| Oral Cavity |  | EOLP: Erosive Oral lichen planus |
| LP: leukoplakia | ||
| NEOLP: Non-erosive oral lichen planus | ||
| OSCC: Oral squamous cell carcinoma | ||
| Prostate | 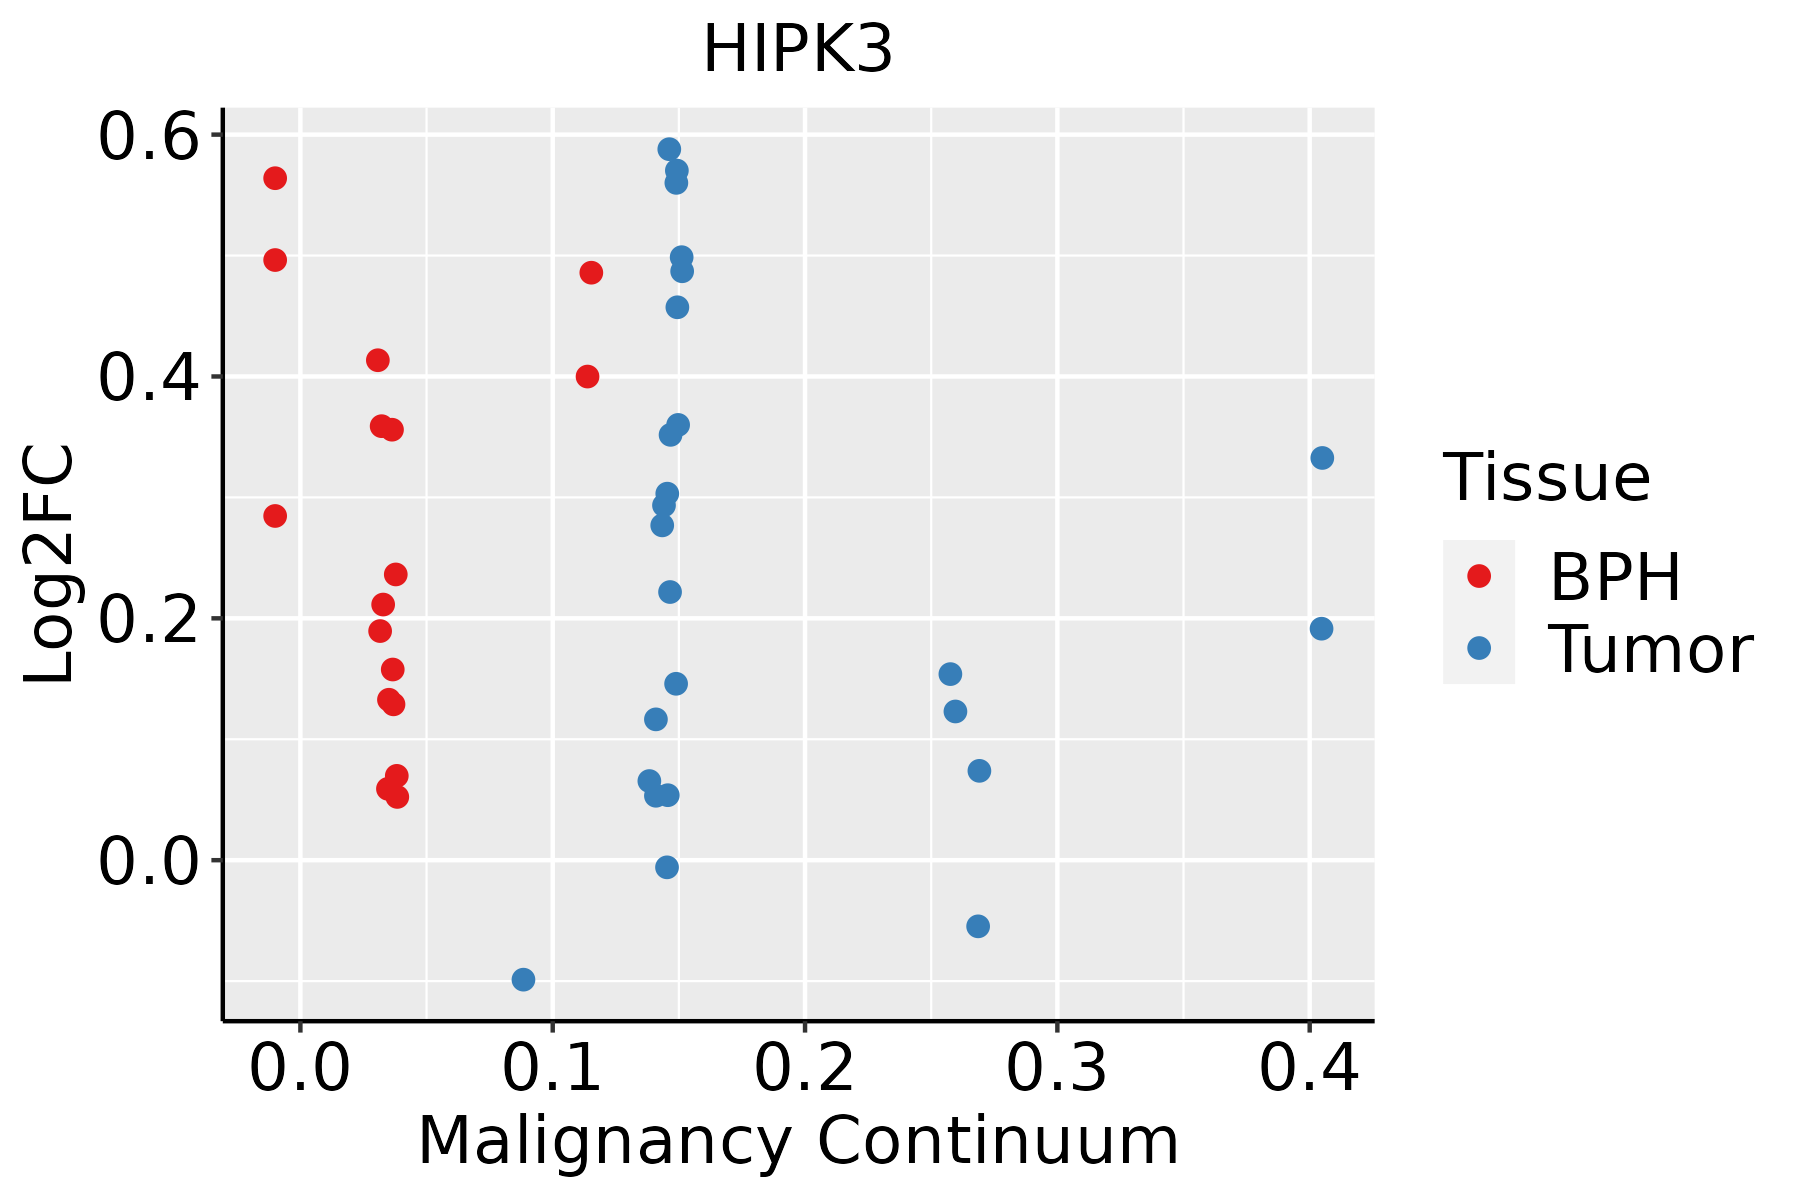 | BPH: Benign Prostatic Hyperplasia |
| Thyroid | 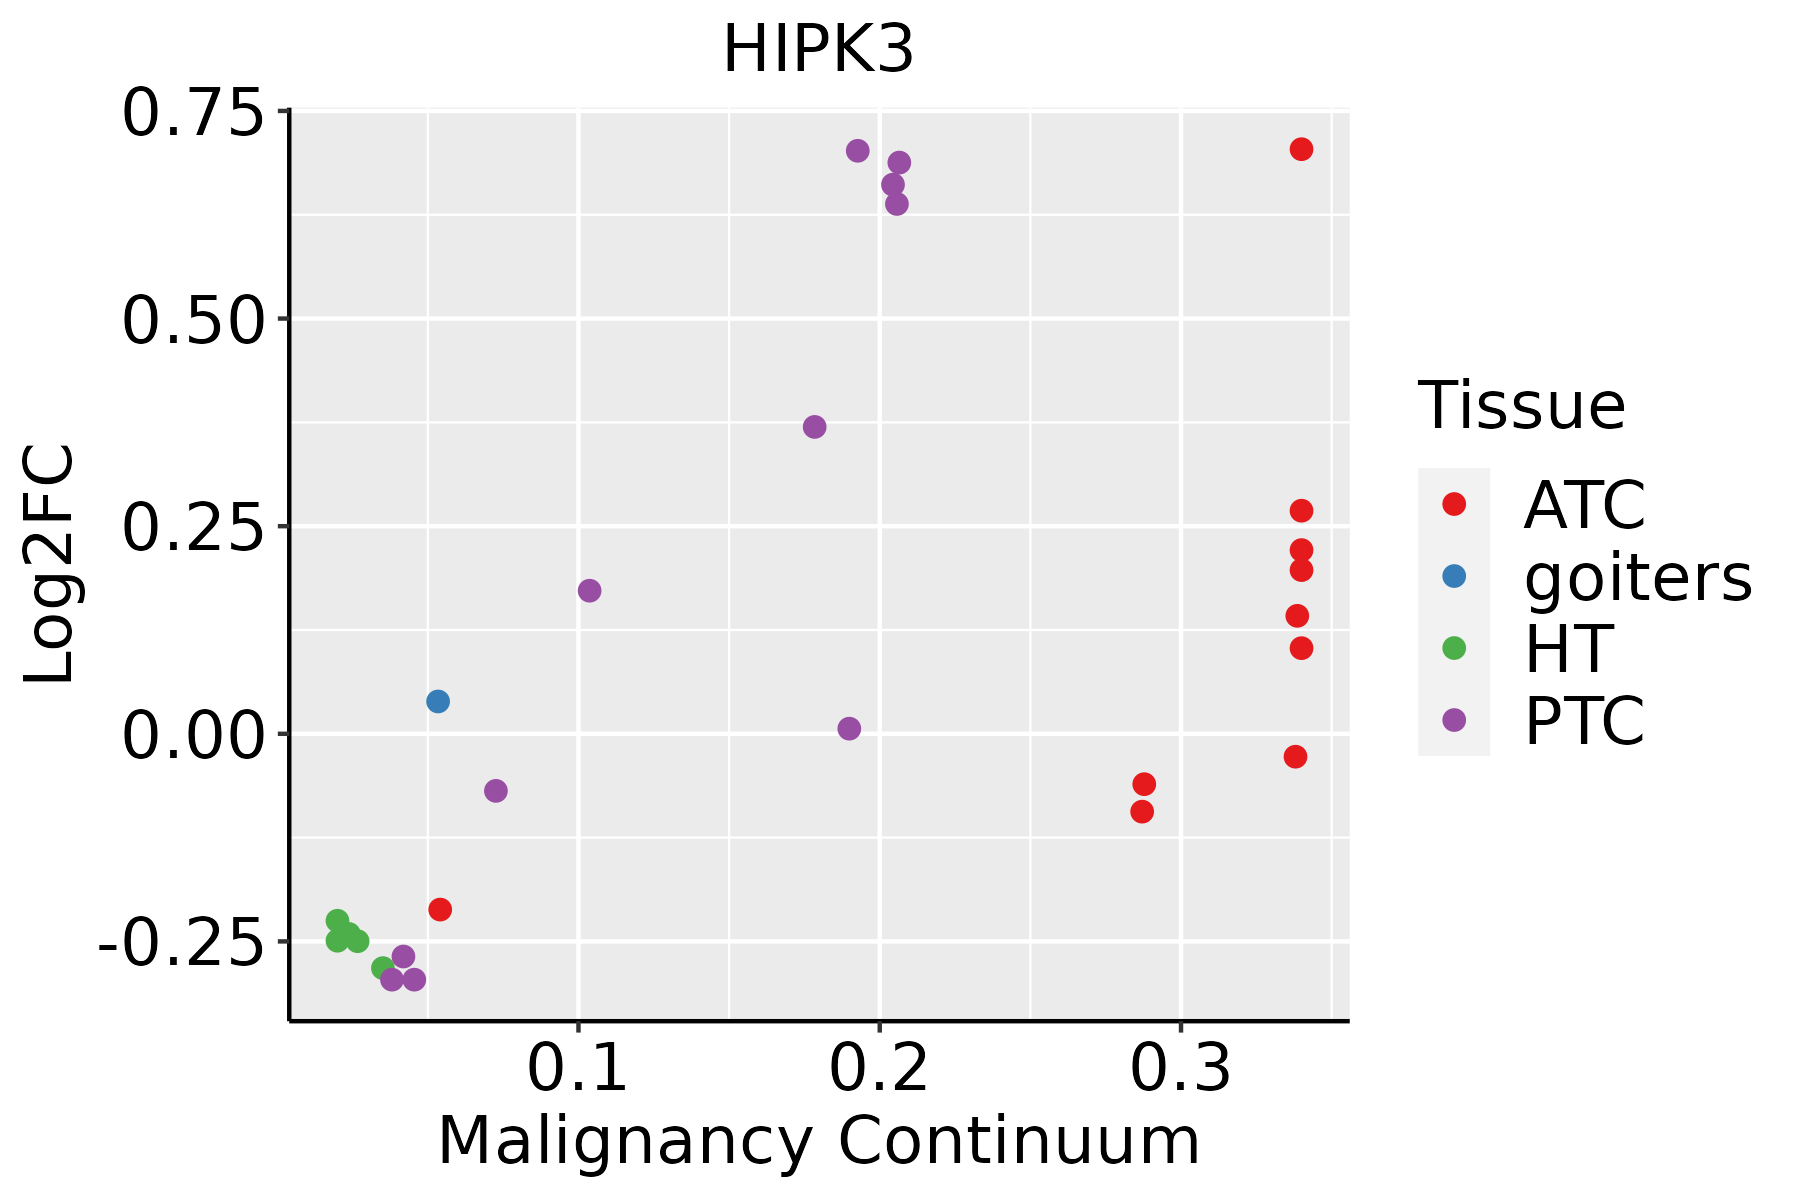 | ATC: Anaplastic thyroid cancer |
| HT: Hashimoto's thyroiditis | ||
| PTC: Papillary thyroid cancer |
| ∗log2FC in expression of this searched gene in stem-like cells from each diseased tissue sample relative to stem-like cells in normal samples in each tissue plotted against the malignancy continuum. Samples are colored based on if they are from different disease stage. |
Top |
Malignant transformation related pathway analysis |
| Find out the enriched GO biological processes and KEGG pathways involved in transition from healthy to precancer to cancer |
| Tissue | Disease Stage | Enriched GO biological Processes |
| Colorectum | AD |  |
| Colorectum | SER |  |
| Colorectum | MSS |  |
| Colorectum | MSI-H |  |
| Colorectum | FAP |  |
| ∗Top 15 enriched GO BP terms are showed in the bar plot of each disease state in each tissue. Each row represents a significant GO biological process which is colored according to the -log10(p.adjust). |
| Page: 1 2 3 4 5 6 7 8 9 |
| GO ID | Tissue | Disease Stage | Description | Gene Ratio | Bg Ratio | pvalue | p.adjust | Count |
| GO:007190025 | Thyroid | ATC | regulation of protein serine/threonine kinase activity | 176/6293 | 359/18723 | 8.35e-10 | 2.17e-08 | 176 |
| GO:000646925 | Thyroid | ATC | negative regulation of protein kinase activity | 114/6293 | 212/18723 | 1.06e-09 | 2.69e-08 | 114 |
| GO:003367325 | Thyroid | ATC | negative regulation of kinase activity | 122/6293 | 237/18723 | 9.19e-09 | 1.94e-07 | 122 |
| GO:001810519 | Thyroid | ATC | peptidyl-serine phosphorylation | 153/6293 | 315/18723 | 2.28e-08 | 4.42e-07 | 153 |
| GO:001820917 | Thyroid | ATC | peptidyl-serine modification | 161/6293 | 338/18723 | 5.23e-08 | 9.44e-07 | 161 |
| GO:003109826 | Thyroid | ATC | stress-activated protein kinase signaling cascade | 120/6293 | 247/18723 | 7.06e-07 | 9.46e-06 | 120 |
| GO:005140326 | Thyroid | ATC | stress-activated MAPK cascade | 115/6293 | 239/18723 | 2.17e-06 | 2.58e-05 | 115 |
| GO:001810718 | Thyroid | ATC | peptidyl-threonine phosphorylation | 63/6293 | 116/18723 | 3.47e-06 | 3.89e-05 | 63 |
| GO:001821018 | Thyroid | ATC | peptidyl-threonine modification | 66/6293 | 125/18723 | 7.36e-06 | 7.56e-05 | 66 |
| GO:004340513 | Thyroid | ATC | regulation of MAP kinase activity | 82/6293 | 177/18723 | 2.87e-04 | 1.83e-03 | 82 |
| GO:007190122 | Thyroid | ATC | negative regulation of protein serine/threonine kinase activity | 59/6293 | 120/18723 | 2.95e-04 | 1.87e-03 | 59 |
| GO:007030226 | Thyroid | ATC | regulation of stress-activated protein kinase signaling cascade | 89/6293 | 195/18723 | 3.05e-04 | 1.93e-03 | 89 |
| GO:003287226 | Thyroid | ATC | regulation of stress-activated MAPK cascade | 87/6293 | 192/18723 | 4.72e-04 | 2.77e-03 | 87 |
| GO:004340926 | Thyroid | ATC | negative regulation of MAPK cascade | 82/6293 | 180/18723 | 5.51e-04 | 3.19e-03 | 82 |
| GO:001821211 | Thyroid | ATC | peptidyl-tyrosine modification | 156/6293 | 378/18723 | 1.01e-03 | 5.36e-03 | 156 |
| GO:000725424 | Thyroid | ATC | JNK cascade | 75/6293 | 167/18723 | 1.51e-03 | 7.68e-03 | 75 |
| GO:00181086 | Thyroid | ATC | peptidyl-tyrosine phosphorylation | 153/6293 | 375/18723 | 1.96e-03 | 9.48e-03 | 153 |
| GO:0032873110 | Thyroid | ATC | negative regulation of stress-activated MAPK cascade | 27/6293 | 51/18723 | 3.41e-03 | 1.52e-02 | 27 |
| GO:0070303110 | Thyroid | ATC | negative regulation of stress-activated protein kinase signaling cascade | 27/6293 | 51/18723 | 3.41e-03 | 1.52e-02 | 27 |
| GO:000929912 | Thyroid | ATC | mRNA transcription | 11/6293 | 16/18723 | 4.33e-03 | 1.80e-02 | 11 |
| Page: 1 2 3 4 5 6 7 8 9 10 11 12 13 14 15 |
| Pathway ID | Tissue | Disease Stage | Description | Gene Ratio | Bg Ratio | pvalue | p.adjust | qvalue | Count |
| hsa0421822 | Liver | HCC | Cellular senescence | 102/4020 | 156/8465 | 4.18e-06 | 3.59e-05 | 2.00e-05 | 102 |
| hsa0421832 | Liver | HCC | Cellular senescence | 102/4020 | 156/8465 | 4.18e-06 | 3.59e-05 | 2.00e-05 | 102 |
| hsa042188 | Lung | IAC | Cellular senescence | 40/1053 | 156/8465 | 4.44e-06 | 1.44e-04 | 9.59e-05 | 40 |
| hsa0421813 | Lung | IAC | Cellular senescence | 40/1053 | 156/8465 | 4.44e-06 | 1.44e-04 | 9.59e-05 | 40 |
| hsa0421823 | Lung | AIS | Cellular senescence | 35/961 | 156/8465 | 5.09e-05 | 7.85e-04 | 5.03e-04 | 35 |
| hsa0421833 | Lung | AIS | Cellular senescence | 35/961 | 156/8465 | 5.09e-05 | 7.85e-04 | 5.03e-04 | 35 |
| hsa0421843 | Lung | MIAC | Cellular senescence | 22/507 | 156/8465 | 1.43e-04 | 3.46e-03 | 2.50e-03 | 22 |
| hsa0421853 | Lung | MIAC | Cellular senescence | 22/507 | 156/8465 | 1.43e-04 | 3.46e-03 | 2.50e-03 | 22 |
| hsa0421820 | Oral cavity | OSCC | Cellular senescence | 112/3704 | 156/8465 | 8.04e-13 | 1.42e-11 | 7.21e-12 | 112 |
| hsa04218110 | Oral cavity | OSCC | Cellular senescence | 112/3704 | 156/8465 | 8.04e-13 | 1.42e-11 | 7.21e-12 | 112 |
| hsa0421845 | Oral cavity | EOLP | Cellular senescence | 50/1218 | 156/8465 | 1.27e-08 | 1.83e-07 | 1.08e-07 | 50 |
| hsa0421855 | Oral cavity | EOLP | Cellular senescence | 50/1218 | 156/8465 | 1.27e-08 | 1.83e-07 | 1.08e-07 | 50 |
| hsa0421861 | Oral cavity | NEOLP | Cellular senescence | 43/1112 | 156/8465 | 1.05e-06 | 1.19e-05 | 7.49e-06 | 43 |
| hsa0421871 | Oral cavity | NEOLP | Cellular senescence | 43/1112 | 156/8465 | 1.05e-06 | 1.19e-05 | 7.49e-06 | 43 |
| hsa0421818 | Prostate | BPH | Cellular senescence | 60/1718 | 156/8465 | 1.07e-07 | 1.18e-06 | 7.32e-07 | 60 |
| hsa0421819 | Prostate | BPH | Cellular senescence | 60/1718 | 156/8465 | 1.07e-07 | 1.18e-06 | 7.32e-07 | 60 |
| hsa0421826 | Prostate | Tumor | Cellular senescence | 61/1791 | 156/8465 | 2.00e-07 | 2.14e-06 | 1.33e-06 | 61 |
| hsa0421836 | Prostate | Tumor | Cellular senescence | 61/1791 | 156/8465 | 2.00e-07 | 2.14e-06 | 1.33e-06 | 61 |
| Page: 1 |
Top |
Cell-cell communication analysis |
| Identification of potential cell-cell interactions between two cell types and their ligand-receptor pairs for different disease states |
| Ligand | Receptor | LRpair | Pathway | Tissue | Disease Stage |
| Page: 1 |
Top |
Single-cell gene regulatory network inference analysis |
| Find out the significant the regulons (TFs) and the target genes of each regulon across cell types for different disease states |
| TF | Cell Type | Tissue | Disease Stage | Target Gene | RSS | Regulon Activity |
| ∗The dot plots of a searched regulon are shown for all cell subpopulations in each disease state of each tissue based on the regulon specific score inferred using pySCENIC and by calculating the average expression. |
| Page: 1 |
Top |
Somatic mutation of malignant transformation related genes |
| Annotation of somatic variants for genes involved in malignant transformation |
| Hugo Symbol | Variant Class | Variant Classification | dbSNP RS | HGVSc | HGVSp | HGVSp Short | SWISSPROT | BIOTYPE | SIFT | PolyPhen | Tumor Sample Barcode | Tissue | Histology | Sex | Age | Stage | Therapy Types | Drugs | Outcome |
| HIPK3 | SNV | Missense_Mutation | novel | c.2372N>T | p.Ser791Ile | p.S791I | Q9H422 | protein_coding | tolerated(0.07) | benign(0.01) | TCGA-AN-A046-01 | Breast | breast invasive carcinoma | Female | >=65 | I/II | Unknown | Unknown | SD |
| HIPK3 | SNV | Missense_Mutation | rs547809 | c.2219N>T | p.Ser740Phe | p.S740F | Q9H422 | protein_coding | deleterious(0.01) | probably_damaging(0.957) | TCGA-BH-A0B6-01 | Breast | breast invasive carcinoma | Female | <65 | I/II | Unknown | Unknown | SD |
| HIPK3 | SNV | Missense_Mutation | rs779519463 | c.2740N>G | p.Pro914Ala | p.P914A | Q9H422 | protein_coding | tolerated(0.07) | benign(0.376) | TCGA-BH-A18V-01 | Breast | breast invasive carcinoma | Female | <65 | I/II | Unknown | Unknown | SD |
| HIPK3 | SNV | Missense_Mutation | c.601G>A | p.Asp201Asn | p.D201N | Q9H422 | protein_coding | deleterious(0) | benign(0.213) | TCGA-D8-A1J8-01 | Breast | breast invasive carcinoma | Female | >=65 | I/II | Hormone Therapy | nolvadex | SD | |
| HIPK3 | SNV | Missense_Mutation | rs374207916 | c.2017C>G | p.Gln673Glu | p.Q673E | Q9H422 | protein_coding | deleterious(0) | benign(0.05) | TCGA-D8-A1XZ-01 | Breast | breast invasive carcinoma | Female | >=65 | III/IV | Hormone Therapy | tamoxiphen+anastrozolum | SD |
| HIPK3 | SNV | Missense_Mutation | rs748963286 | c.2131N>T | p.Leu711Phe | p.L711F | Q9H422 | protein_coding | deleterious(0.02) | probably_damaging(0.944) | TCGA-UU-A93S-01 | Breast | breast invasive carcinoma | Female | <65 | III/IV | Unknown | Unknown | PD |
| HIPK3 | insertion | Frame_Shift_Ins | novel | c.3633_3634insAAGAACCTTCACCTGCTAGGTTGTCAGCATAC | p.Tyr1212LysfsTer25 | p.Y1212Kfs*25 | Q9H422 | protein_coding | TCGA-A8-A09A-01 | Breast | breast invasive carcinoma | Female | <65 | I/II | Hormone Therapy | tamoxiphen | SD | ||
| HIPK3 | insertion | In_Frame_Ins | novel | c.2213_2214insAATTATAAACATTAAAGTCCA | p.Thr738_Leu739insIleIleAsnIleLysValHis | p.T738_L739insIINIKVH | Q9H422 | protein_coding | TCGA-AR-A0U0-01 | Breast | breast invasive carcinoma | Female | >=65 | I/II | Unknown | Unknown | SD | ||
| HIPK3 | deletion | Frame_Shift_Del | novel | c.2259delN | p.Trp754GlyfsTer20 | p.W754Gfs*20 | Q9H422 | protein_coding | TCGA-D8-A27V-01 | Breast | breast invasive carcinoma | Female | <65 | I/II | Hormone Therapy | tamoxiphen | SD | ||
| HIPK3 | SNV | Missense_Mutation | novel | c.1097N>T | p.Arg366Ile | p.R366I | Q9H422 | protein_coding | deleterious(0) | probably_damaging(1) | TCGA-2W-A8YY-01 | Cervix | cervical & endocervical cancer | Female | <65 | I/II | Chemotherapy | cisplatin | CR |
| Page: 1 2 3 4 5 6 7 8 9 10 11 12 |
Top |
Related drugs of malignant transformation related genes |
| Identification of chemicals and drugs interact with genes involved in malignant transfromation |
| (DGIdb 4.0) |
| Entrez ID | Symbol | Category | Interaction Types | Drug Claim Name | Drug Name | PMIDs |
| 10114 | HIPK3 | SERINE THREONINE KINASE, TYROSINE KINASE, ENZYME, TRANSCRIPTION FACTOR, KINASE, DRUGGABLE GENOME | inhibitor | 249565806 | SILMITASERTIB |
| Page: 1 |

Copyright 2023-Present -The University of Texas Health Science Center at Houston |