
|
|||||
|
 | |
| |
| |
| |
| |
| |
|
Gene: GTF2H5 |
Gene summary for GTF2H5 |
| Gene information | Species | Human | Gene symbol | GTF2H5 | Gene ID | 404672 |
| Gene name | general transcription factor IIH subunit 5 | |
| Gene Alias | C6orf175 | |
| Cytomap | 6q25.3 | |
| Gene Type | protein-coding | GO ID | GO:0000462 | UniProtAcc | Q6ZYL4 |
Top |
Malignant transformation analysis |
| Identification of the aberrant gene expression in precancerous and cancerous lesions by comparing the gene expression of stem-like cells in diseased tissues with normal stem cells |
| Entrez ID | Symbol | Replicates | Species | Organ | Tissue | Adj P-value | Log2FC | Malignancy |
| 404672 | GTF2H5 | GSM4909281 | Human | Breast | IDC | 1.22e-11 | 3.95e-01 | 0.21 |
| 404672 | GTF2H5 | GSM4909285 | Human | Breast | IDC | 5.31e-08 | 2.30e-01 | 0.21 |
| 404672 | GTF2H5 | GSM4909286 | Human | Breast | IDC | 1.95e-07 | 2.96e-01 | 0.1081 |
| 404672 | GTF2H5 | GSM4909288 | Human | Breast | IDC | 9.96e-03 | 2.07e-01 | 0.0988 |
| 404672 | GTF2H5 | GSM4909290 | Human | Breast | IDC | 7.70e-18 | 5.98e-01 | 0.2096 |
| 404672 | GTF2H5 | GSM4909291 | Human | Breast | IDC | 1.99e-03 | 3.21e-01 | 0.1753 |
| 404672 | GTF2H5 | GSM4909293 | Human | Breast | IDC | 9.76e-25 | 5.23e-01 | 0.1581 |
| 404672 | GTF2H5 | GSM4909294 | Human | Breast | IDC | 1.27e-30 | 7.44e-01 | 0.2022 |
| 404672 | GTF2H5 | GSM4909296 | Human | Breast | IDC | 5.56e-06 | -8.60e-02 | 0.1524 |
| 404672 | GTF2H5 | GSM4909297 | Human | Breast | IDC | 1.42e-07 | -5.91e-02 | 0.1517 |
| 404672 | GTF2H5 | GSM4909298 | Human | Breast | IDC | 8.64e-11 | 3.93e-01 | 0.1551 |
| 404672 | GTF2H5 | GSM4909299 | Human | Breast | IDC | 6.69e-03 | 2.33e-01 | 0.035 |
| 404672 | GTF2H5 | GSM4909301 | Human | Breast | IDC | 2.70e-09 | 4.29e-01 | 0.1577 |
| 404672 | GTF2H5 | GSM4909306 | Human | Breast | IDC | 3.73e-31 | 6.23e-01 | 0.1564 |
| 404672 | GTF2H5 | GSM4909307 | Human | Breast | IDC | 5.50e-12 | 4.04e-01 | 0.1569 |
| 404672 | GTF2H5 | GSM4909308 | Human | Breast | IDC | 1.08e-25 | 5.91e-01 | 0.158 |
| 404672 | GTF2H5 | GSM4909311 | Human | Breast | IDC | 2.96e-17 | -1.65e-01 | 0.1534 |
| 404672 | GTF2H5 | GSM4909312 | Human | Breast | IDC | 1.56e-04 | -6.81e-02 | 0.1552 |
| 404672 | GTF2H5 | GSM4909315 | Human | Breast | IDC | 2.26e-47 | 9.37e-01 | 0.21 |
| 404672 | GTF2H5 | GSM4909316 | Human | Breast | IDC | 2.08e-20 | 8.26e-01 | 0.21 |
| Page: 1 2 3 4 5 6 7 8 9 10 |
| Tissue | Expression Dynamics | Abbreviation |
| Breast | 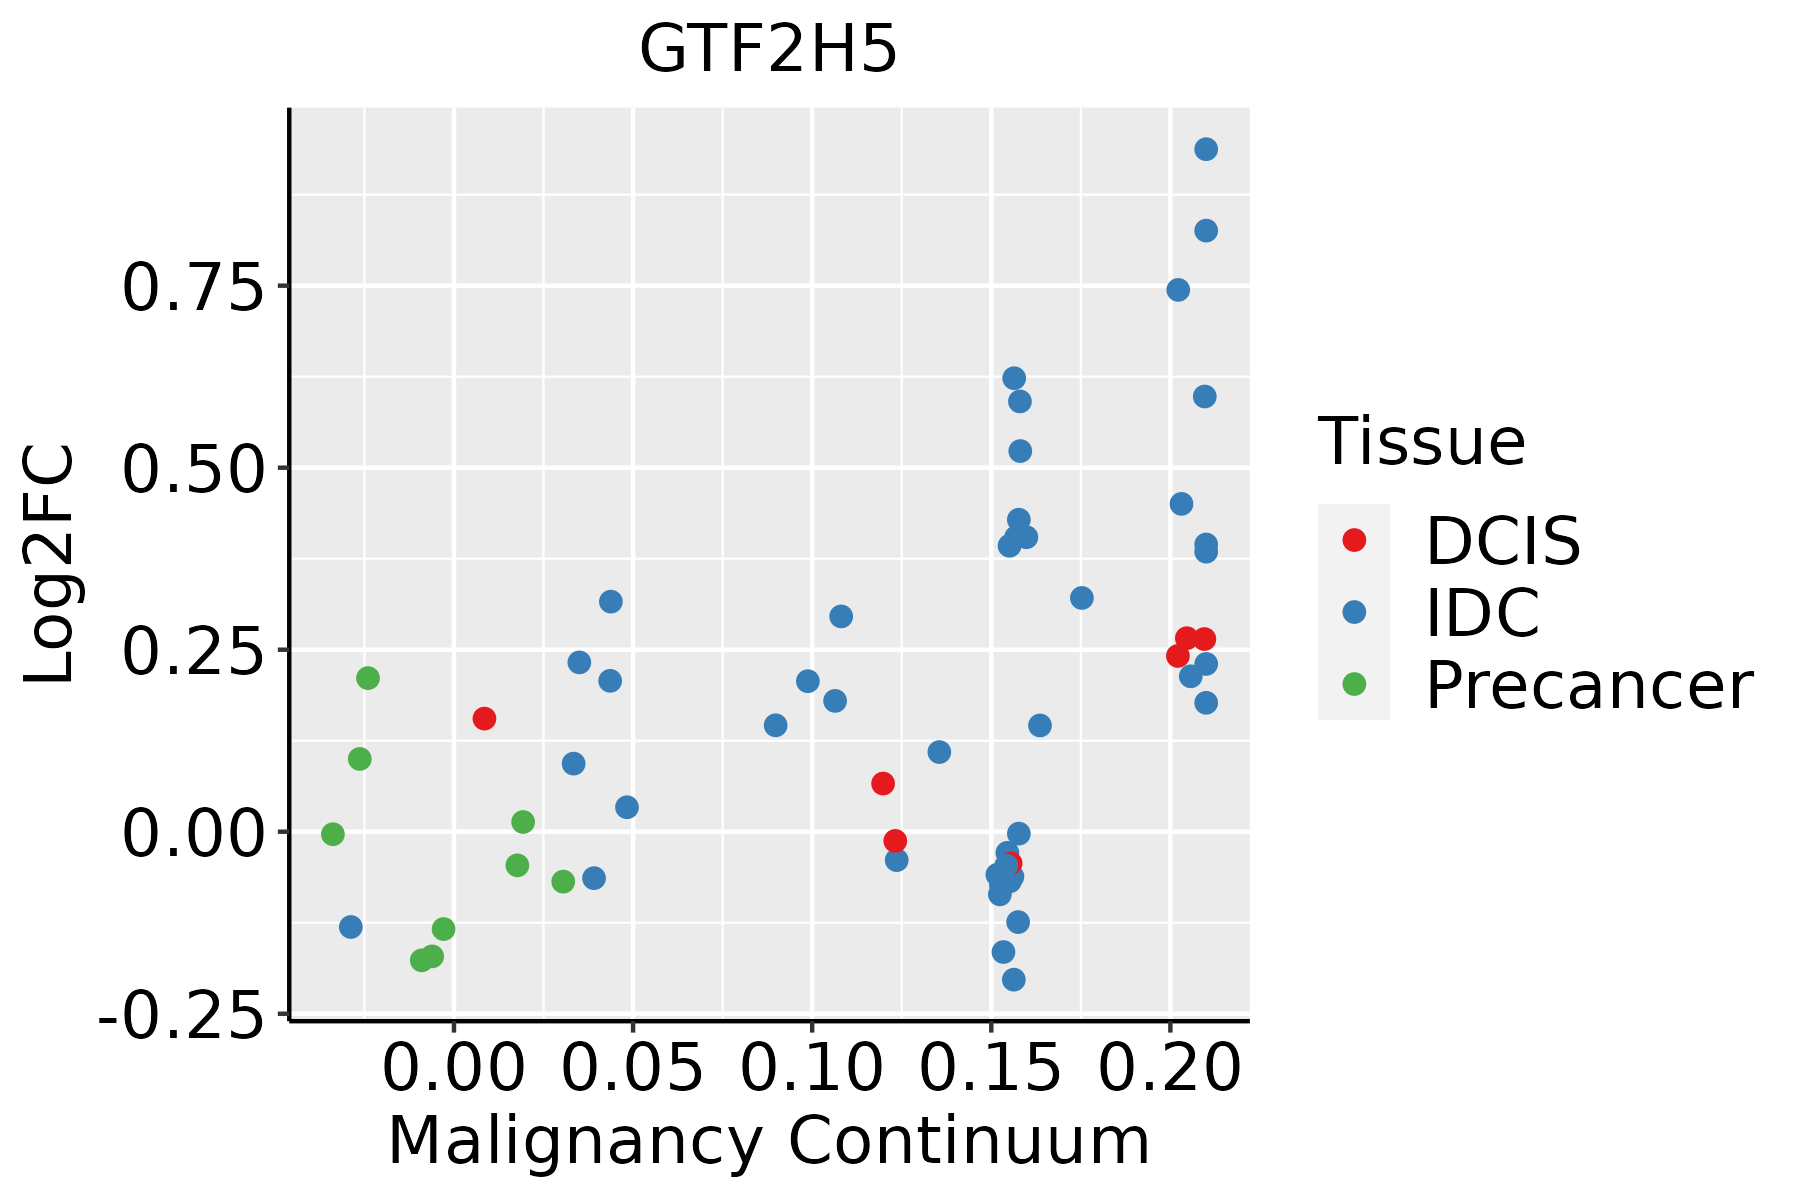 | IDC: Invasive ductal carcinoma |
| DCIS: Ductal carcinoma in situ | ||
| Precancer(BRCA1-mut): Precancerous lesion from BRCA1 mutation carriers | ||
| Endometrium |  | AEH: Atypical endometrial hyperplasia |
| EEC: Endometrioid Cancer | ||
| Esophagus | 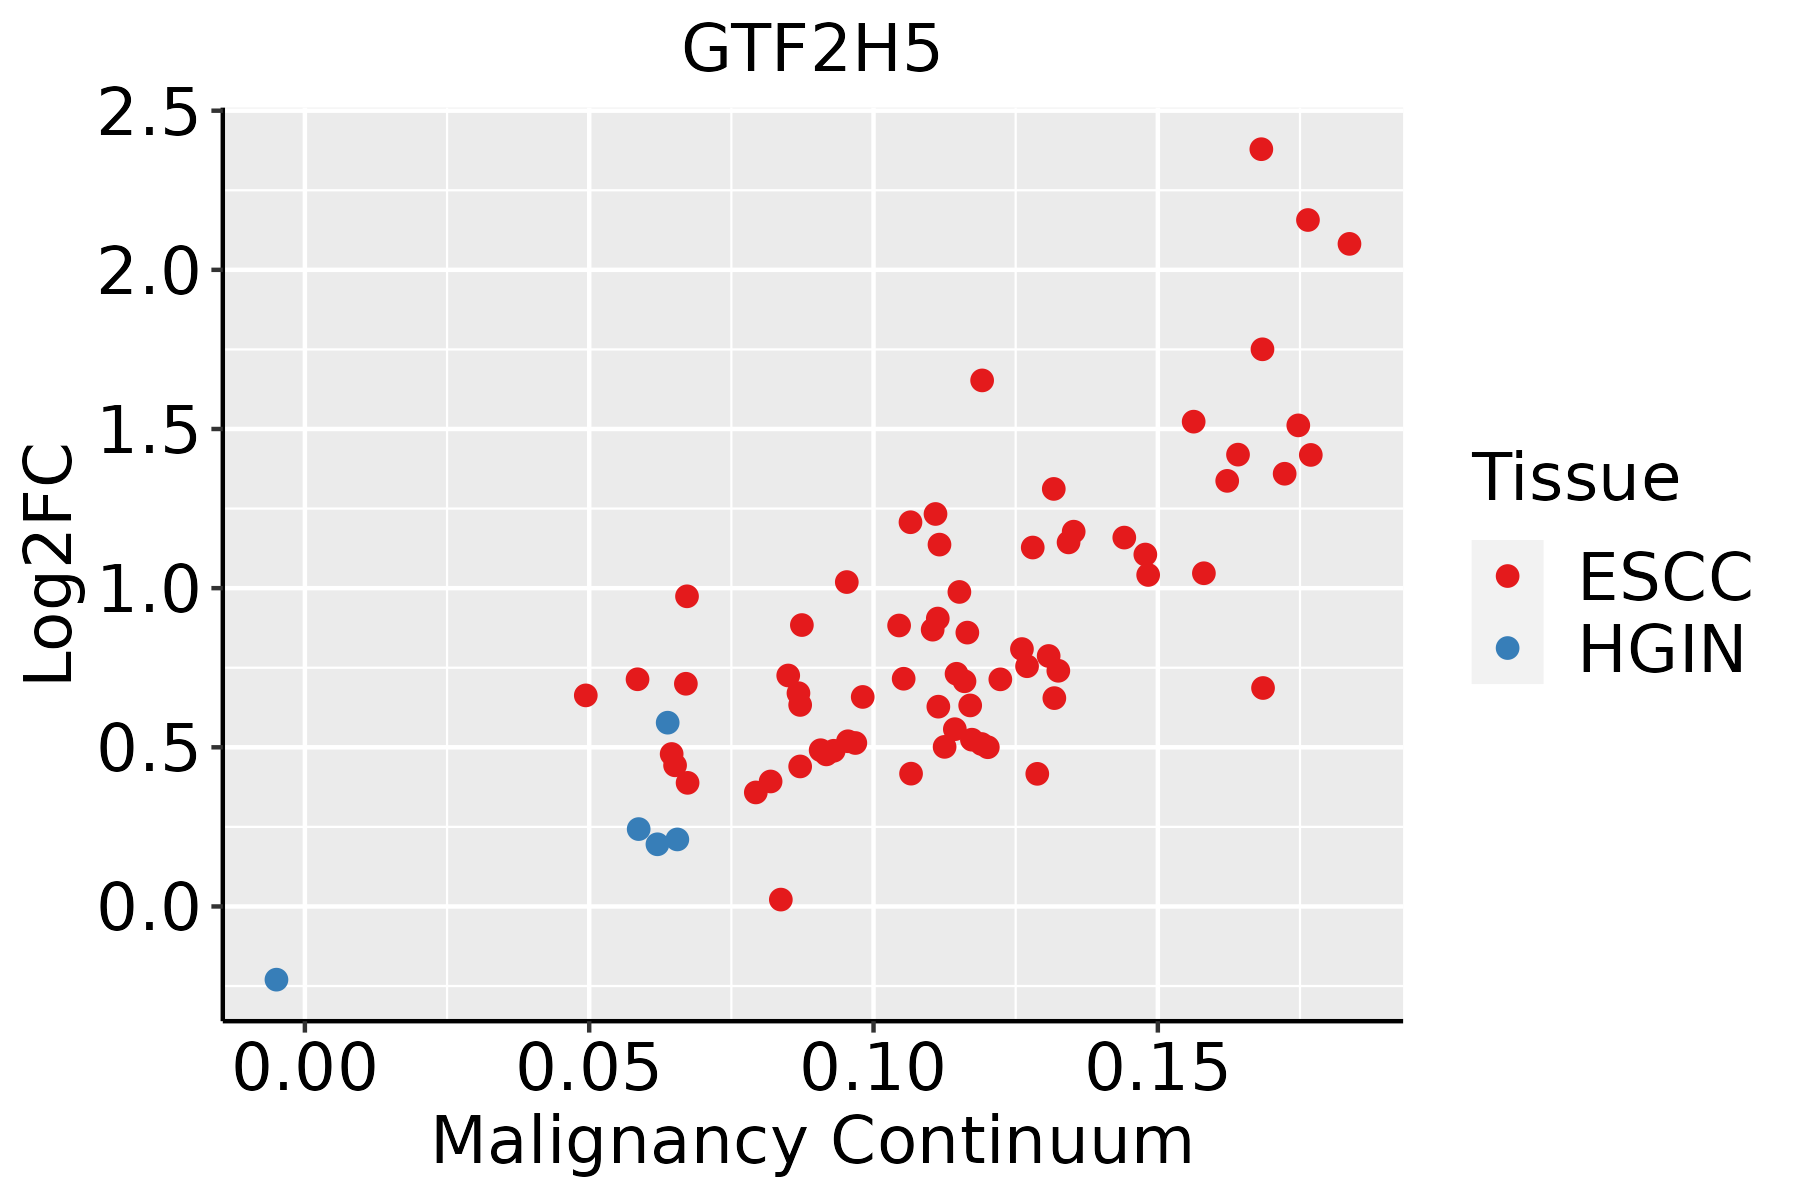 | ESCC: Esophageal squamous cell carcinoma |
| HGIN: High-grade intraepithelial neoplasias | ||
| LGIN: Low-grade intraepithelial neoplasias | ||
| Liver | 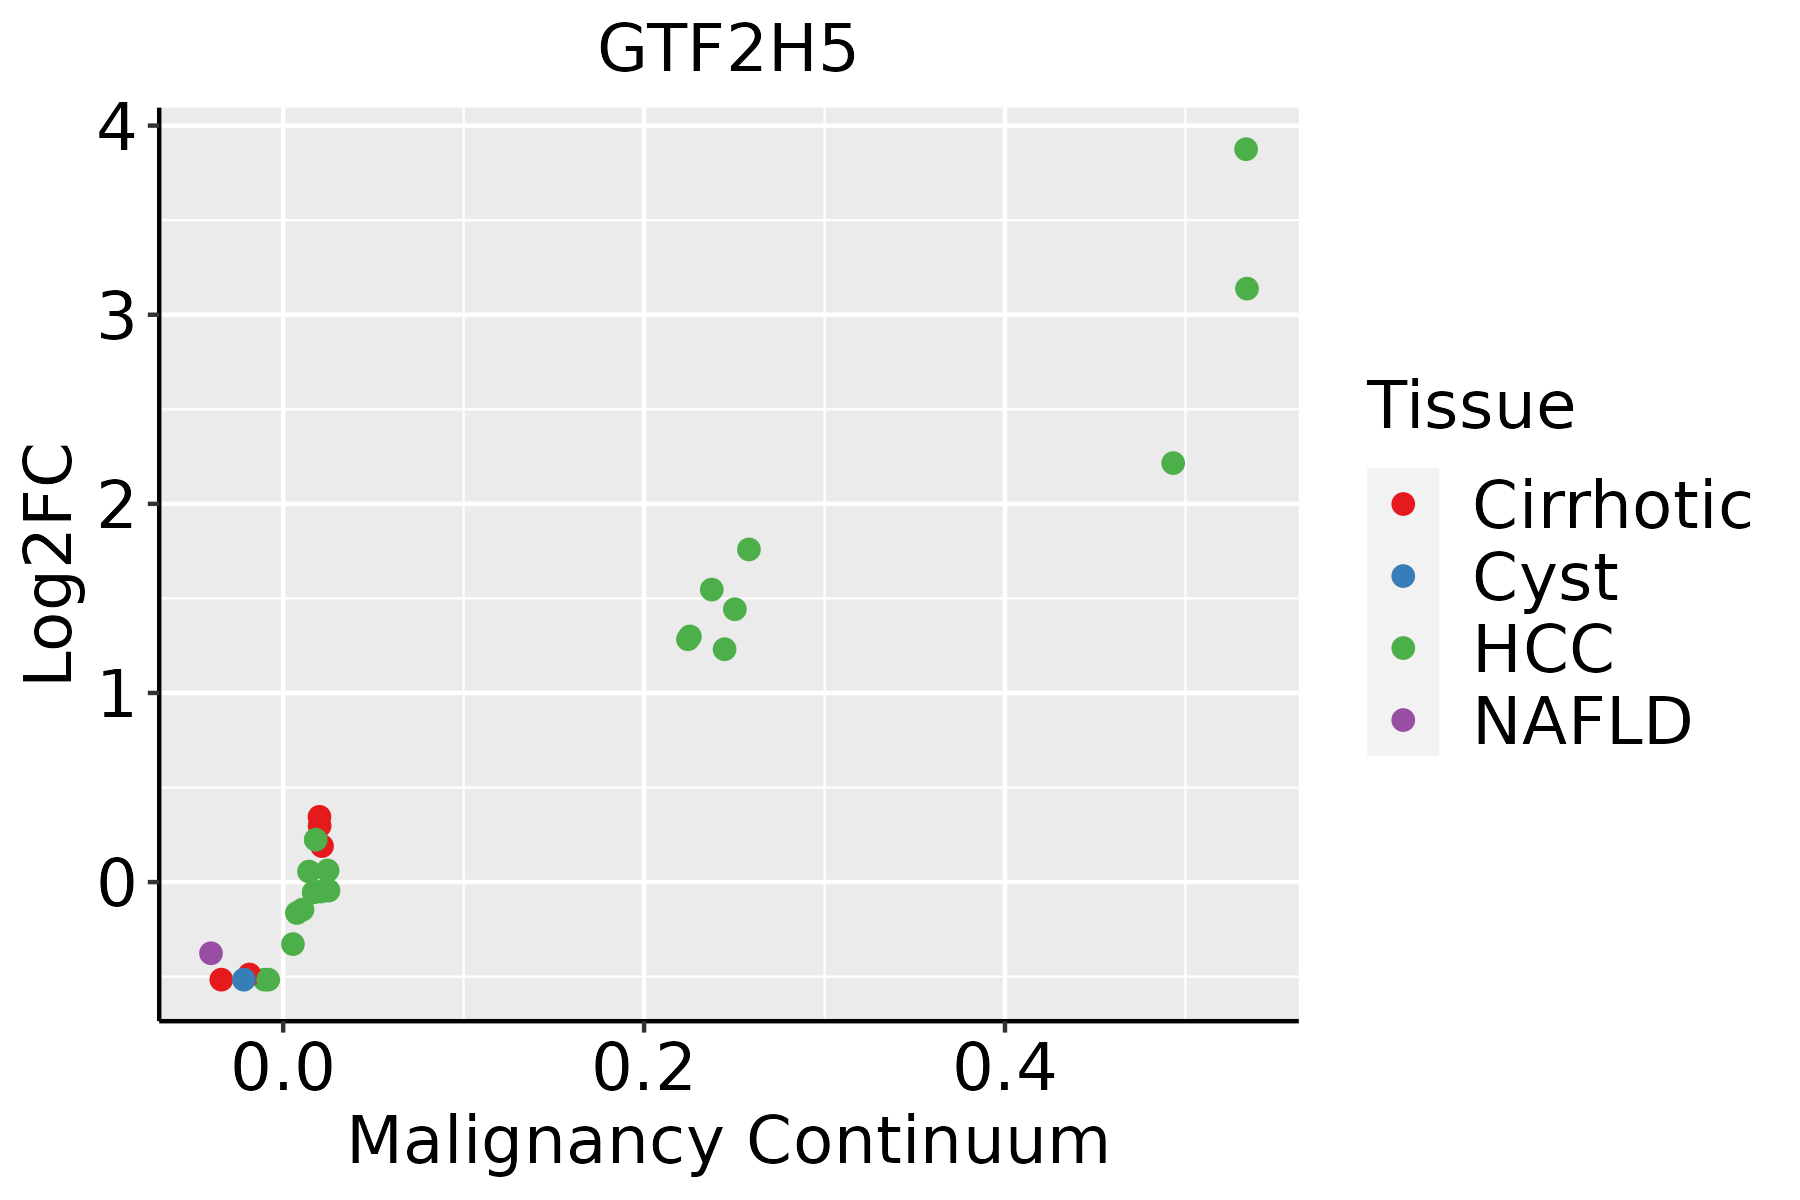 | HCC: Hepatocellular carcinoma |
| NAFLD: Non-alcoholic fatty liver disease | ||
| Oral Cavity |  | EOLP: Erosive Oral lichen planus |
| LP: leukoplakia | ||
| NEOLP: Non-erosive oral lichen planus | ||
| OSCC: Oral squamous cell carcinoma | ||
| Prostate |  | BPH: Benign Prostatic Hyperplasia |
| Skin | 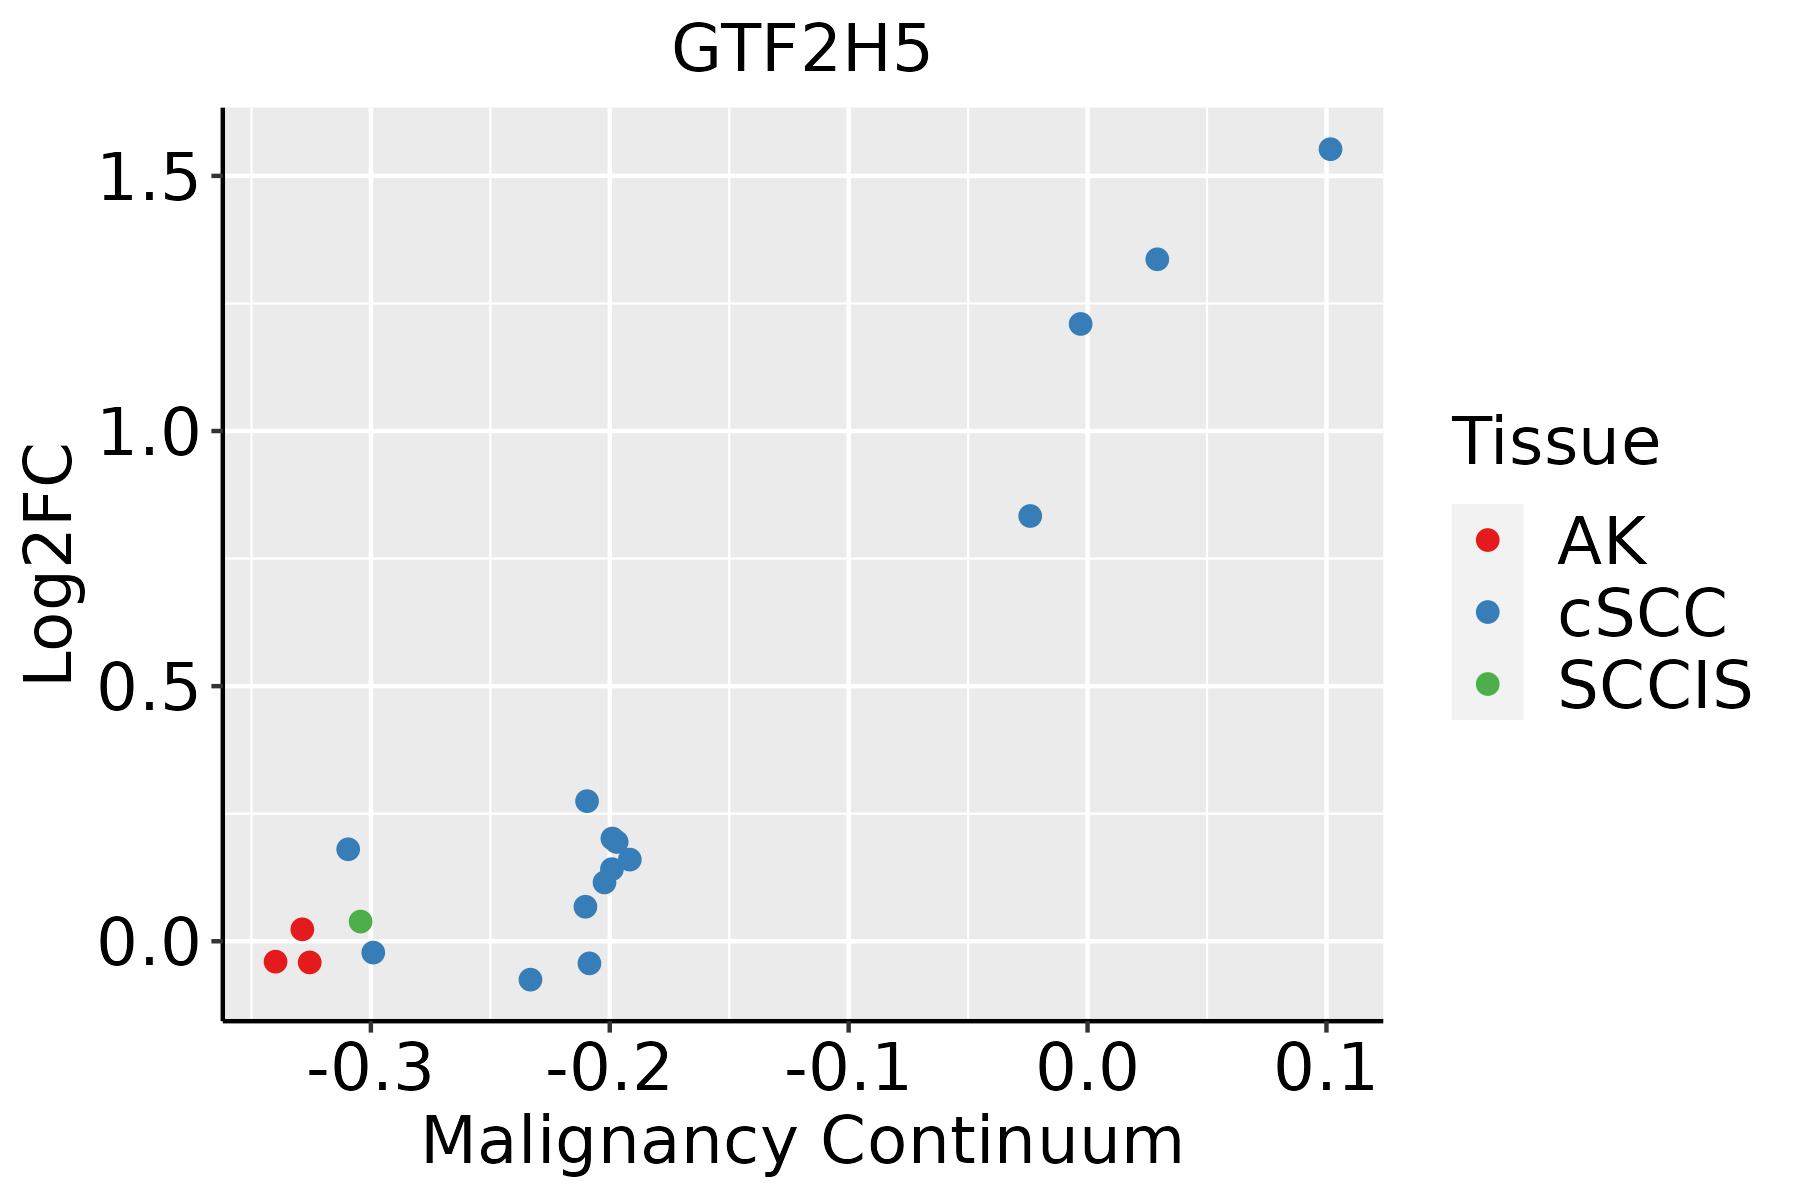 | AK: Actinic keratosis |
| cSCC: Cutaneous squamous cell carcinoma | ||
| SCCIS:squamous cell carcinoma in situ | ||
| Thyroid | 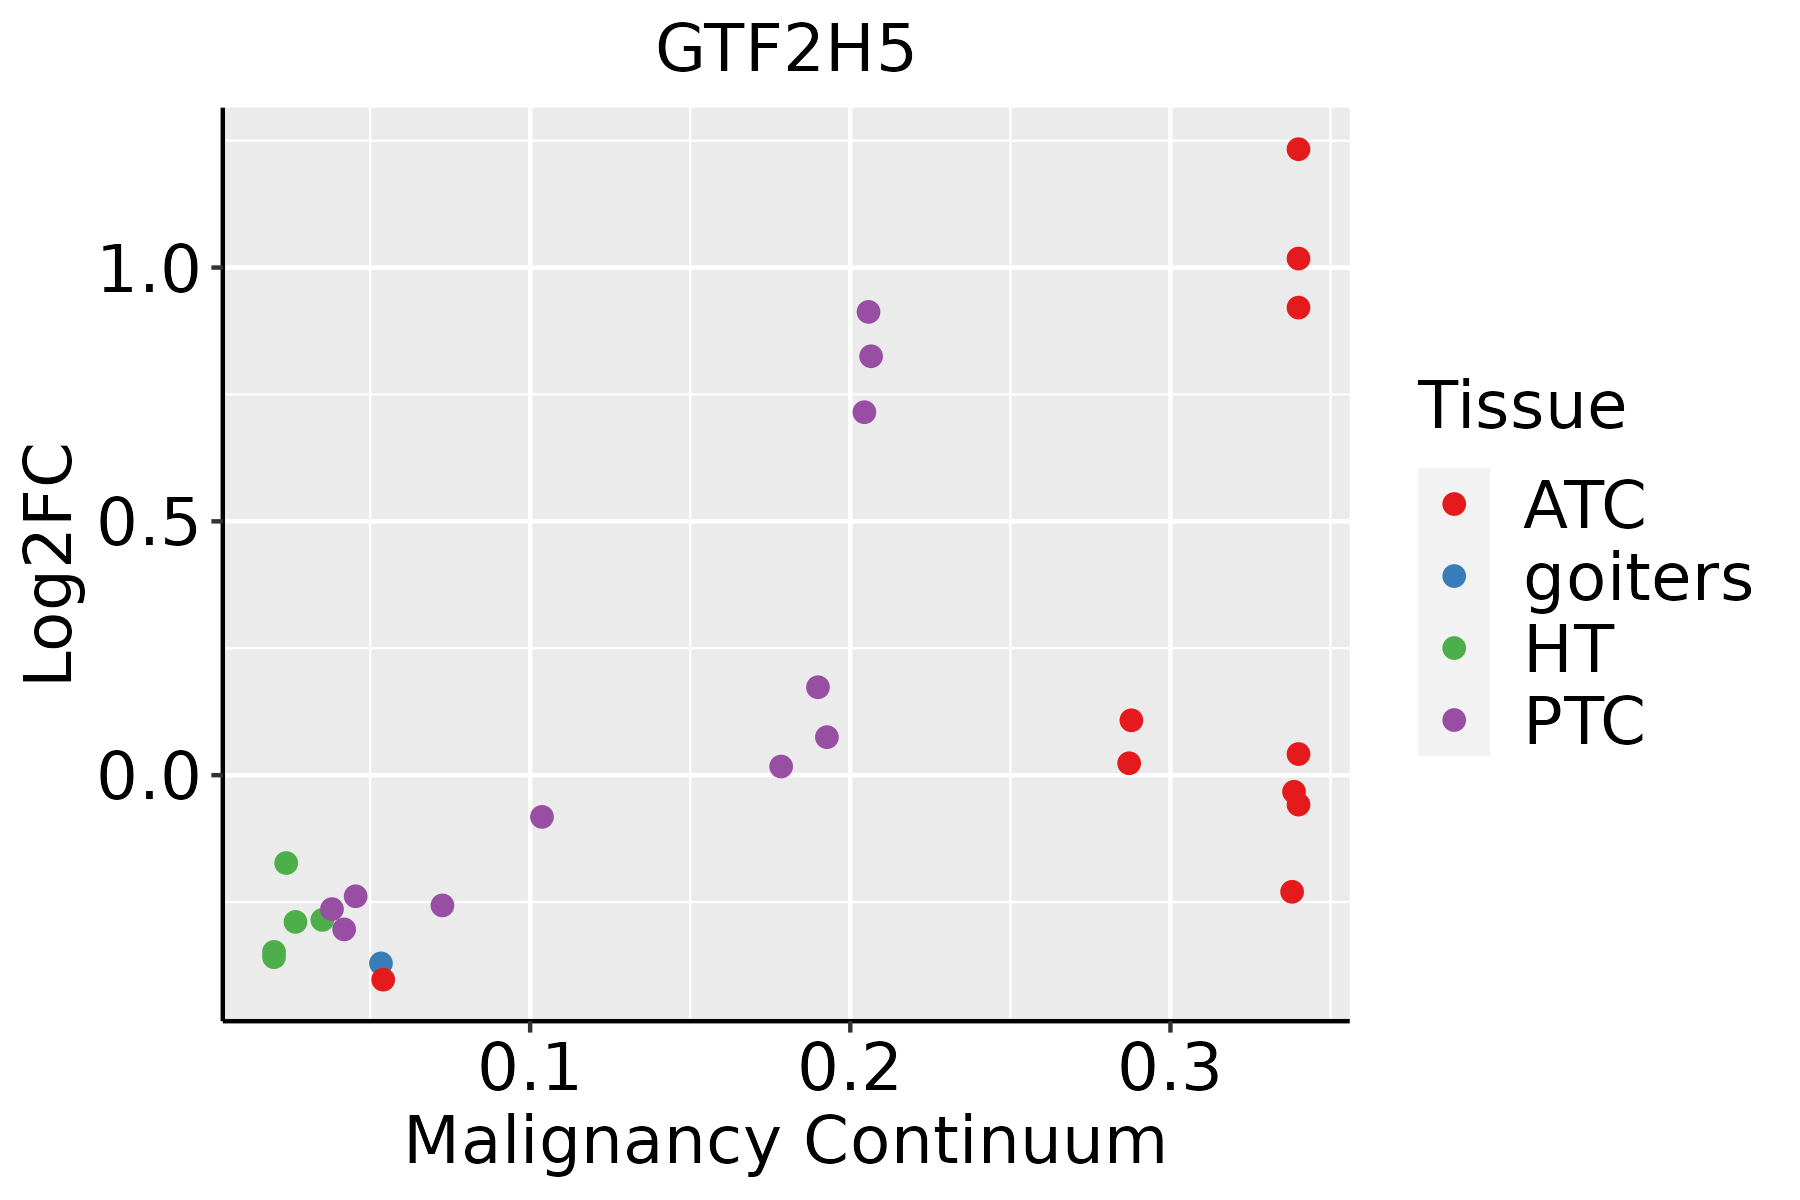 | ATC: Anaplastic thyroid cancer |
| HT: Hashimoto's thyroiditis | ||
| PTC: Papillary thyroid cancer |
| ∗log2FC in expression of this searched gene in stem-like cells from each diseased tissue sample relative to stem-like cells in normal samples in each tissue plotted against the malignancy continuum. Samples are colored based on if they are from different disease stage. |
Top |
Malignant transformation related pathway analysis |
| Find out the enriched GO biological processes and KEGG pathways involved in transition from healthy to precancer to cancer |
| Tissue | Disease Stage | Enriched GO biological Processes |
| Colorectum | AD |  |
| Colorectum | SER |  |
| Colorectum | MSS |  |
| Colorectum | MSI-H |  |
| Colorectum | FAP |  |
| ∗Top 15 enriched GO BP terms are showed in the bar plot of each disease state in each tissue. Each row represents a significant GO biological process which is colored according to the -log10(p.adjust). |
| Page: 1 2 3 4 5 6 7 8 9 |
| GO ID | Tissue | Disease Stage | Description | Gene Ratio | Bg Ratio | pvalue | p.adjust | Count |
| GO:003466021 | Thyroid | ATC | ncRNA metabolic process | 240/6293 | 485/18723 | 2.03e-13 | 9.91e-12 | 240 |
| GO:004227435 | Thyroid | ATC | ribosomal small subunit biogenesis | 55/6293 | 73/18723 | 3.33e-13 | 1.55e-11 | 55 |
| GO:000635421 | Thyroid | ATC | DNA-templated transcription, elongation | 63/6293 | 91/18723 | 3.89e-12 | 1.55e-10 | 63 |
| GO:007121427 | Thyroid | ATC | cellular response to abiotic stimulus | 169/6293 | 331/18723 | 3.24e-11 | 1.08e-09 | 169 |
| GO:010400427 | Thyroid | ATC | cellular response to environmental stimulus | 169/6293 | 331/18723 | 3.24e-11 | 1.08e-09 | 169 |
| GO:007147825 | Thyroid | ATC | cellular response to radiation | 101/6293 | 186/18723 | 4.67e-09 | 1.04e-07 | 101 |
| GO:000931426 | Thyroid | ATC | response to radiation | 210/6293 | 456/18723 | 1.69e-08 | 3.39e-07 | 210 |
| GO:0010212110 | Thyroid | ATC | response to ionizing radiation | 82/6293 | 148/18723 | 3.88e-08 | 7.15e-07 | 82 |
| GO:007147927 | Thyroid | ATC | cellular response to ionizing radiation | 46/6293 | 72/18723 | 1.41e-07 | 2.30e-06 | 46 |
| GO:003049013 | Thyroid | ATC | maturation of SSU-rRNA | 35/6293 | 50/18723 | 1.56e-07 | 2.52e-06 | 35 |
| GO:000636712 | Thyroid | ATC | transcription initiation from RNA polymerase II promoter | 44/6293 | 77/18723 | 1.86e-05 | 1.70e-04 | 44 |
| GO:007148022 | Thyroid | ATC | cellular response to gamma radiation | 22/6293 | 31/18723 | 2.35e-05 | 2.06e-04 | 22 |
| GO:000046213 | Thyroid | ATC | maturation of SSU-rRNA from tricistronic rRNA transcript (SSU-rRNA, 5.8S rRNA, LSU-rRNA) | 25/6293 | 37/18723 | 2.50e-05 | 2.16e-04 | 25 |
| GO:001033217 | Thyroid | ATC | response to gamma radiation | 34/6293 | 56/18723 | 2.92e-05 | 2.45e-04 | 34 |
| GO:000635213 | Thyroid | ATC | DNA-templated transcription, initiation | 64/6293 | 130/18723 | 1.60e-04 | 1.10e-03 | 64 |
| GO:00718242 | Thyroid | ATC | protein-DNA complex subunit organization | 103/6293 | 241/18723 | 1.84e-03 | 9.03e-03 | 103 |
| GO:000636011 | Thyroid | ATC | transcription by RNA polymerase I | 28/6293 | 55/18723 | 5.94e-03 | 2.39e-02 | 28 |
| Page: 1 2 3 4 5 6 7 8 9 10 11 12 13 14 15 |
| Pathway ID | Tissue | Disease Stage | Description | Gene Ratio | Bg Ratio | pvalue | p.adjust | qvalue | Count |
| hsa034205 | Esophagus | HGIN | Nucleotide excision repair | 29/1383 | 63/8465 | 2.96e-08 | 5.36e-07 | 4.26e-07 | 29 |
| hsa0342012 | Esophagus | HGIN | Nucleotide excision repair | 29/1383 | 63/8465 | 2.96e-08 | 5.36e-07 | 4.26e-07 | 29 |
| hsa0342022 | Esophagus | ESCC | Nucleotide excision repair | 54/4205 | 63/8465 | 2.01e-09 | 2.17e-08 | 1.11e-08 | 54 |
| hsa030222 | Esophagus | ESCC | Basal transcription factors | 35/4205 | 45/8465 | 1.01e-04 | 4.06e-04 | 2.08e-04 | 35 |
| hsa0342032 | Esophagus | ESCC | Nucleotide excision repair | 54/4205 | 63/8465 | 2.01e-09 | 2.17e-08 | 1.11e-08 | 54 |
| hsa0302211 | Esophagus | ESCC | Basal transcription factors | 35/4205 | 45/8465 | 1.01e-04 | 4.06e-04 | 2.08e-04 | 35 |
| hsa03420 | Liver | Cirrhotic | Nucleotide excision repair | 29/2530 | 63/8465 | 4.81e-03 | 1.74e-02 | 1.07e-02 | 29 |
| hsa034201 | Liver | Cirrhotic | Nucleotide excision repair | 29/2530 | 63/8465 | 4.81e-03 | 1.74e-02 | 1.07e-02 | 29 |
| hsa034202 | Liver | HCC | Nucleotide excision repair | 41/4020 | 63/8465 | 3.59e-03 | 1.12e-02 | 6.22e-03 | 41 |
| hsa034203 | Liver | HCC | Nucleotide excision repair | 41/4020 | 63/8465 | 3.59e-03 | 1.12e-02 | 6.22e-03 | 41 |
| hsa034204 | Oral cavity | OSCC | Nucleotide excision repair | 49/3704 | 63/8465 | 3.48e-08 | 2.91e-07 | 1.48e-07 | 49 |
| hsa03022 | Oral cavity | OSCC | Basal transcription factors | 28/3704 | 45/8465 | 9.53e-03 | 2.11e-02 | 1.08e-02 | 28 |
| hsa0342011 | Oral cavity | OSCC | Nucleotide excision repair | 49/3704 | 63/8465 | 3.48e-08 | 2.91e-07 | 1.48e-07 | 49 |
| hsa030221 | Oral cavity | OSCC | Basal transcription factors | 28/3704 | 45/8465 | 9.53e-03 | 2.11e-02 | 1.08e-02 | 28 |
| hsa0342021 | Oral cavity | LP | Nucleotide excision repair | 37/2418 | 63/8465 | 5.14e-07 | 6.33e-06 | 4.08e-06 | 37 |
| hsa0342031 | Oral cavity | LP | Nucleotide excision repair | 37/2418 | 63/8465 | 5.14e-07 | 6.33e-06 | 4.08e-06 | 37 |
| Page: 1 |
Top |
Cell-cell communication analysis |
| Identification of potential cell-cell interactions between two cell types and their ligand-receptor pairs for different disease states |
| Ligand | Receptor | LRpair | Pathway | Tissue | Disease Stage |
| Page: 1 |
Top |
Single-cell gene regulatory network inference analysis |
| Find out the significant the regulons (TFs) and the target genes of each regulon across cell types for different disease states |
| TF | Cell Type | Tissue | Disease Stage | Target Gene | RSS | Regulon Activity |
| ∗The dot plots of a searched regulon are shown for all cell subpopulations in each disease state of each tissue based on the regulon specific score inferred using pySCENIC and by calculating the average expression. |
| Page: 1 |
Top |
Somatic mutation of malignant transformation related genes |
| Annotation of somatic variants for genes involved in malignant transformation |
| Hugo Symbol | Variant Class | Variant Classification | dbSNP RS | HGVSc | HGVSp | HGVSp Short | SWISSPROT | BIOTYPE | SIFT | PolyPhen | Tumor Sample Barcode | Tissue | Histology | Sex | Age | Stage | Therapy Types | Drugs | Outcome |
| GTF2H5 | SNV | Missense_Mutation | rs114381286 | c.127G>A | p.Val43Ile | p.V43I | Q6ZYL4 | protein_coding | tolerated(0.38) | benign(0.12) | TCGA-AJ-A3TW-01 | Endometrium | uterine corpus endometrioid carcinoma | Female | >=65 | I/II | Unknown | Unknown | SD |
| GTF2H5 | SNV | Missense_Mutation | novel | c.96N>T | p.Lys32Asn | p.K32N | Q6ZYL4 | protein_coding | deleterious(0.03) | possibly_damaging(0.774) | TCGA-AX-A06F-01 | Endometrium | uterine corpus endometrioid carcinoma | Female | <65 | III/IV | Chemotherapy | carboplatin | SD |
| GTF2H5 | SNV | Missense_Mutation | c.152N>G | p.Asn51Ser | p.N51S | Q6ZYL4 | protein_coding | tolerated(0.69) | benign(0.005) | TCGA-B5-A0JY-01 | Endometrium | uterine corpus endometrioid carcinoma | Female | <65 | III/IV | Chemotherapy | doxorubicin | SD | |
| GTF2H5 | SNV | Missense_Mutation | c.106N>G | p.Gln36Glu | p.Q36E | Q6ZYL4 | protein_coding | tolerated(0.16) | benign(0.01) | TCGA-CN-A6V1-01 | Oral cavity | head & neck squamous cell carcinoma | Male | <65 | I/II | Immunotherapy | erbitux | CR |
| Page: 1 |
Top |
Related drugs of malignant transformation related genes |
| Identification of chemicals and drugs interact with genes involved in malignant transfromation |
| (DGIdb 4.0) |
| Entrez ID | Symbol | Category | Interaction Types | Drug Claim Name | Drug Name | PMIDs |
| Page: 1 |

Copyright 2023-Present -The University of Texas Health Science Center at Houston |