
|
|||||
|
 | |
| |
| |
| |
| |
| |
|
Gene: FNBP1 |
Gene summary for FNBP1 |
| Gene information | Species | Human | Gene symbol | FNBP1 | Gene ID | 23048 |
| Gene name | formin binding protein 1 | |
| Gene Alias | FBP17 | |
| Cytomap | 9q34.11 | |
| Gene Type | protein-coding | GO ID | GO:0006810 | UniProtAcc | Q96RU3 |
Top |
Malignant transformation analysis |
| Identification of the aberrant gene expression in precancerous and cancerous lesions by comparing the gene expression of stem-like cells in diseased tissues with normal stem cells |
| Entrez ID | Symbol | Replicates | Species | Organ | Tissue | Adj P-value | Log2FC | Malignancy |
| 23048 | FNBP1 | HTA11_3410_2000001011 | Human | Colorectum | AD | 3.37e-16 | -6.04e-01 | 0.0155 |
| 23048 | FNBP1 | HTA11_1938_2000001011 | Human | Colorectum | AD | 1.41e-02 | -4.30e-01 | -0.0811 |
| 23048 | FNBP1 | HTA11_347_2000001011 | Human | Colorectum | AD | 1.20e-12 | 6.76e-01 | -0.1954 |
| 23048 | FNBP1 | HTA11_1391_2000001011 | Human | Colorectum | AD | 8.64e-04 | -3.79e-01 | -0.059 |
| 23048 | FNBP1 | HTA11_866_3004761011 | Human | Colorectum | AD | 7.46e-07 | -4.08e-01 | 0.096 |
| 23048 | FNBP1 | HTA11_10711_2000001011 | Human | Colorectum | AD | 2.72e-06 | -5.07e-01 | 0.0338 |
| 23048 | FNBP1 | HTA11_7696_3000711011 | Human | Colorectum | AD | 2.58e-13 | -5.25e-01 | 0.0674 |
| 23048 | FNBP1 | HTA11_99999970781_79442 | Human | Colorectum | MSS | 9.12e-03 | -3.03e-01 | 0.294 |
| 23048 | FNBP1 | HTA11_99999971662_82457 | Human | Colorectum | MSS | 1.15e-07 | -3.60e-01 | 0.3859 |
| 23048 | FNBP1 | HTA11_99999973899_84307 | Human | Colorectum | MSS | 7.62e-03 | -5.00e-01 | 0.2585 |
| 23048 | FNBP1 | HTA11_99999974143_84620 | Human | Colorectum | MSS | 1.61e-14 | -4.61e-01 | 0.3005 |
| 23048 | FNBP1 | F007 | Human | Colorectum | FAP | 9.04e-03 | -2.73e-01 | 0.1176 |
| 23048 | FNBP1 | A002-C-010 | Human | Colorectum | FAP | 1.82e-07 | -3.47e-01 | 0.242 |
| 23048 | FNBP1 | A001-C-207 | Human | Colorectum | FAP | 7.92e-05 | -3.56e-01 | 0.1278 |
| 23048 | FNBP1 | A015-C-203 | Human | Colorectum | FAP | 2.13e-27 | -3.94e-01 | -0.1294 |
| 23048 | FNBP1 | A015-C-204 | Human | Colorectum | FAP | 6.55e-08 | -3.43e-01 | -0.0228 |
| 23048 | FNBP1 | A014-C-040 | Human | Colorectum | FAP | 4.29e-03 | -3.27e-01 | -0.1184 |
| 23048 | FNBP1 | A002-C-201 | Human | Colorectum | FAP | 4.13e-17 | -5.09e-01 | 0.0324 |
| 23048 | FNBP1 | A002-C-203 | Human | Colorectum | FAP | 6.61e-04 | -2.42e-01 | 0.2786 |
| 23048 | FNBP1 | A001-C-119 | Human | Colorectum | FAP | 1.72e-04 | -2.98e-01 | -0.1557 |
| Page: 1 2 3 4 5 6 7 8 9 |
| Tissue | Expression Dynamics | Abbreviation |
| Colorectum (GSE201348) |  | FAP: Familial adenomatous polyposis |
| CRC: Colorectal cancer | ||
| Colorectum (HTA11) |  | AD: Adenomas |
| SER: Sessile serrated lesions | ||
| MSI-H: Microsatellite-high colorectal cancer | ||
| MSS: Microsatellite stable colorectal cancer | ||
| Endometrium | 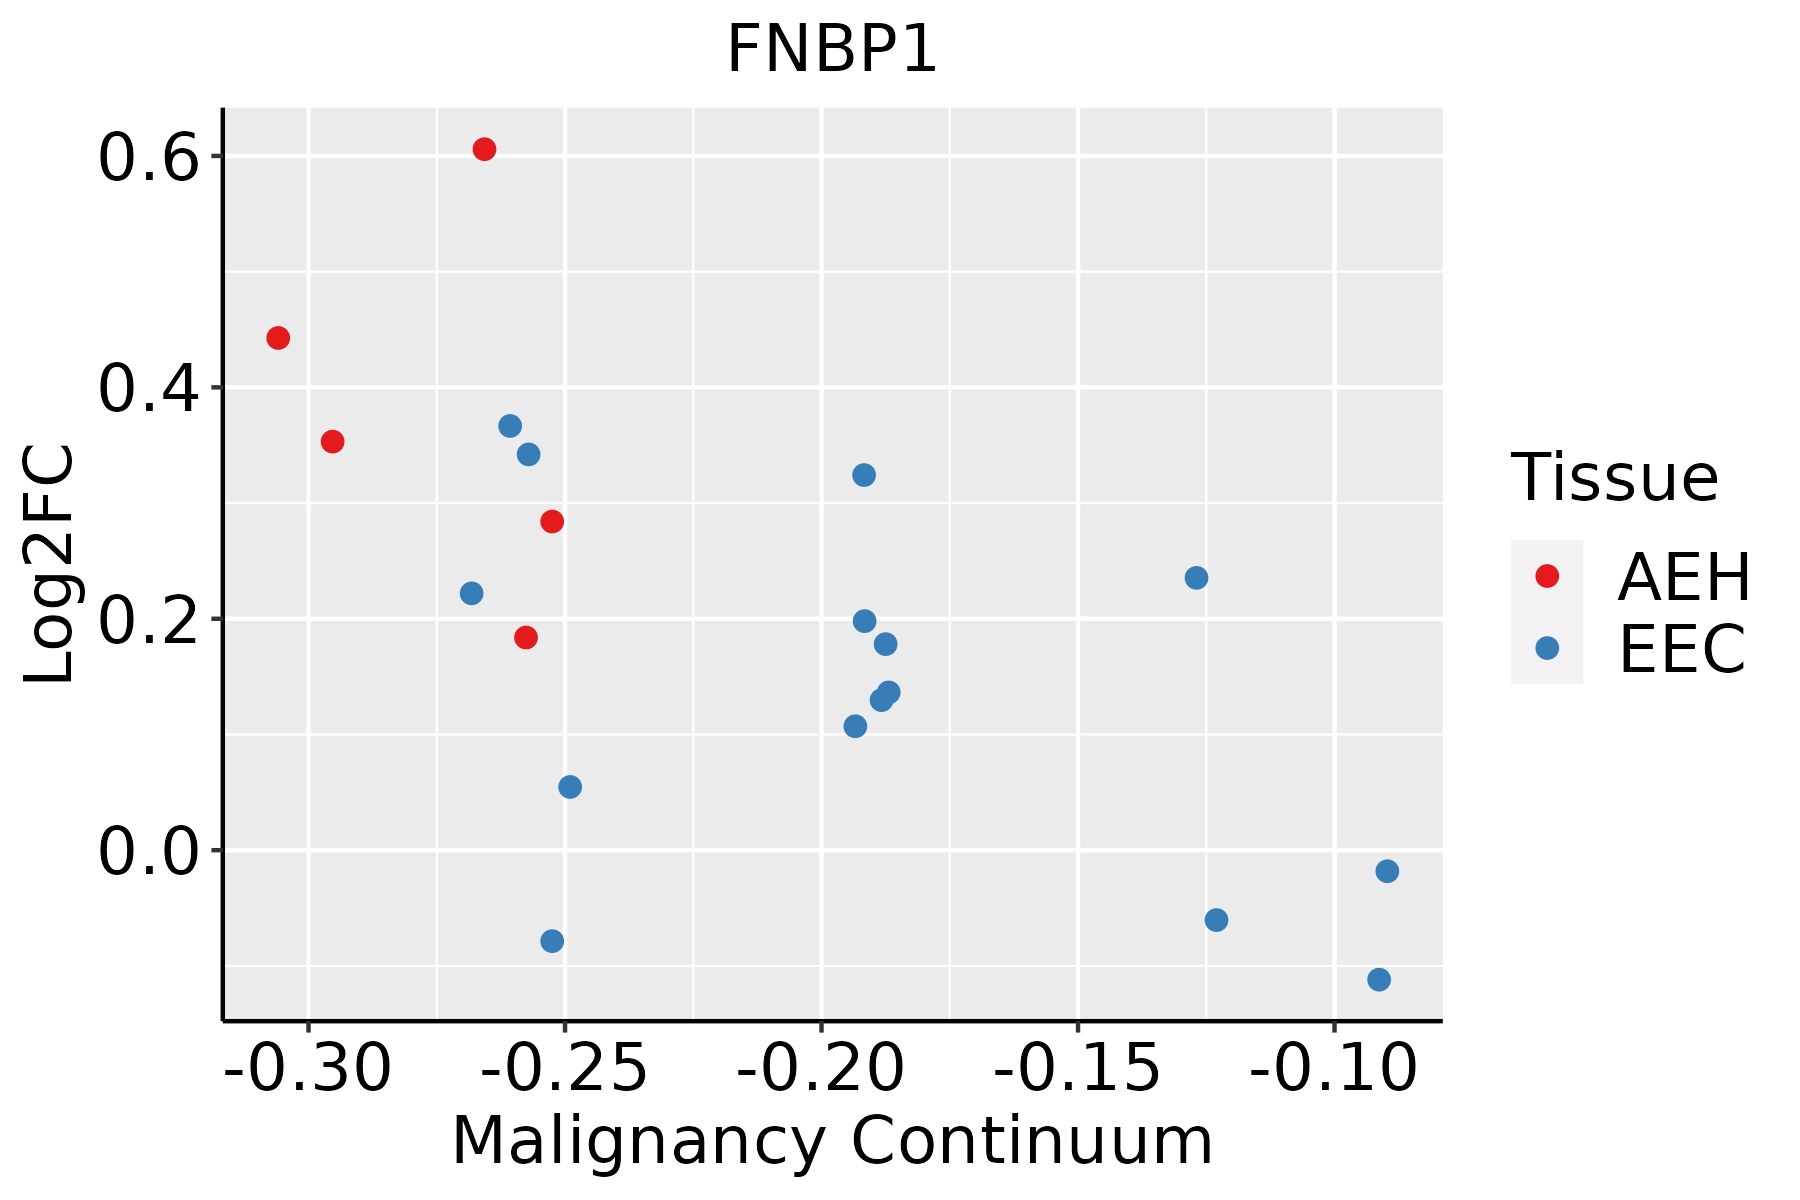 | AEH: Atypical endometrial hyperplasia |
| EEC: Endometrioid Cancer | ||
| Esophagus | 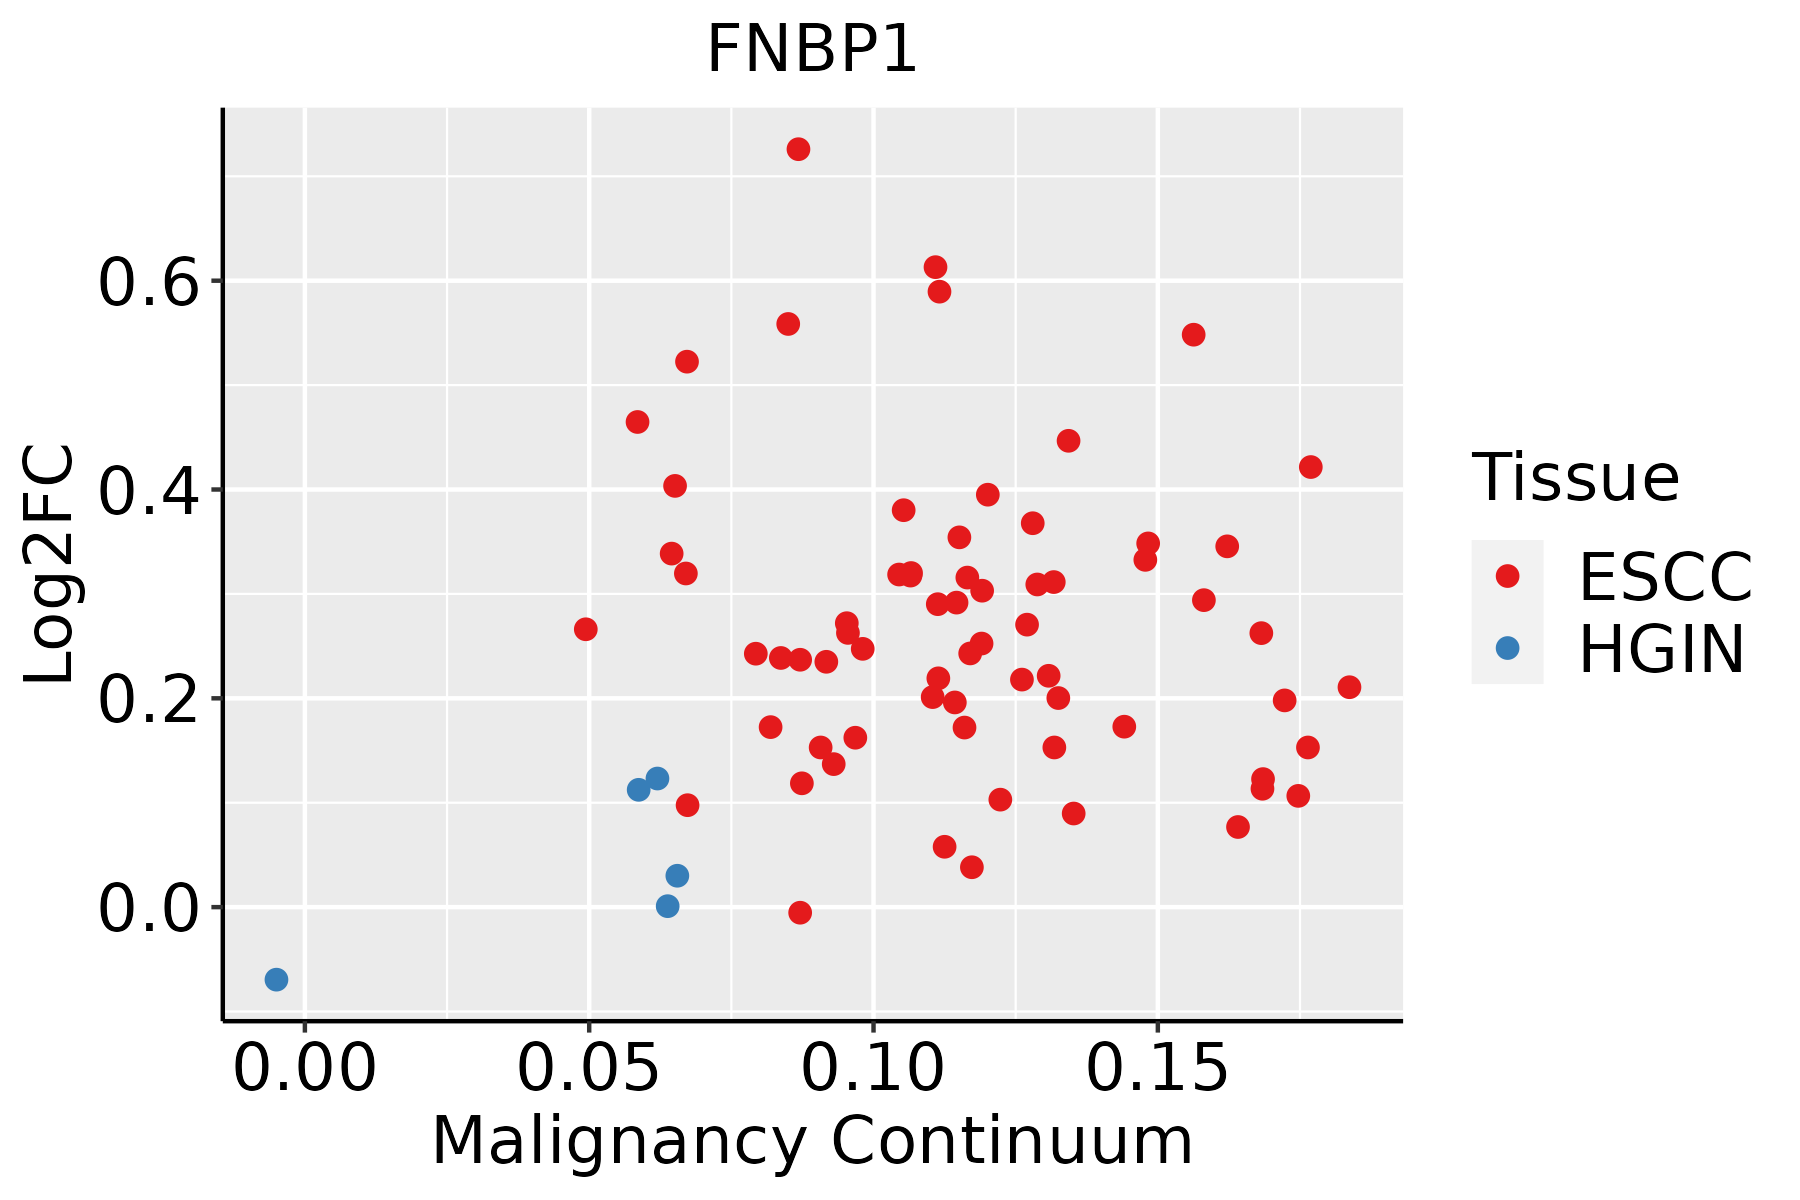 | ESCC: Esophageal squamous cell carcinoma |
| HGIN: High-grade intraepithelial neoplasias | ||
| LGIN: Low-grade intraepithelial neoplasias | ||
| Liver | 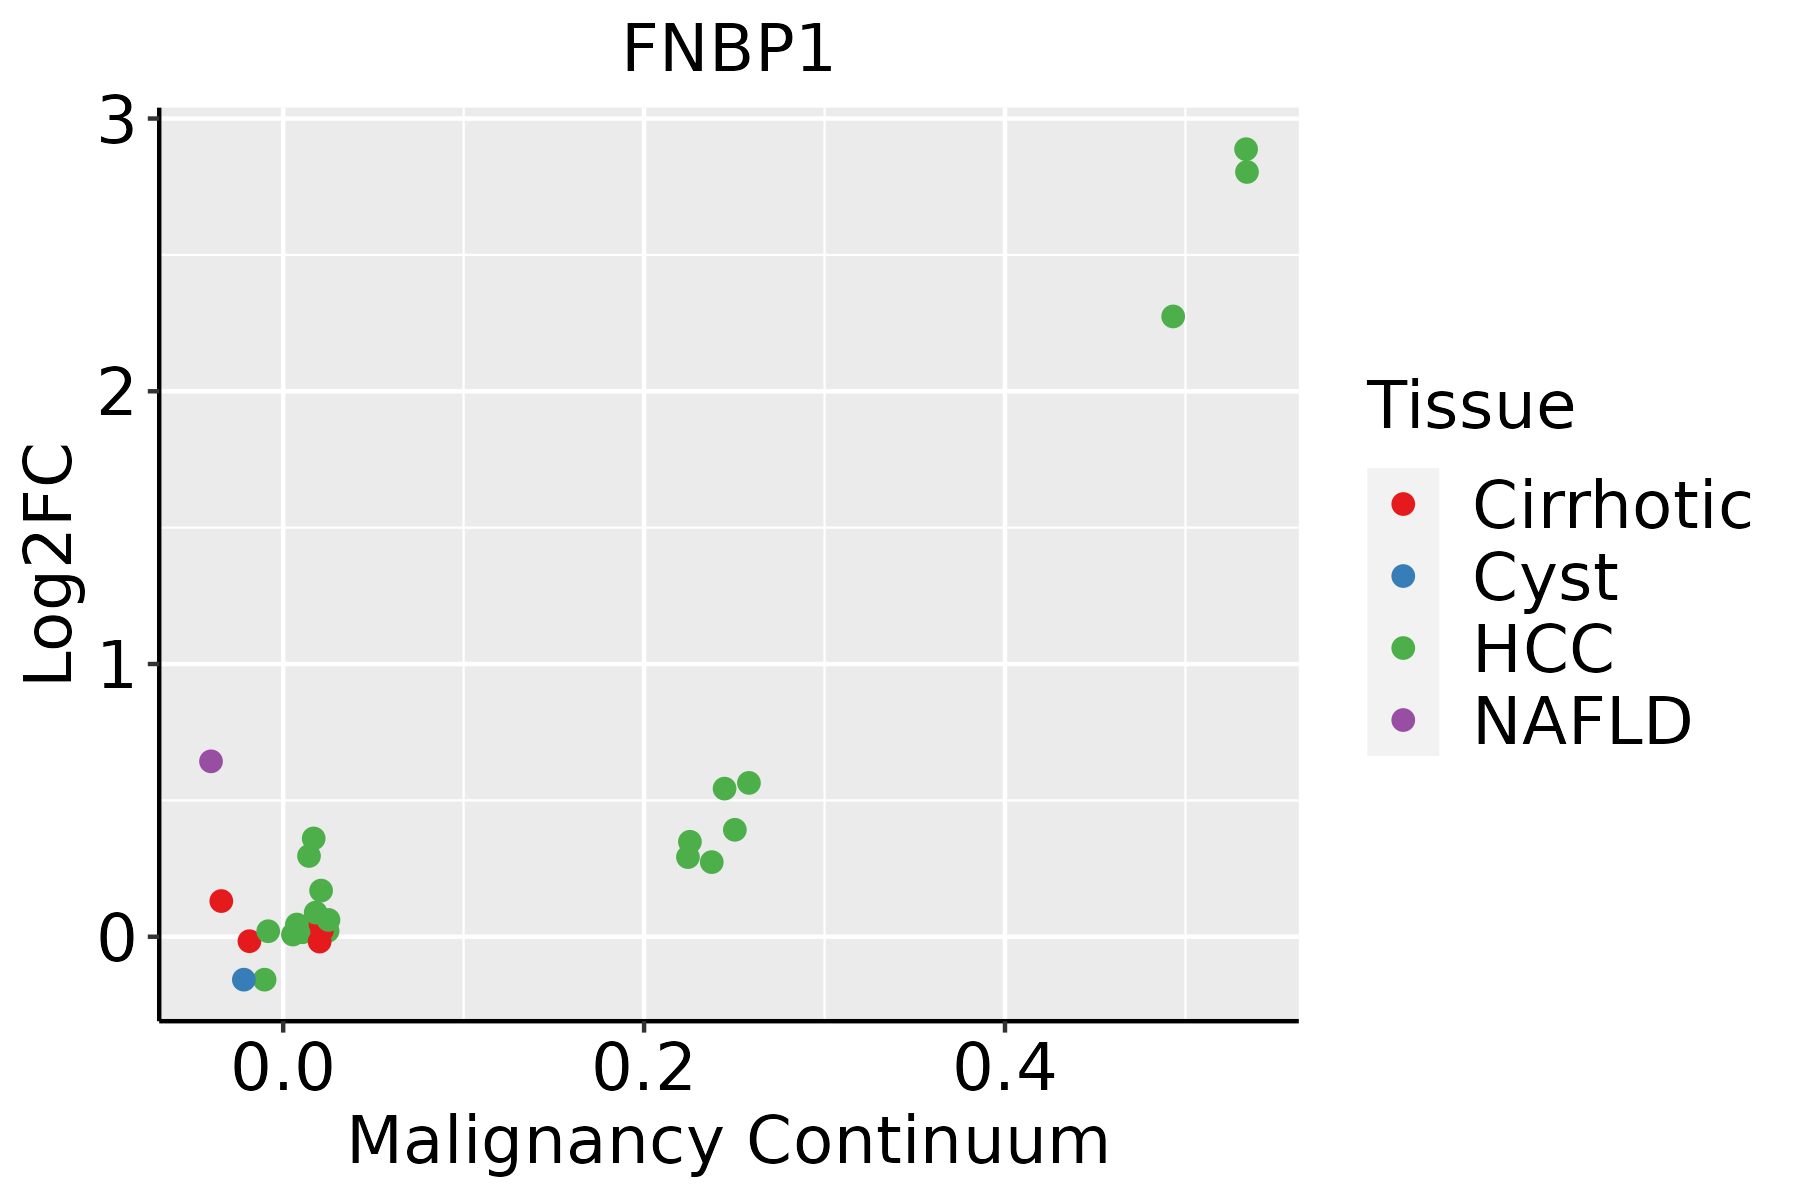 | HCC: Hepatocellular carcinoma |
| NAFLD: Non-alcoholic fatty liver disease | ||
| Lung | 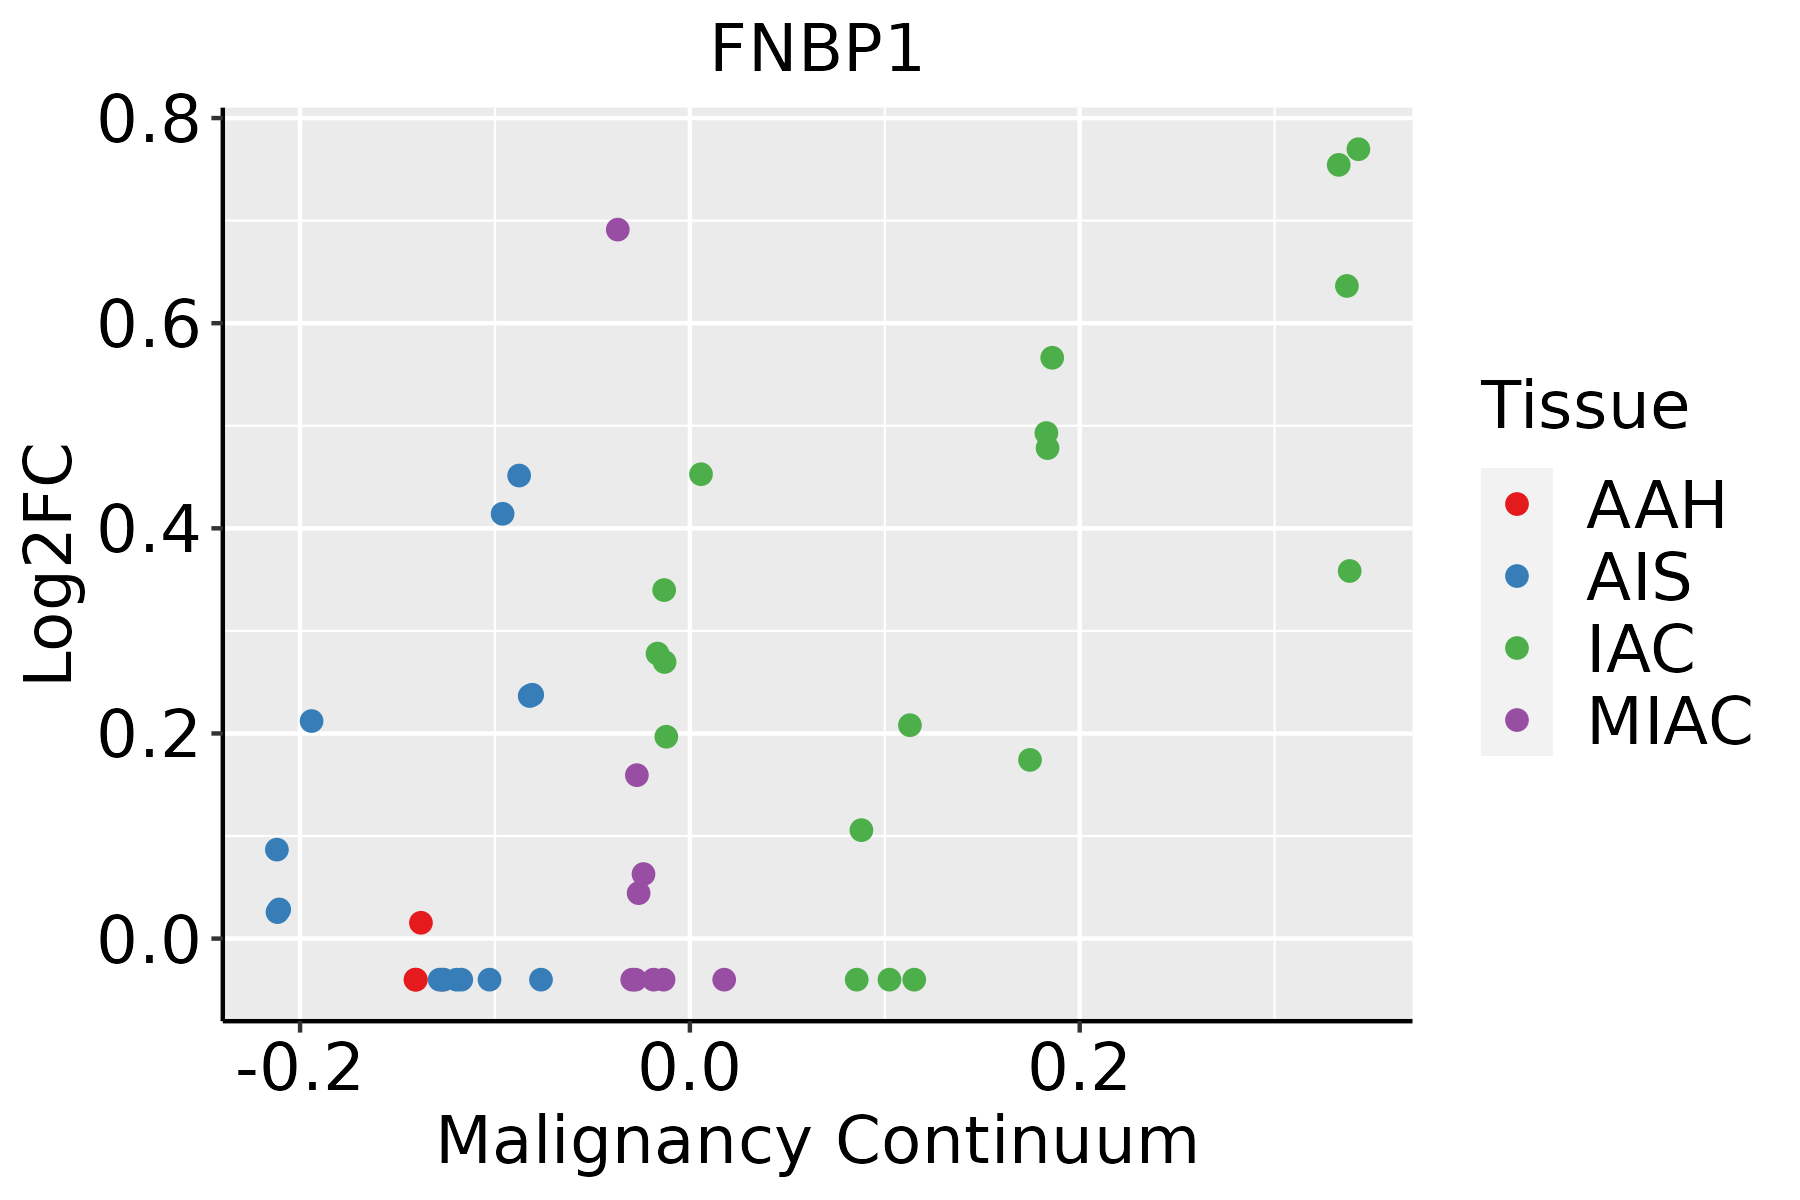 | AAH: Atypical adenomatous hyperplasia |
| AIS: Adenocarcinoma in situ | ||
| IAC: Invasive lung adenocarcinoma | ||
| MIA: Minimally invasive adenocarcinoma | ||
| Oral Cavity | 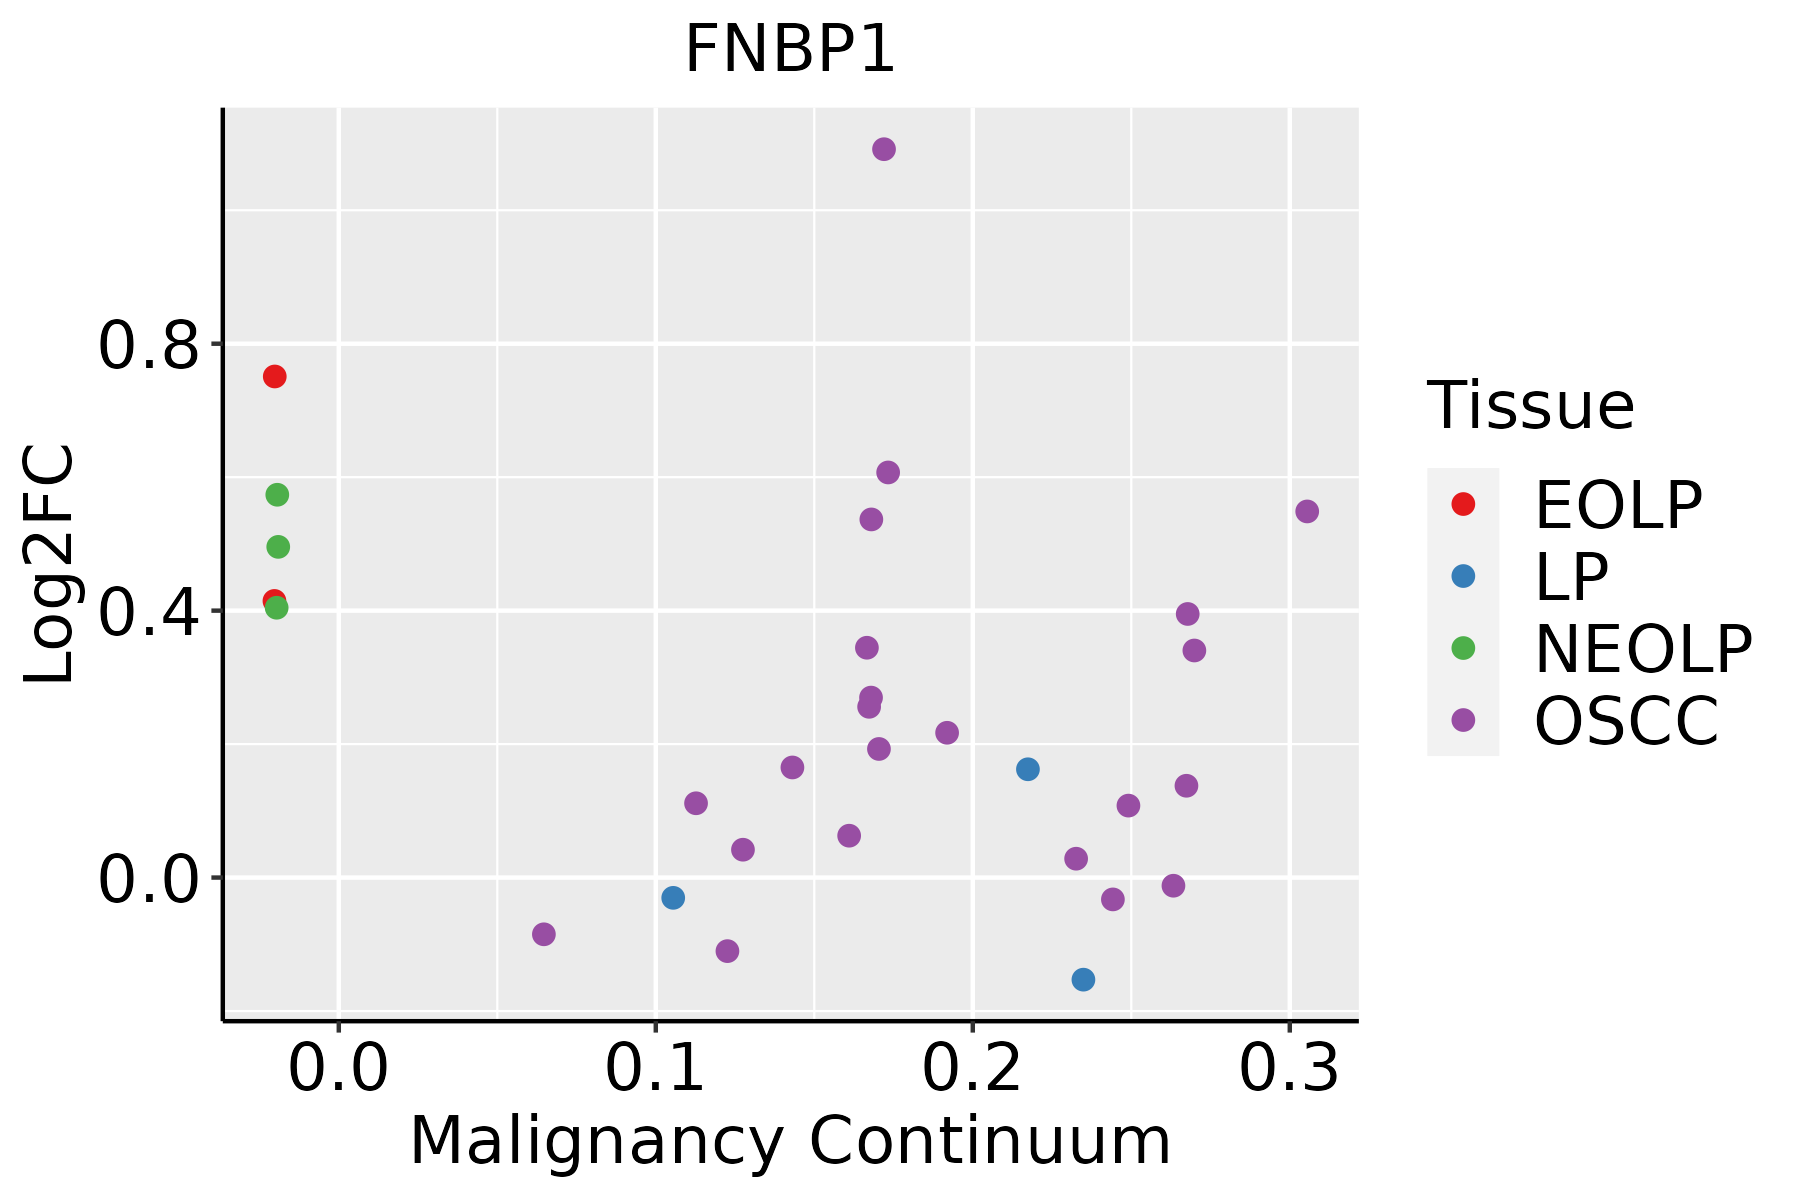 | EOLP: Erosive Oral lichen planus |
| LP: leukoplakia | ||
| NEOLP: Non-erosive oral lichen planus | ||
| OSCC: Oral squamous cell carcinoma | ||
| Prostate | 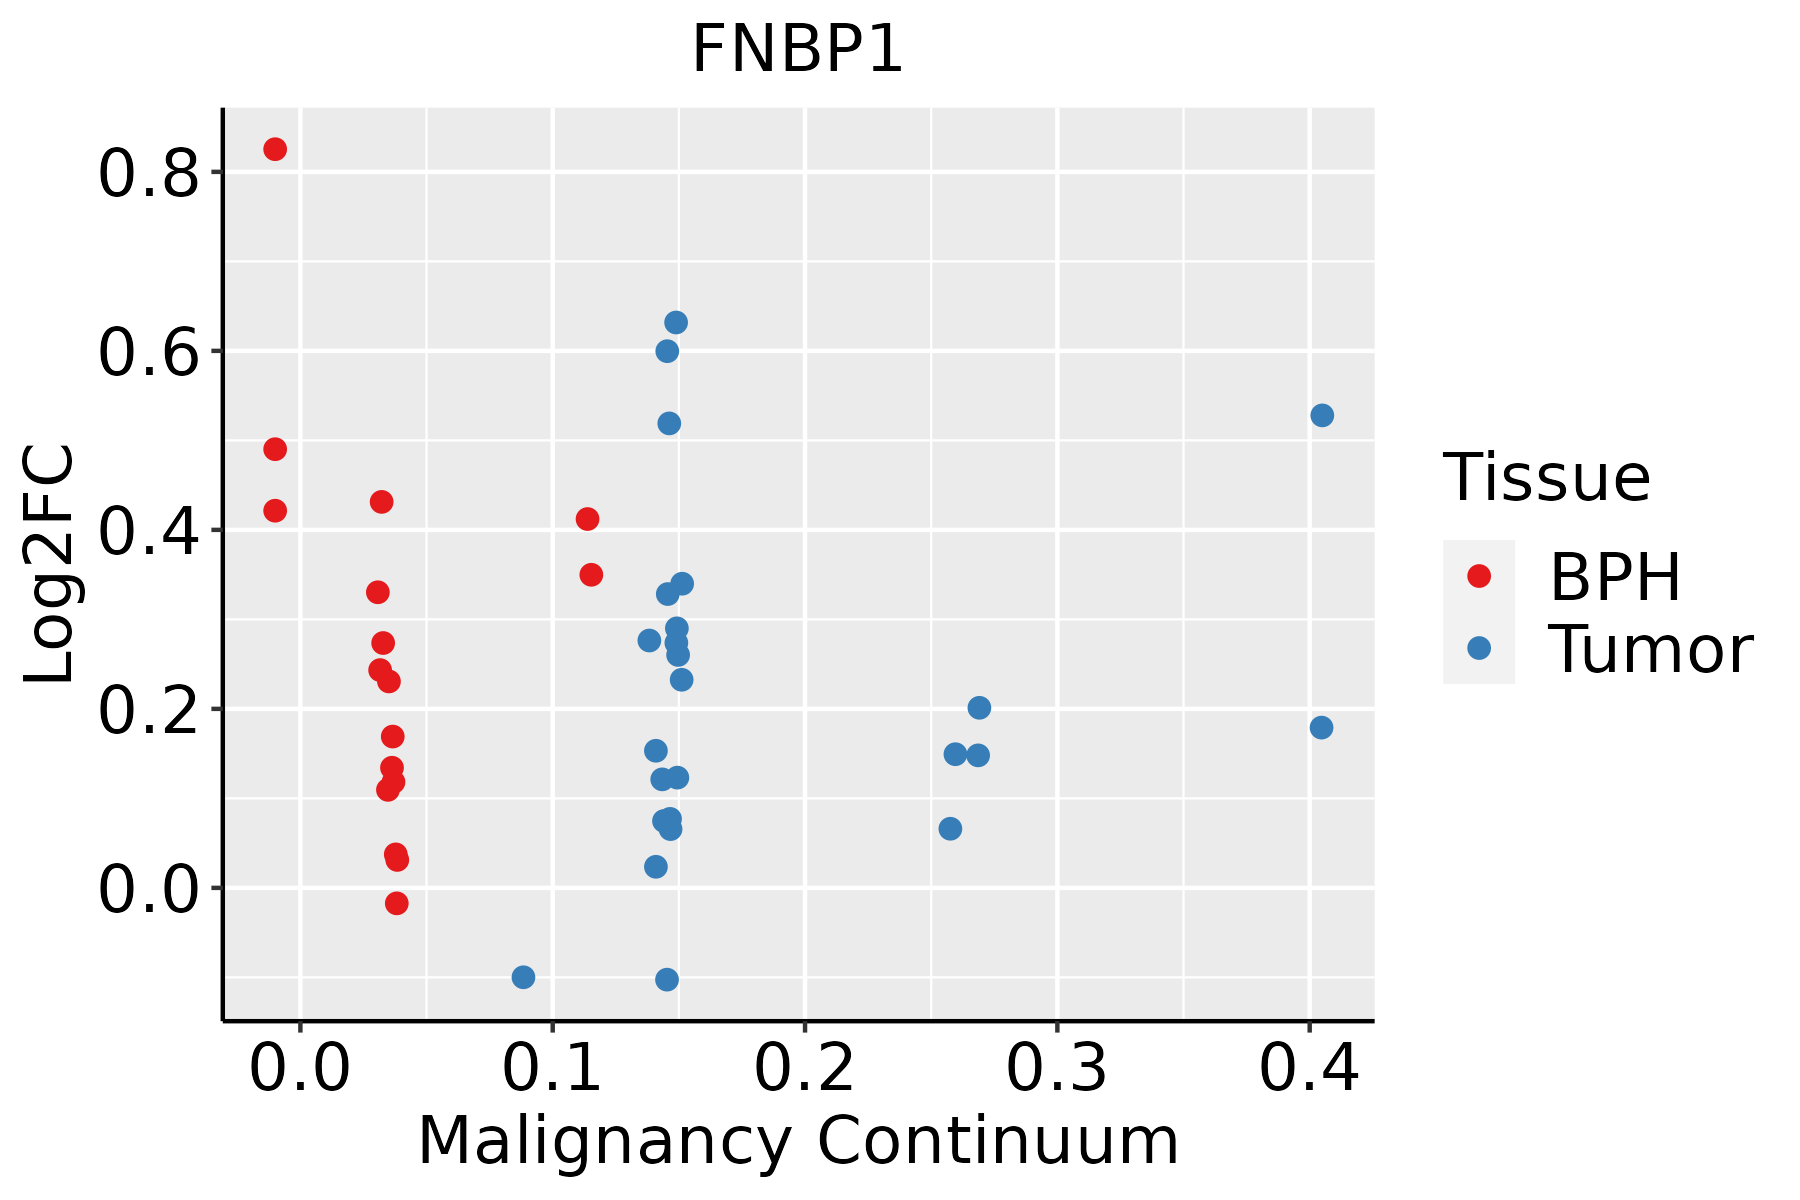 | BPH: Benign Prostatic Hyperplasia |
| Thyroid |  | ATC: Anaplastic thyroid cancer |
| HT: Hashimoto's thyroiditis | ||
| PTC: Papillary thyroid cancer |
| ∗log2FC in expression of this searched gene in stem-like cells from each diseased tissue sample relative to stem-like cells in normal samples in each tissue plotted against the malignancy continuum. Samples are colored based on if they are from different disease stage. |
Top |
Malignant transformation related pathway analysis |
| Find out the enriched GO biological processes and KEGG pathways involved in transition from healthy to precancer to cancer |
| Tissue | Disease Stage | Enriched GO biological Processes |
| Colorectum | AD |  |
| Colorectum | SER |  |
| Colorectum | MSS |  |
| Colorectum | MSI-H |  |
| Colorectum | FAP |  |
| ∗Top 15 enriched GO BP terms are showed in the bar plot of each disease state in each tissue. Each row represents a significant GO biological process which is colored according to the -log10(p.adjust). |
| Page: 1 2 3 4 5 6 7 8 9 |
| GO ID | Tissue | Disease Stage | Description | Gene Ratio | Bg Ratio | pvalue | p.adjust | Count |
| GO:0120032111 | Thyroid | PTC | regulation of plasma membrane bounded cell projection assembly | 92/5968 | 186/18723 | 4.12e-07 | 6.83e-06 | 92 |
| GO:006049120 | Thyroid | PTC | regulation of cell projection assembly | 92/5968 | 188/18723 | 7.55e-07 | 1.18e-05 | 92 |
| GO:01200349 | Thyroid | PTC | positive regulation of plasma membrane bounded cell projection assembly | 57/5968 | 105/18723 | 1.60e-06 | 2.25e-05 | 57 |
| GO:0006898110 | Thyroid | PTC | receptor-mediated endocytosis | 112/5968 | 244/18723 | 2.87e-06 | 3.74e-05 | 112 |
| GO:007258310 | Thyroid | PTC | clathrin-dependent endocytosis | 30/5968 | 47/18723 | 6.62e-06 | 7.83e-05 | 30 |
| GO:00995187 | Thyroid | PTC | vesicle cytoskeletal trafficking | 38/5968 | 73/18723 | 2.69e-04 | 1.91e-03 | 38 |
| GO:00514891 | Thyroid | PTC | regulation of filopodium assembly | 26/5968 | 47/18723 | 7.38e-04 | 4.59e-03 | 26 |
| GO:009951517 | Thyroid | PTC | actin filament-based transport | 14/5968 | 21/18723 | 1.11e-03 | 6.51e-03 | 14 |
| GO:0051491 | Thyroid | PTC | positive regulation of filopodium assembly | 18/5968 | 30/18723 | 1.38e-03 | 7.74e-03 | 18 |
| GO:004684711 | Thyroid | PTC | filopodium assembly | 31/5968 | 62/18723 | 2.23e-03 | 1.18e-02 | 31 |
| GO:00973202 | Thyroid | PTC | plasma membrane tubulation | 13/5968 | 20/18723 | 2.37e-03 | 1.24e-02 | 13 |
| GO:003005010 | Thyroid | PTC | vesicle transport along actin filament | 12/5968 | 19/18723 | 4.93e-03 | 2.29e-02 | 12 |
| GO:005165625 | Thyroid | ATC | establishment of organelle localization | 206/6293 | 390/18723 | 2.62e-15 | 1.84e-13 | 206 |
| GO:001605023 | Thyroid | ATC | vesicle organization | 166/6293 | 300/18723 | 6.14e-15 | 3.92e-13 | 166 |
| GO:003134623 | Thyroid | ATC | positive regulation of cell projection organization | 186/6293 | 353/18723 | 7.99e-14 | 4.23e-12 | 186 |
| GO:003070532 | Thyroid | ATC | cytoskeleton-dependent intracellular transport | 105/6293 | 195/18723 | 4.31e-09 | 9.70e-08 | 105 |
| GO:000690027 | Thyroid | ATC | vesicle budding from membrane | 42/6293 | 61/18723 | 1.94e-08 | 3.84e-07 | 42 |
| GO:0051650110 | Thyroid | ATC | establishment of vesicle localization | 87/6293 | 161/18723 | 7.16e-08 | 1.25e-06 | 87 |
| GO:012003414 | Thyroid | ATC | positive regulation of plasma membrane bounded cell projection assembly | 60/6293 | 105/18723 | 6.10e-07 | 8.47e-06 | 60 |
| GO:012003223 | Thyroid | ATC | regulation of plasma membrane bounded cell projection assembly | 95/6293 | 186/18723 | 6.13e-07 | 8.49e-06 | 95 |
| Page: 1 2 3 4 5 6 7 8 9 10 11 12 13 14 15 16 |
| Pathway ID | Tissue | Disease Stage | Description | Gene Ratio | Bg Ratio | pvalue | p.adjust | qvalue | Count |
| hsa05131 | Colorectum | AD | Shigellosis | 109/2092 | 247/8465 | 1.09e-11 | 2.44e-10 | 1.55e-10 | 109 |
| hsa051311 | Colorectum | AD | Shigellosis | 109/2092 | 247/8465 | 1.09e-11 | 2.44e-10 | 1.55e-10 | 109 |
| hsa051314 | Colorectum | MSS | Shigellosis | 94/1875 | 247/8465 | 6.82e-09 | 1.34e-07 | 8.23e-08 | 94 |
| hsa051315 | Colorectum | MSS | Shigellosis | 94/1875 | 247/8465 | 6.82e-09 | 1.34e-07 | 8.23e-08 | 94 |
| hsa051318 | Colorectum | FAP | Shigellosis | 76/1404 | 247/8465 | 1.57e-08 | 5.84e-07 | 3.55e-07 | 76 |
| hsa051319 | Colorectum | FAP | Shigellosis | 76/1404 | 247/8465 | 1.57e-08 | 5.84e-07 | 3.55e-07 | 76 |
| hsa0513110 | Colorectum | CRC | Shigellosis | 59/1091 | 247/8465 | 1.19e-06 | 5.41e-05 | 3.66e-05 | 59 |
| hsa0513111 | Colorectum | CRC | Shigellosis | 59/1091 | 247/8465 | 1.19e-06 | 5.41e-05 | 3.66e-05 | 59 |
| hsa0513126 | Endometrium | AEH | Shigellosis | 78/1197 | 247/8465 | 9.23e-13 | 2.00e-11 | 1.46e-11 | 78 |
| hsa05131111 | Endometrium | AEH | Shigellosis | 78/1197 | 247/8465 | 9.23e-13 | 2.00e-11 | 1.46e-11 | 78 |
| hsa0513127 | Endometrium | EEC | Shigellosis | 79/1237 | 247/8465 | 1.80e-12 | 3.95e-11 | 2.95e-11 | 79 |
| hsa0513136 | Endometrium | EEC | Shigellosis | 79/1237 | 247/8465 | 1.80e-12 | 3.95e-11 | 2.95e-11 | 79 |
| hsa05131211 | Esophagus | ESCC | Shigellosis | 176/4205 | 247/8465 | 2.27e-12 | 4.01e-11 | 2.05e-11 | 176 |
| hsa05131310 | Esophagus | ESCC | Shigellosis | 176/4205 | 247/8465 | 2.27e-12 | 4.01e-11 | 2.05e-11 | 176 |
| hsa0513114 | Liver | NAFLD | Shigellosis | 48/1043 | 247/8465 | 7.82e-04 | 1.17e-02 | 9.39e-03 | 48 |
| hsa0513115 | Liver | NAFLD | Shigellosis | 48/1043 | 247/8465 | 7.82e-04 | 1.17e-02 | 9.39e-03 | 48 |
| hsa0513142 | Liver | HCC | Shigellosis | 150/4020 | 247/8465 | 1.53e-05 | 1.04e-04 | 5.81e-05 | 150 |
| hsa0513152 | Liver | HCC | Shigellosis | 150/4020 | 247/8465 | 1.53e-05 | 1.04e-04 | 5.81e-05 | 150 |
| hsa0513116 | Lung | IAC | Shigellosis | 58/1053 | 247/8465 | 8.21e-07 | 3.81e-05 | 2.53e-05 | 58 |
| hsa0513117 | Lung | IAC | Shigellosis | 58/1053 | 247/8465 | 8.21e-07 | 3.81e-05 | 2.53e-05 | 58 |
| Page: 1 2 |
Top |
Cell-cell communication analysis |
| Identification of potential cell-cell interactions between two cell types and their ligand-receptor pairs for different disease states |
| Ligand | Receptor | LRpair | Pathway | Tissue | Disease Stage |
| Page: 1 |
Top |
Single-cell gene regulatory network inference analysis |
| Find out the significant the regulons (TFs) and the target genes of each regulon across cell types for different disease states |
| TF | Cell Type | Tissue | Disease Stage | Target Gene | RSS | Regulon Activity |
| ∗The dot plots of a searched regulon are shown for all cell subpopulations in each disease state of each tissue based on the regulon specific score inferred using pySCENIC and by calculating the average expression. |
| Page: 1 |
Top |
Somatic mutation of malignant transformation related genes |
| Annotation of somatic variants for genes involved in malignant transformation |
| Hugo Symbol | Variant Class | Variant Classification | dbSNP RS | HGVSc | HGVSp | HGVSp Short | SWISSPROT | BIOTYPE | SIFT | PolyPhen | Tumor Sample Barcode | Tissue | Histology | Sex | Age | Stage | Therapy Types | Drugs | Outcome |
| FNBP1 | SNV | Missense_Mutation | c.1411G>A | p.Glu471Lys | p.E471K | Q96RU3 | protein_coding | deleterious(0) | possibly_damaging(0.857) | TCGA-GM-A2D9-01 | Breast | breast invasive carcinoma | Female | >=65 | I/II | Hormone Therapy | arimidex | SD | |
| FNBP1 | insertion | Nonsense_Mutation | novel | c.418_419insAGGAGAATCGCTTGAGCACAGGAGGCGTTGGCTGCAGTGAGCCAAGAT | p.Arg140delinsGlnGluAsnArgLeuSerThrGlyGlyValGlyCysSerGluProArgTer | p.R140delinsQENRLSTGGVGCSEPR* | Q96RU3 | protein_coding | TCGA-A8-A07R-01 | Breast | breast invasive carcinoma | Female | >=65 | III/IV | Ancillary | zoledronic | SD | ||
| FNBP1 | insertion | In_Frame_Ins | novel | c.29_30insTCTTTTAATGATGAG | p.Gln10delinsHisLeuLeuMetMetArg | p.Q10delinsHLLMMR | Q96RU3 | protein_coding | TCGA-AN-A0FX-01 | Breast | breast invasive carcinoma | Female | <65 | I/II | Unknown | Unknown | SD | ||
| FNBP1 | insertion | Nonsense_Mutation | novel | c.27_28insTAAGTACTTTGGATCTCCTTA | p.Asp9_Gln10insTer | p.D9_Q10ins* | Q96RU3 | protein_coding | TCGA-AN-A0FX-01 | Breast | breast invasive carcinoma | Female | <65 | I/II | Unknown | Unknown | SD | ||
| FNBP1 | insertion | Nonsense_Mutation | novel | c.804_805insCCATGTTAATAACTTGGTTTTGAATTCATGTTAACAT | p.Ile269ProfsTer3 | p.I269Pfs*3 | Q96RU3 | protein_coding | TCGA-BH-A0HF-01 | Breast | breast invasive carcinoma | Female | >=65 | I/II | Hormone Therapy | arimidex | SD | ||
| FNBP1 | SNV | Missense_Mutation | c.1754N>A | p.Gly585Asp | p.G585D | Q96RU3 | protein_coding | deleterious(0) | probably_damaging(0.999) | TCGA-EK-A2RC-01 | Cervix | cervical & endocervical cancer | Female | <65 | I/II | Unknown | Unknown | SD | |
| FNBP1 | SNV | Missense_Mutation | c.1411N>C | p.Glu471Gln | p.E471Q | Q96RU3 | protein_coding | deleterious(0) | probably_damaging(0.953) | TCGA-EK-A3GK-01 | Cervix | cervical & endocervical cancer | Female | <65 | I/II | Unknown | Unknown | SD | |
| FNBP1 | SNV | Missense_Mutation | c.835N>G | p.Pro279Ala | p.P279A | Q96RU3 | protein_coding | deleterious(0) | probably_damaging(0.98) | TCGA-IR-A3LH-01 | Cervix | cervical & endocervical cancer | Female | <65 | I/II | Chemotherapy | cisplatin | CR | |
| FNBP1 | SNV | Missense_Mutation | rs764532868 | c.1447N>A | p.Glu483Lys | p.E483K | Q96RU3 | protein_coding | tolerated(0.08) | benign(0.04) | TCGA-VS-A958-01 | Cervix | cervical & endocervical cancer | Female | <65 | I/II | Chemotherapy | cisplatin | CR |
| FNBP1 | SNV | Missense_Mutation | rs374562503 | c.1775G>A | p.Arg592Gln | p.R592Q | Q96RU3 | protein_coding | deleterious(0.04) | probably_damaging(0.986) | TCGA-A6-6654-01 | Colorectum | colon adenocarcinoma | Female | >=65 | III/IV | Chemotherapy | oxaliplatin | SD |
| Page: 1 2 3 4 5 6 7 8 |
Top |
Related drugs of malignant transformation related genes |
| Identification of chemicals and drugs interact with genes involved in malignant transfromation |
| (DGIdb 4.0) |
| Entrez ID | Symbol | Category | Interaction Types | Drug Claim Name | Drug Name | PMIDs |
| Page: 1 |

Copyright 2023-Present -The University of Texas Health Science Center at Houston |