
|
|||||
|
 | |
| |
| |
| |
| |
| |
|
Gene: ERBIN |
Gene summary for ERBIN |
| Gene information | Species | Human | Gene symbol | ERBIN | Gene ID | 55914 |
| Gene name | erbb2 interacting protein | |
| Gene Alias | ERBB2IP | |
| Cytomap | 5q12.3 | |
| Gene Type | protein-coding | GO ID | GO:0001816 | UniProtAcc | Q96RT1 |
Top |
Malignant transformation analysis |
| Identification of the aberrant gene expression in precancerous and cancerous lesions by comparing the gene expression of stem-like cells in diseased tissues with normal stem cells |
| Entrez ID | Symbol | Replicates | Species | Organ | Tissue | Adj P-value | Log2FC | Malignancy |
| 55914 | ERBIN | CA_HPV_1 | Human | Cervix | CC | 1.10e-02 | -2.44e-02 | 0.0264 |
| 55914 | ERBIN | CCI_2 | Human | Cervix | CC | 3.52e-08 | 1.46e+00 | 0.5249 |
| 55914 | ERBIN | CCI_3 | Human | Cervix | CC | 2.46e-14 | 1.14e+00 | 0.516 |
| 55914 | ERBIN | Tumor | Human | Cervix | CC | 8.66e-18 | -3.26e-01 | 0.1241 |
| 55914 | ERBIN | H2 | Human | Cervix | HSIL_HPV | 1.03e-03 | 2.84e-01 | 0.0632 |
| 55914 | ERBIN | HTA11_3410_2000001011 | Human | Colorectum | AD | 6.75e-19 | -6.66e-01 | 0.0155 |
| 55914 | ERBIN | HTA11_3361_2000001011 | Human | Colorectum | AD | 4.55e-04 | -4.52e-01 | -0.1207 |
| 55914 | ERBIN | HTA11_866_3004761011 | Human | Colorectum | AD | 3.84e-13 | -5.83e-01 | 0.096 |
| 55914 | ERBIN | HTA11_4255_2000001011 | Human | Colorectum | SER | 4.42e-02 | -5.45e-01 | 0.0446 |
| 55914 | ERBIN | HTA11_8622_2000001021 | Human | Colorectum | SER | 2.36e-03 | -7.03e-01 | 0.0528 |
| 55914 | ERBIN | HTA11_7696_3000711011 | Human | Colorectum | AD | 7.59e-06 | -4.10e-01 | 0.0674 |
| 55914 | ERBIN | HTA11_6818_2000001011 | Human | Colorectum | AD | 3.58e-04 | -5.99e-01 | 0.0112 |
| 55914 | ERBIN | HTA11_6818_2000001021 | Human | Colorectum | AD | 7.85e-08 | -7.13e-01 | 0.0588 |
| 55914 | ERBIN | HTA11_99999970781_79442 | Human | Colorectum | MSS | 9.55e-11 | -3.87e-01 | 0.294 |
| 55914 | ERBIN | HTA11_99999973899_84307 | Human | Colorectum | MSS | 1.26e-02 | -5.73e-01 | 0.2585 |
| 55914 | ERBIN | HTA11_99999974143_84620 | Human | Colorectum | MSS | 6.63e-17 | -5.64e-01 | 0.3005 |
| 55914 | ERBIN | A001-C-207 | Human | Colorectum | FAP | 1.26e-03 | -1.66e-01 | 0.1278 |
| 55914 | ERBIN | A015-C-203 | Human | Colorectum | FAP | 1.76e-32 | -4.22e-01 | -0.1294 |
| 55914 | ERBIN | A015-C-204 | Human | Colorectum | FAP | 2.07e-05 | -2.31e-01 | -0.0228 |
| 55914 | ERBIN | A014-C-040 | Human | Colorectum | FAP | 1.77e-03 | -2.65e-01 | -0.1184 |
| Page: 1 2 3 4 5 6 7 8 |
| Tissue | Expression Dynamics | Abbreviation |
| Cervix | 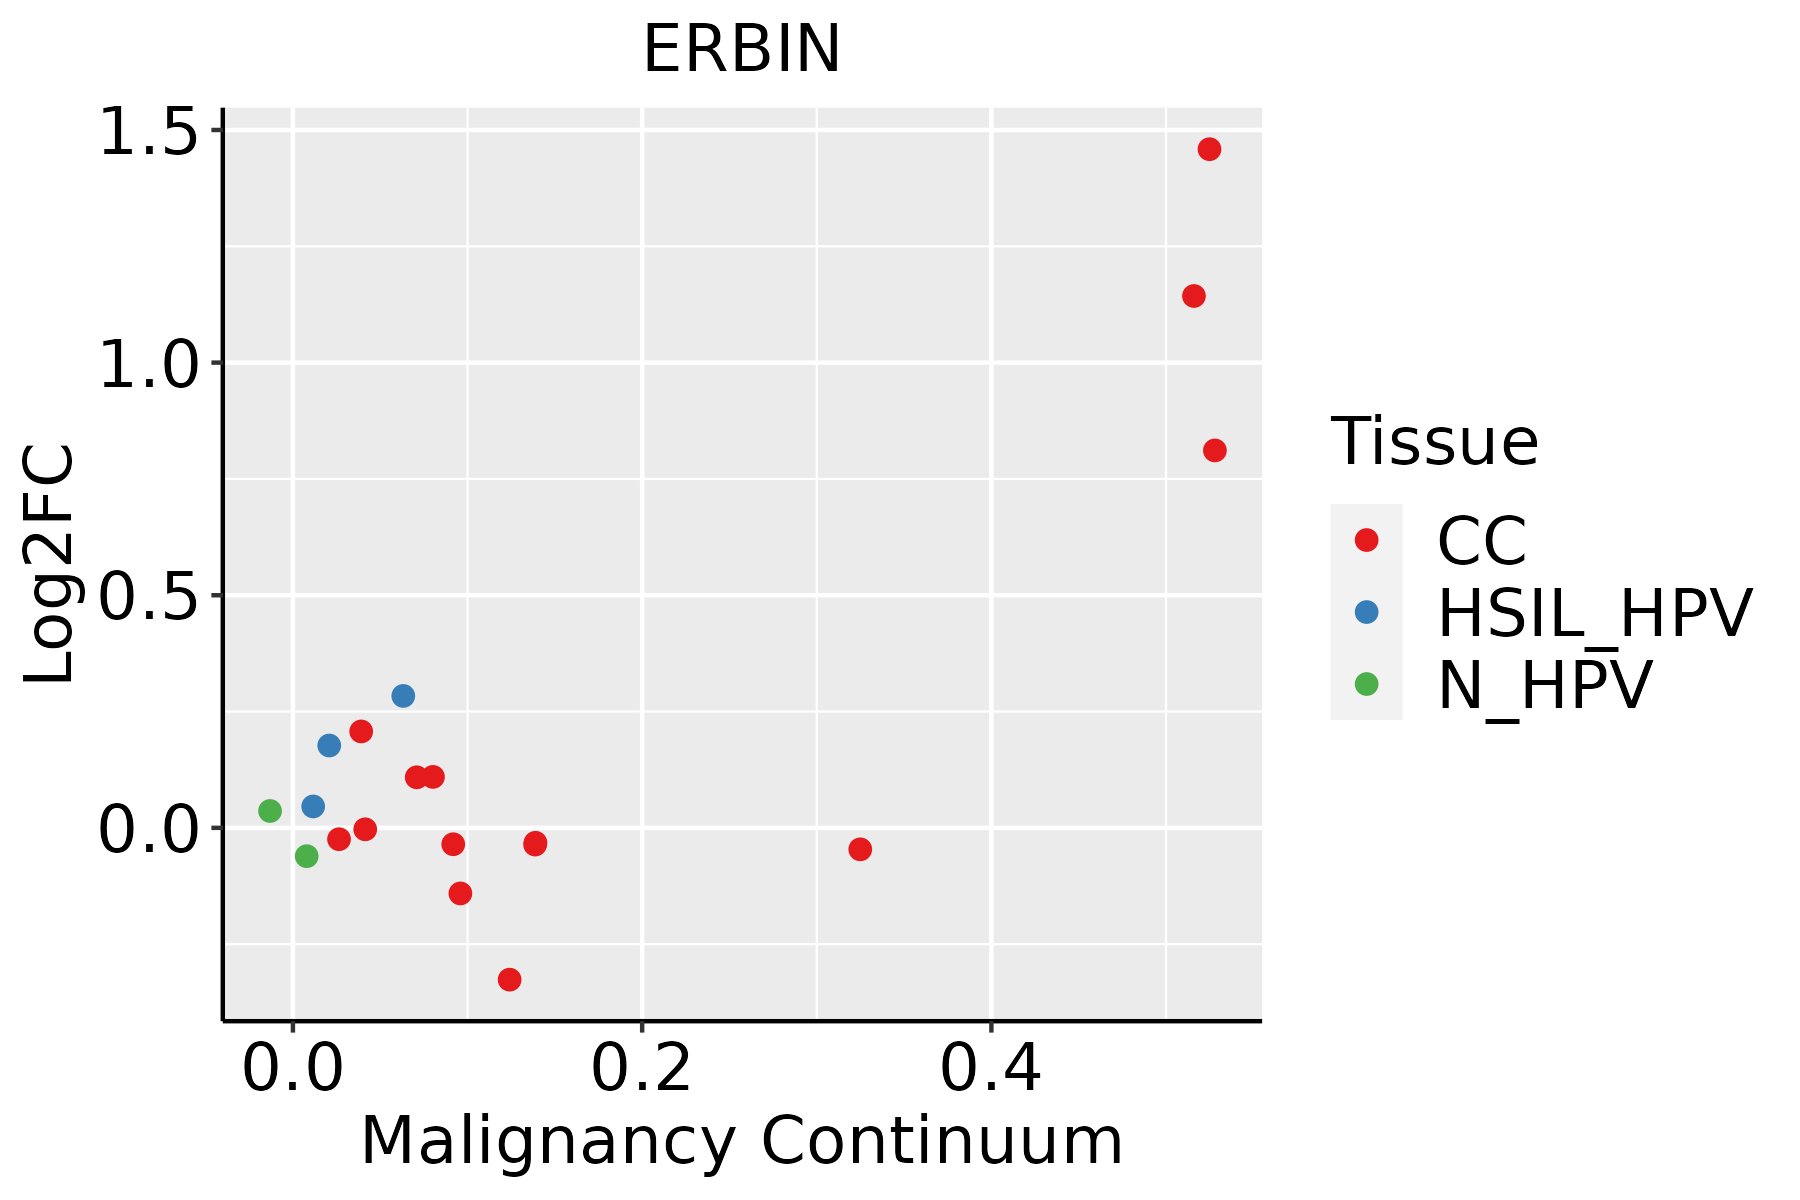 | CC: Cervix cancer |
| HSIL_HPV: HPV-infected high-grade squamous intraepithelial lesions | ||
| N_HPV: HPV-infected normal cervix | ||
| Colorectum (GSE201348) |  | FAP: Familial adenomatous polyposis |
| CRC: Colorectal cancer | ||
| Colorectum (HTA11) |  | AD: Adenomas |
| SER: Sessile serrated lesions | ||
| MSI-H: Microsatellite-high colorectal cancer | ||
| MSS: Microsatellite stable colorectal cancer | ||
| Endometrium | 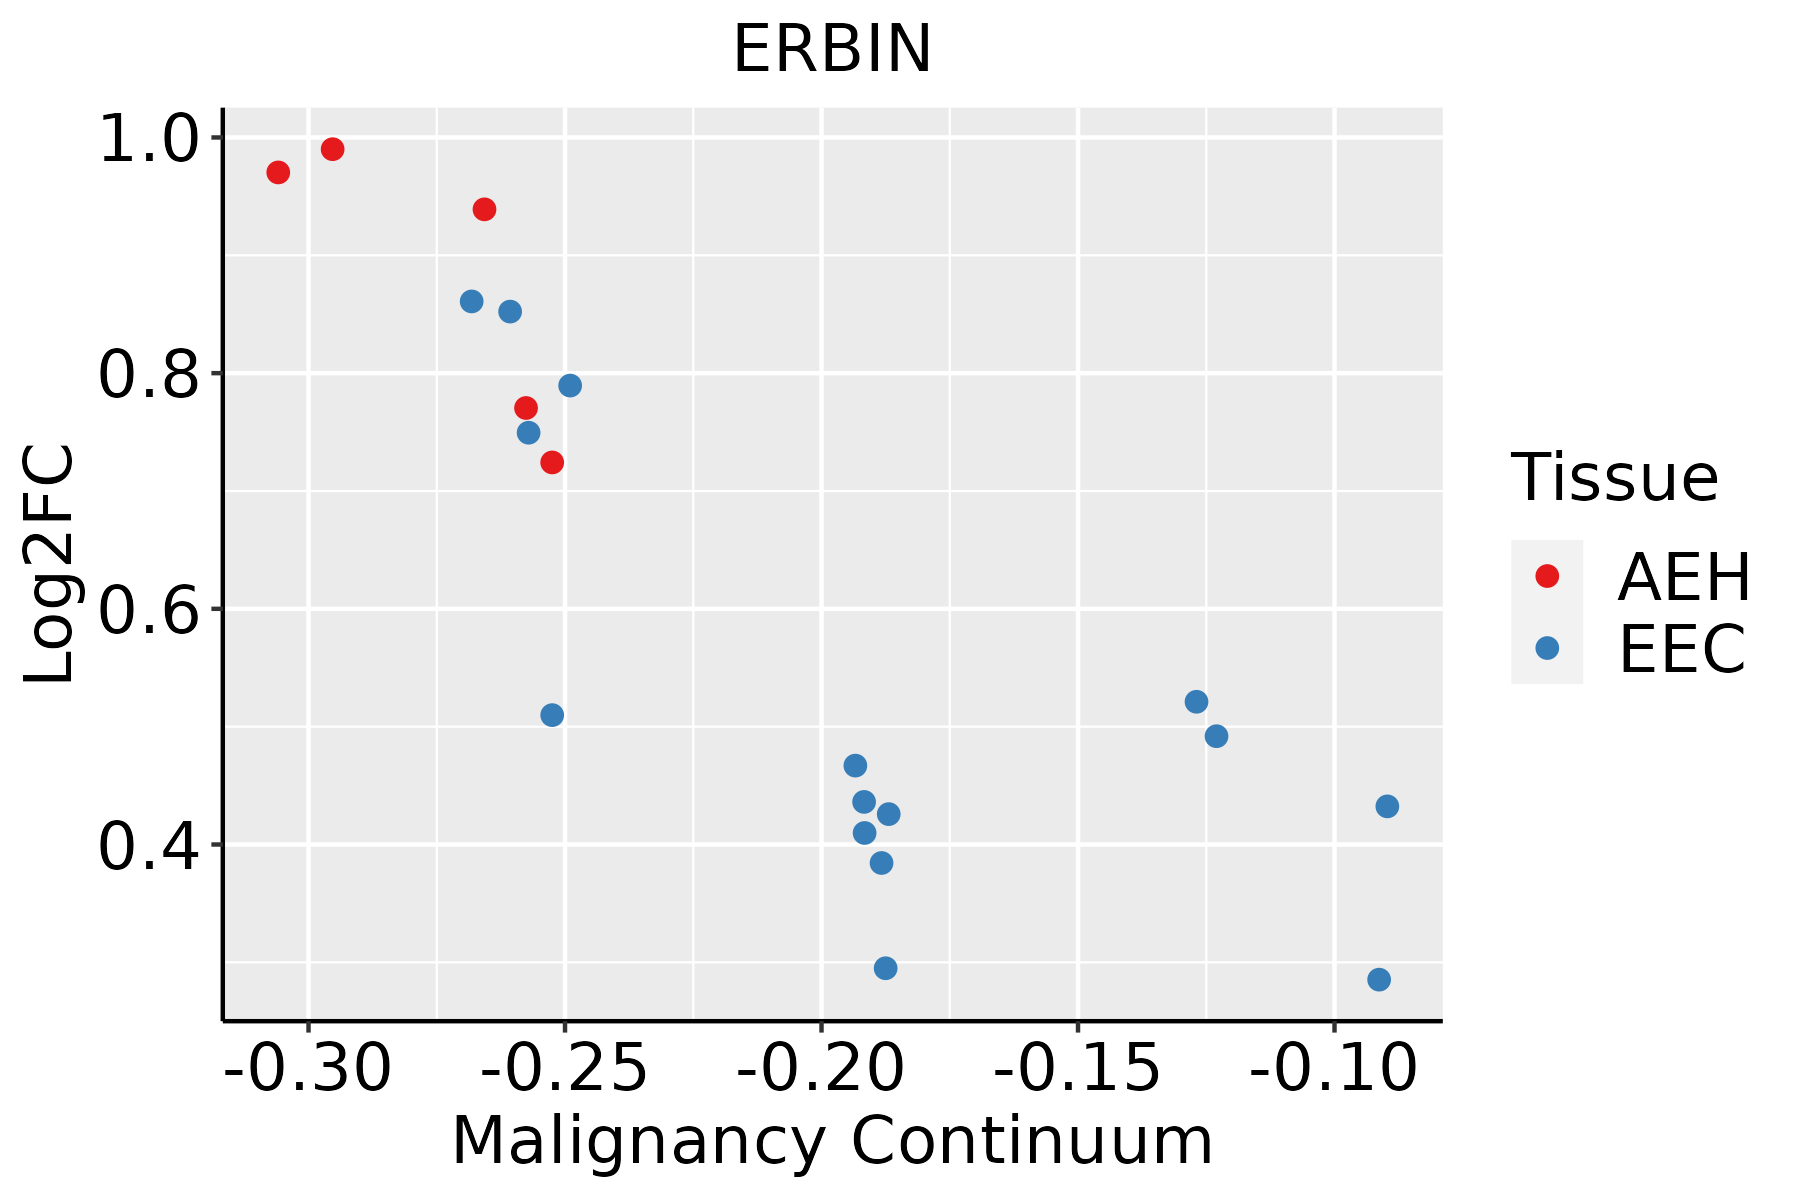 | AEH: Atypical endometrial hyperplasia |
| EEC: Endometrioid Cancer | ||
| Liver |  | HCC: Hepatocellular carcinoma |
| NAFLD: Non-alcoholic fatty liver disease | ||
| Lung |  | AAH: Atypical adenomatous hyperplasia |
| AIS: Adenocarcinoma in situ | ||
| IAC: Invasive lung adenocarcinoma | ||
| MIA: Minimally invasive adenocarcinoma | ||
| Oral Cavity |  | EOLP: Erosive Oral lichen planus |
| LP: leukoplakia | ||
| NEOLP: Non-erosive oral lichen planus | ||
| OSCC: Oral squamous cell carcinoma | ||
| Prostate | 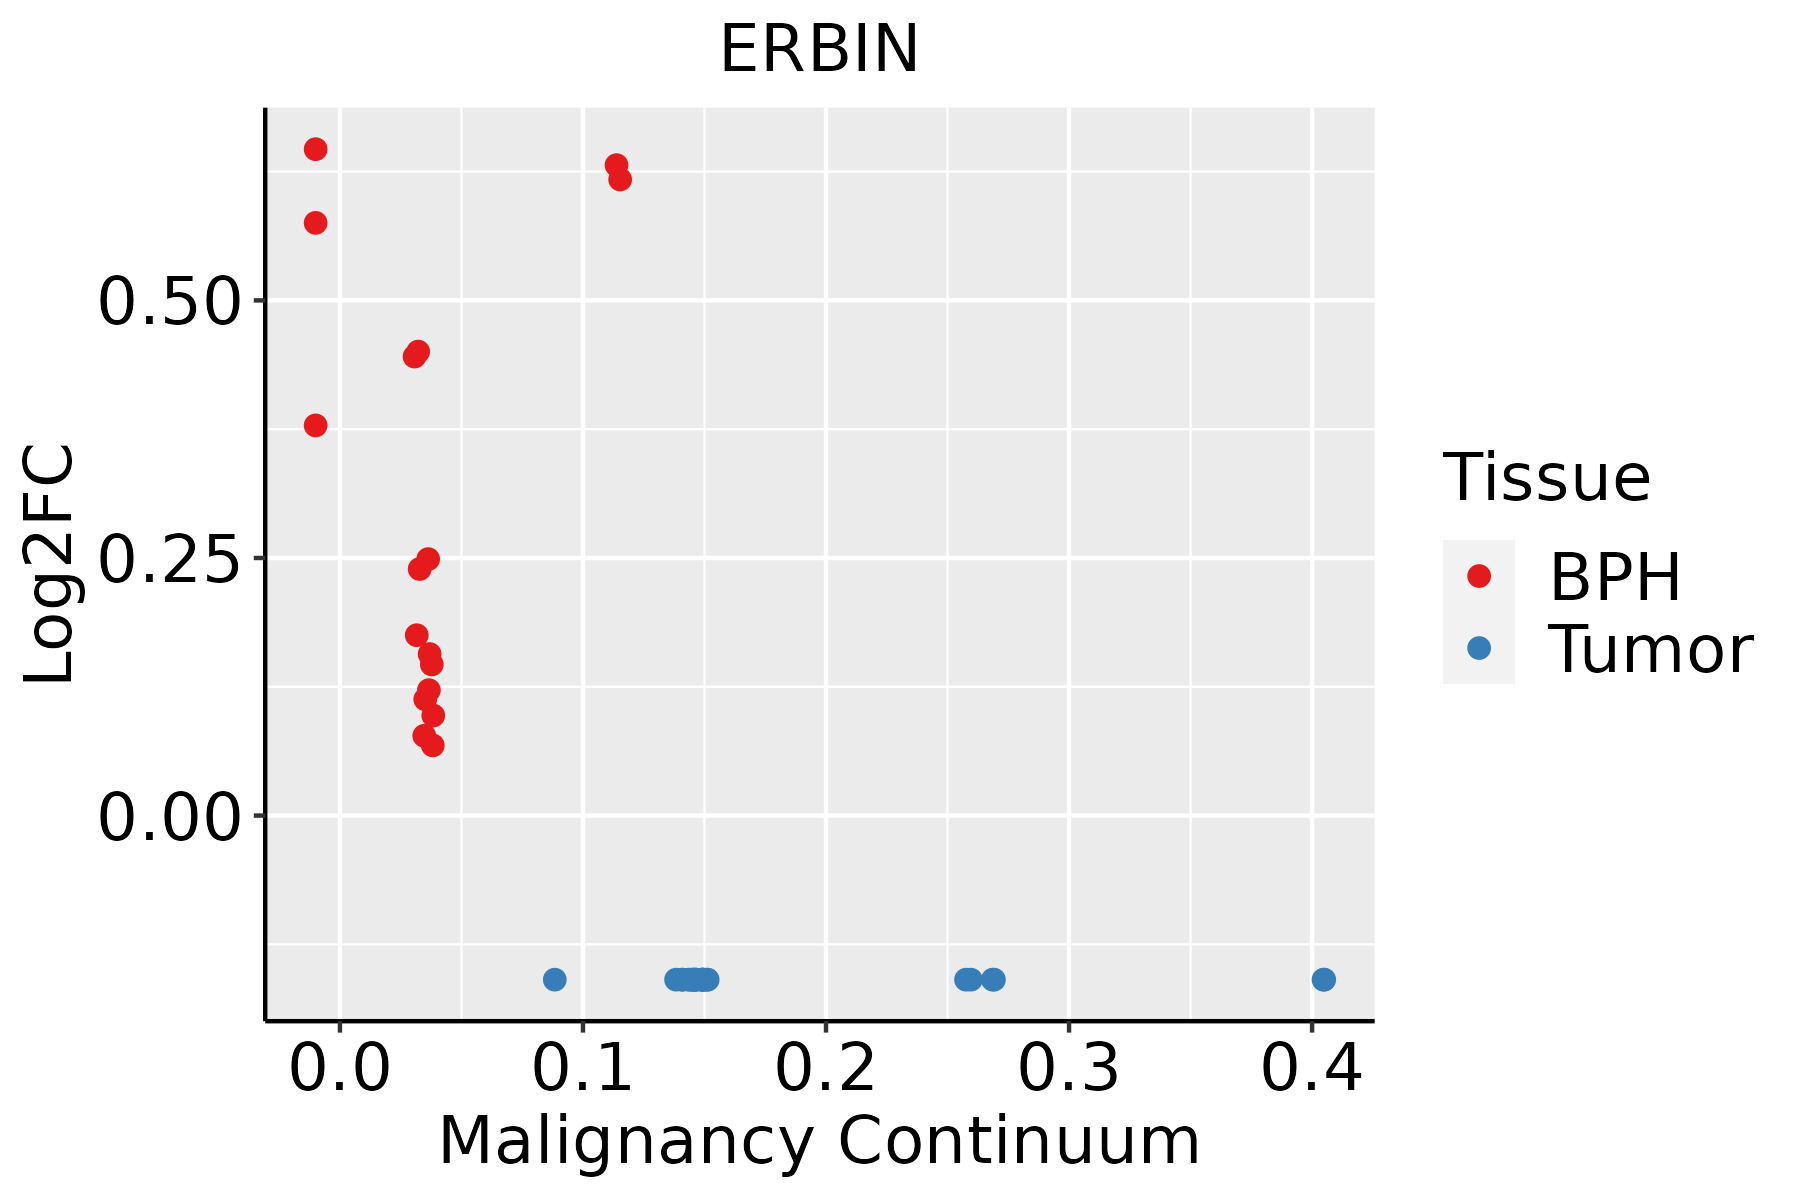 | BPH: Benign Prostatic Hyperplasia |
| Skin | 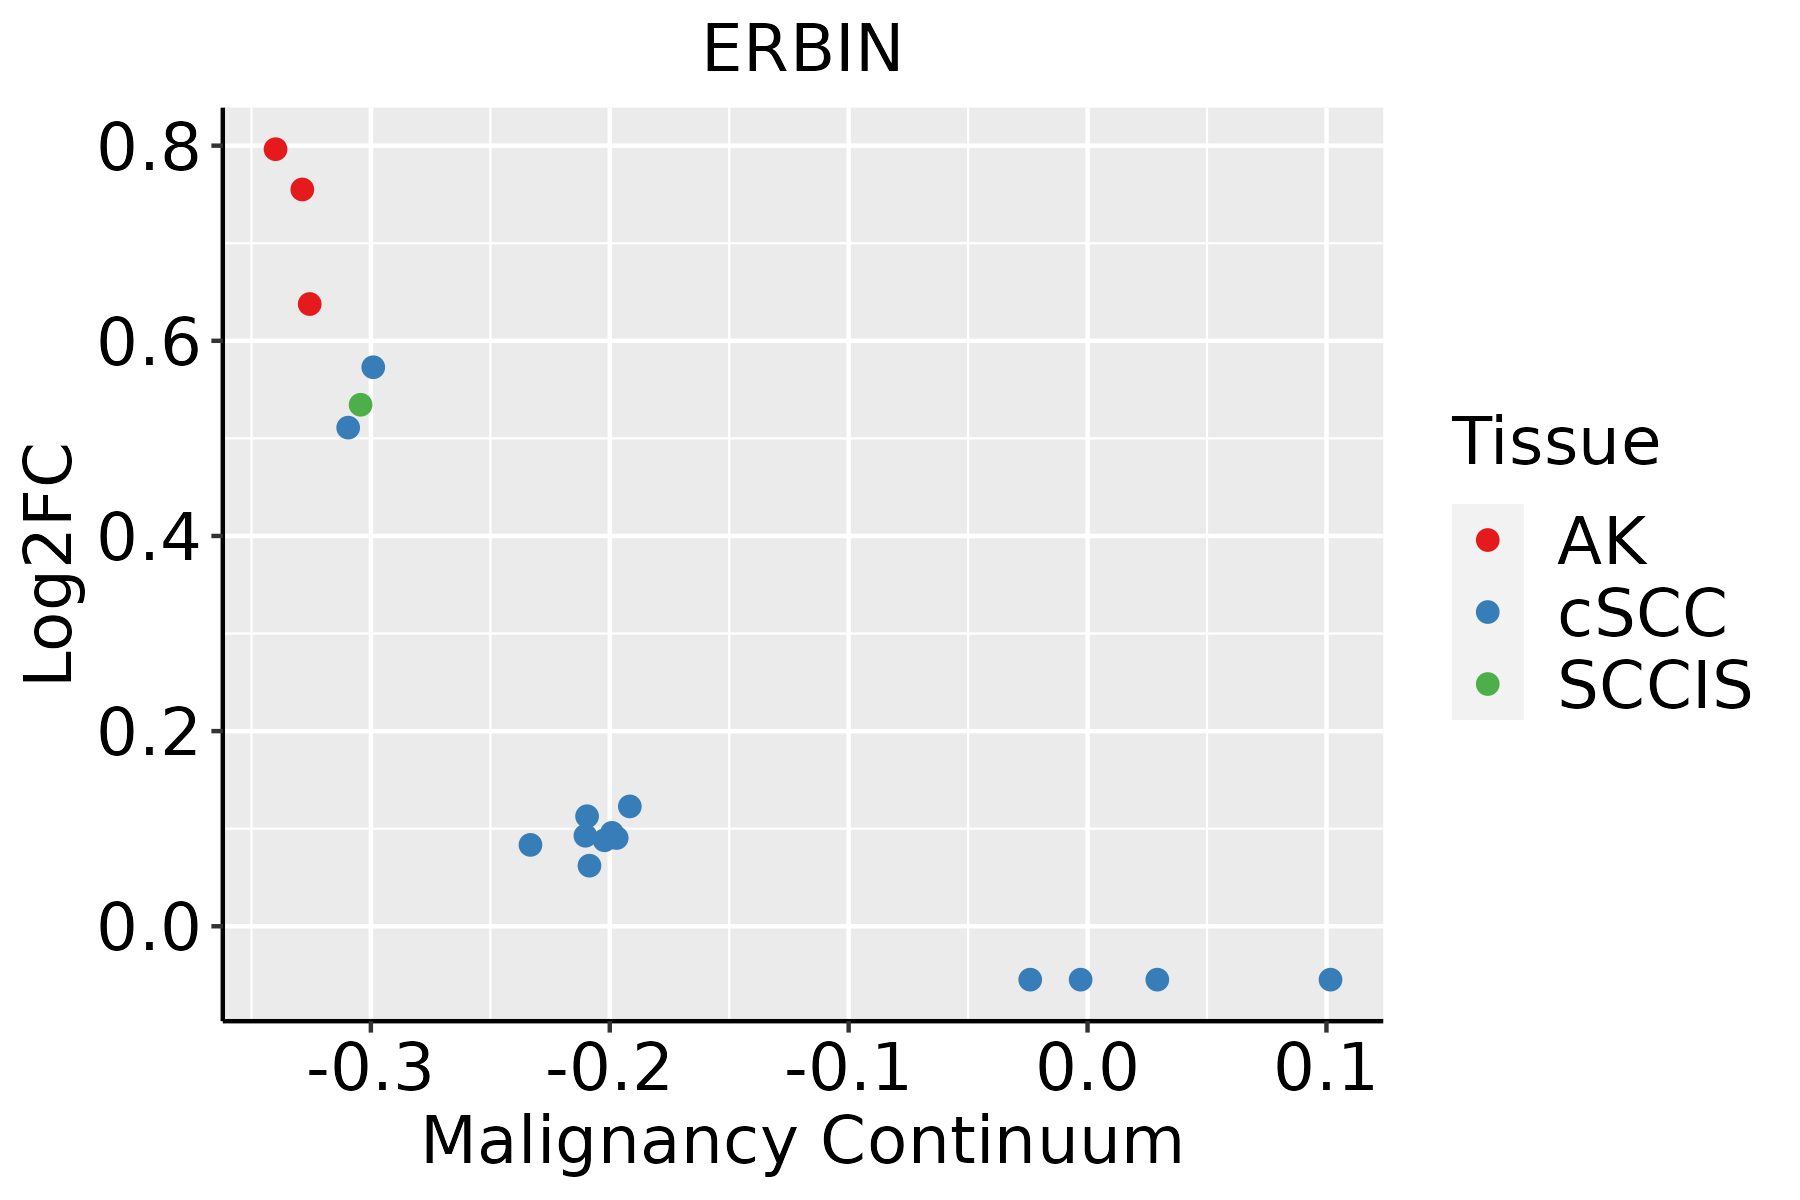 | AK: Actinic keratosis |
| cSCC: Cutaneous squamous cell carcinoma | ||
| SCCIS:squamous cell carcinoma in situ | ||
| Thyroid |  | ATC: Anaplastic thyroid cancer |
| HT: Hashimoto's thyroiditis | ||
| PTC: Papillary thyroid cancer |
| ∗log2FC in expression of this searched gene in stem-like cells from each diseased tissue sample relative to stem-like cells in normal samples in each tissue plotted against the malignancy continuum. Samples are colored based on if they are from different disease stage. |
Top |
Malignant transformation related pathway analysis |
| Find out the enriched GO biological processes and KEGG pathways involved in transition from healthy to precancer to cancer |
| Tissue | Disease Stage | Enriched GO biological Processes |
| Colorectum | AD |  |
| Colorectum | SER |  |
| Colorectum | MSS |  |
| Colorectum | MSI-H |  |
| Colorectum | FAP |  |
| ∗Top 15 enriched GO BP terms are showed in the bar plot of each disease state in each tissue. Each row represents a significant GO biological process which is colored according to the -log10(p.adjust). |
| Page: 1 2 3 4 5 6 7 8 9 |
| GO ID | Tissue | Disease Stage | Description | Gene Ratio | Bg Ratio | pvalue | p.adjust | Count |
| GO:00510569 | Oral cavity | EOLP | regulation of small GTPase mediated signal transduction | 51/2218 | 302/18723 | 5.67e-03 | 2.92e-02 | 51 |
| GO:003052231 | Oral cavity | NEOLP | intracellular receptor signaling pathway | 61/2005 | 265/18723 | 5.22e-09 | 2.87e-07 | 61 |
| GO:000716333 | Oral cavity | NEOLP | establishment or maintenance of cell polarity | 53/2005 | 218/18723 | 7.21e-09 | 3.82e-07 | 53 |
| GO:000726531 | Oral cavity | NEOLP | Ras protein signal transduction | 71/2005 | 337/18723 | 1.60e-08 | 7.27e-07 | 71 |
| GO:003461231 | Oral cavity | NEOLP | response to tumor necrosis factor | 55/2005 | 253/18723 | 2.23e-07 | 7.28e-06 | 55 |
| GO:007135631 | Oral cavity | NEOLP | cellular response to tumor necrosis factor | 50/2005 | 229/18723 | 6.79e-07 | 1.93e-05 | 50 |
| GO:000722931 | Oral cavity | NEOLP | integrin-mediated signaling pathway | 29/2005 | 107/18723 | 1.72e-06 | 4.19e-05 | 29 |
| GO:003249631 | Oral cavity | NEOLP | response to lipopolysaccharide | 65/2005 | 343/18723 | 3.30e-06 | 7.40e-05 | 65 |
| GO:000223731 | Oral cavity | NEOLP | response to molecule of bacterial origin | 67/2005 | 363/18723 | 5.94e-06 | 1.20e-04 | 67 |
| GO:004510422 | Oral cavity | NEOLP | intermediate filament cytoskeleton organization | 17/2005 | 51/18723 | 1.25e-05 | 2.25e-04 | 17 |
| GO:004510322 | Oral cavity | NEOLP | intermediate filament-based process | 17/2005 | 52/18723 | 1.67e-05 | 2.83e-04 | 17 |
| GO:000222121 | Oral cavity | NEOLP | pattern recognition receptor signaling pathway | 35/2005 | 172/18723 | 1.38e-04 | 1.60e-03 | 35 |
| GO:007042322 | Oral cavity | NEOLP | nucleotide-binding oligomerization domain containing signaling pathway | 10/2005 | 25/18723 | 1.39e-04 | 1.61e-03 | 10 |
| GO:005109031 | Oral cavity | NEOLP | regulation of DNA-binding transcription factor activity | 72/2005 | 440/18723 | 1.66e-04 | 1.84e-03 | 72 |
| GO:003587221 | Oral cavity | NEOLP | nucleotide-binding domain, leucine rich repeat containing receptor signaling pathway | 10/2005 | 26/18723 | 2.04e-04 | 2.19e-03 | 10 |
| GO:000276422 | Oral cavity | NEOLP | immune response-regulating signaling pathway | 74/2005 | 468/18723 | 3.90e-04 | 3.63e-03 | 74 |
| GO:000275321 | Oral cavity | NEOLP | cytoplasmic pattern recognition receptor signaling pathway | 16/2005 | 60/18723 | 4.28e-04 | 3.91e-03 | 16 |
| GO:004657815 | Oral cavity | NEOLP | regulation of Ras protein signal transduction | 36/2005 | 189/18723 | 4.30e-04 | 3.92e-03 | 36 |
| GO:007043112 | Oral cavity | NEOLP | nucleotide-binding oligomerization domain containing 2 signaling pathway | 7/2005 | 16/18723 | 7.62e-04 | 6.16e-03 | 7 |
| GO:007042421 | Oral cavity | NEOLP | regulation of nucleotide-binding oligomerization domain containing signaling pathway | 6/2005 | 13/18723 | 1.32e-03 | 9.48e-03 | 6 |
| Page: 1 2 3 4 5 6 7 8 9 10 11 12 13 14 15 16 17 18 19 20 21 22 |
| Pathway ID | Tissue | Disease Stage | Description | Gene Ratio | Bg Ratio | pvalue | p.adjust | qvalue | Count |
| hsa046213 | Cervix | CC | NOD-like receptor signaling pathway | 41/1267 | 186/8465 | 5.90e-03 | 1.95e-02 | 1.15e-02 | 41 |
| hsa0462112 | Cervix | CC | NOD-like receptor signaling pathway | 41/1267 | 186/8465 | 5.90e-03 | 1.95e-02 | 1.15e-02 | 41 |
| hsa046212 | Lung | IAC | NOD-like receptor signaling pathway | 38/1053 | 186/8465 | 1.23e-03 | 8.24e-03 | 5.47e-03 | 38 |
| hsa0462111 | Lung | IAC | NOD-like receptor signaling pathway | 38/1053 | 186/8465 | 1.23e-03 | 8.24e-03 | 5.47e-03 | 38 |
| hsa046214 | Oral cavity | EOLP | NOD-like receptor signaling pathway | 48/1218 | 186/8465 | 2.51e-05 | 1.31e-04 | 7.70e-05 | 48 |
| hsa046215 | Oral cavity | EOLP | NOD-like receptor signaling pathway | 48/1218 | 186/8465 | 2.51e-05 | 1.31e-04 | 7.70e-05 | 48 |
| hsa046216 | Oral cavity | NEOLP | NOD-like receptor signaling pathway | 39/1112 | 186/8465 | 1.79e-03 | 7.91e-03 | 4.98e-03 | 39 |
| hsa046217 | Oral cavity | NEOLP | NOD-like receptor signaling pathway | 39/1112 | 186/8465 | 1.79e-03 | 7.91e-03 | 4.98e-03 | 39 |
| Page: 1 |
Top |
Cell-cell communication analysis |
| Identification of potential cell-cell interactions between two cell types and their ligand-receptor pairs for different disease states |
| Ligand | Receptor | LRpair | Pathway | Tissue | Disease Stage |
| Page: 1 |
Top |
Single-cell gene regulatory network inference analysis |
| Find out the significant the regulons (TFs) and the target genes of each regulon across cell types for different disease states |
| TF | Cell Type | Tissue | Disease Stage | Target Gene | RSS | Regulon Activity |
| ∗The dot plots of a searched regulon are shown for all cell subpopulations in each disease state of each tissue based on the regulon specific score inferred using pySCENIC and by calculating the average expression. |
| Page: 1 |
Top |
Somatic mutation of malignant transformation related genes |
| Annotation of somatic variants for genes involved in malignant transformation |
| Hugo Symbol | Variant Class | Variant Classification | dbSNP RS | HGVSc | HGVSp | HGVSp Short | SWISSPROT | BIOTYPE | SIFT | PolyPhen | Tumor Sample Barcode | Tissue | Histology | Sex | Age | Stage | Therapy Types | Drugs | Outcome |
| ERBIN | SNV | Missense_Mutation | novel | c.2410A>T | p.Thr804Ser | p.T804S | Q96RT1 | protein_coding | tolerated_low_confidence(0.67) | benign(0.007) | TCGA-A8-A06U-01 | Breast | breast invasive carcinoma | Female | >=65 | I/II | Unknown | Unknown | SD |
| ERBIN | SNV | Missense_Mutation | c.1396N>A | p.Glu466Lys | p.E466K | Q96RT1 | protein_coding | deleterious(0.01) | benign(0.186) | TCGA-A8-A09G-01 | Breast | breast invasive carcinoma | Female | >=65 | III/IV | Unknown | Unknown | SD | |
| ERBIN | SNV | Missense_Mutation | rs144581883 | c.3389N>A | p.Arg1130Gln | p.R1130Q | Q96RT1 | protein_coding | deleterious(0) | probably_damaging(0.996) | TCGA-AN-A046-01 | Breast | breast invasive carcinoma | Female | >=65 | I/II | Unknown | Unknown | SD |
| ERBIN | SNV | Missense_Mutation | c.3872N>T | p.His1291Leu | p.H1291L | Q96RT1 | protein_coding | deleterious(0) | benign(0.331) | TCGA-AO-A0JJ-01 | Breast | breast invasive carcinoma | Female | <65 | I/II | Chemotherapy | cyclophospamide | SD | |
| ERBIN | SNV | Missense_Mutation | novel | c.1765N>A | p.Val589Ile | p.V589I | Q96RT1 | protein_coding | tolerated(0.23) | benign(0) | TCGA-B6-A40B-01 | Breast | breast invasive carcinoma | Female | >=65 | I/II | Unknown | Unknown | SD |
| ERBIN | SNV | Missense_Mutation | c.4072N>A | p.Asp1358Asn | p.D1358N | Q96RT1 | protein_coding | deleterious(0.02) | probably_damaging(0.917) | TCGA-BH-A0AZ-01 | Breast | breast invasive carcinoma | Female | <65 | III/IV | Chemotherapy | doxorubicin | CR | |
| ERBIN | SNV | Missense_Mutation | c.907N>C | p.Glu303Gln | p.E303Q | Q96RT1 | protein_coding | deleterious(0) | possibly_damaging(0.744) | TCGA-D8-A1J8-01 | Breast | breast invasive carcinoma | Female | >=65 | I/II | Hormone Therapy | nolvadex | SD | |
| ERBIN | SNV | Missense_Mutation | c.2631N>C | p.Glu877Asp | p.E877D | Q96RT1 | protein_coding | tolerated(0.94) | benign(0.022) | TCGA-D8-A1J8-01 | Breast | breast invasive carcinoma | Female | >=65 | I/II | Hormone Therapy | nolvadex | SD | |
| ERBIN | SNV | Missense_Mutation | c.3049N>A | p.Glu1017Lys | p.E1017K | Q96RT1 | protein_coding | tolerated(0.2) | benign(0.278) | TCGA-D8-A1J8-01 | Breast | breast invasive carcinoma | Female | >=65 | I/II | Hormone Therapy | nolvadex | SD | |
| ERBIN | SNV | Missense_Mutation | c.3268N>T | p.Asp1090Tyr | p.D1090Y | Q96RT1 | protein_coding | deleterious(0) | possibly_damaging(0.653) | TCGA-D8-A1J8-01 | Breast | breast invasive carcinoma | Female | >=65 | I/II | Hormone Therapy | nolvadex | SD |
| Page: 1 2 3 4 5 6 7 8 9 10 11 12 13 14 15 |
Top |
Related drugs of malignant transformation related genes |
| Identification of chemicals and drugs interact with genes involved in malignant transfromation |
| (DGIdb 4.0) |
| Entrez ID | Symbol | Category | Interaction Types | Drug Claim Name | Drug Name | PMIDs |
| Page: 1 |

Copyright 2023-Present -The University of Texas Health Science Center at Houston |