
|
|||||
|
 | |
| |
| |
| |
| |
| |
|
Gene: CHMP2B |
Gene summary for CHMP2B |
| Gene information | Species | Human | Gene symbol | CHMP2B | Gene ID | 25978 |
| Gene name | charged multivesicular body protein 2B | |
| Gene Alias | ALS17 | |
| Cytomap | 3p11.2 | |
| Gene Type | protein-coding | GO ID | GO:0000070 | UniProtAcc | B2RE76 |
Top |
Malignant transformation analysis |
| Identification of the aberrant gene expression in precancerous and cancerous lesions by comparing the gene expression of stem-like cells in diseased tissues with normal stem cells |
| Entrez ID | Symbol | Replicates | Species | Organ | Tissue | Adj P-value | Log2FC | Malignancy |
| 25978 | CHMP2B | LZE4T | Human | Esophagus | ESCC | 4.43e-11 | 2.26e-01 | 0.0811 |
| 25978 | CHMP2B | LZE5T | Human | Esophagus | ESCC | 4.45e-04 | 3.61e-01 | 0.0514 |
| 25978 | CHMP2B | LZE7T | Human | Esophagus | ESCC | 3.01e-06 | 6.51e-02 | 0.0667 |
| 25978 | CHMP2B | LZE8T | Human | Esophagus | ESCC | 5.57e-06 | 5.19e-01 | 0.067 |
| 25978 | CHMP2B | LZE20T | Human | Esophagus | ESCC | 3.32e-03 | 2.22e-01 | 0.0662 |
| 25978 | CHMP2B | LZE24T | Human | Esophagus | ESCC | 7.25e-16 | 7.64e-01 | 0.0596 |
| 25978 | CHMP2B | LZE6T | Human | Esophagus | ESCC | 1.25e-06 | 9.44e-02 | 0.0845 |
| 25978 | CHMP2B | P2T-E | Human | Esophagus | ESCC | 1.13e-22 | 2.80e-01 | 0.1177 |
| 25978 | CHMP2B | P4T-E | Human | Esophagus | ESCC | 5.67e-24 | 6.00e-01 | 0.1323 |
| 25978 | CHMP2B | P5T-E | Human | Esophagus | ESCC | 1.33e-09 | 1.78e-01 | 0.1327 |
| 25978 | CHMP2B | P8T-E | Human | Esophagus | ESCC | 4.98e-16 | 3.59e-01 | 0.0889 |
| 25978 | CHMP2B | P9T-E | Human | Esophagus | ESCC | 1.19e-15 | 1.86e-01 | 0.1131 |
| 25978 | CHMP2B | P10T-E | Human | Esophagus | ESCC | 1.70e-13 | 2.15e-01 | 0.116 |
| 25978 | CHMP2B | P11T-E | Human | Esophagus | ESCC | 2.97e-12 | 9.60e-01 | 0.1426 |
| 25978 | CHMP2B | P12T-E | Human | Esophagus | ESCC | 1.12e-18 | 3.79e-01 | 0.1122 |
| 25978 | CHMP2B | P15T-E | Human | Esophagus | ESCC | 3.70e-17 | 3.82e-01 | 0.1149 |
| 25978 | CHMP2B | P16T-E | Human | Esophagus | ESCC | 1.43e-17 | 2.38e-01 | 0.1153 |
| 25978 | CHMP2B | P17T-E | Human | Esophagus | ESCC | 5.56e-03 | 2.25e-01 | 0.1278 |
| 25978 | CHMP2B | P19T-E | Human | Esophagus | ESCC | 4.43e-06 | 8.70e-01 | 0.1662 |
| 25978 | CHMP2B | P20T-E | Human | Esophagus | ESCC | 3.37e-21 | 5.47e-01 | 0.1124 |
| Page: 1 2 3 4 5 6 7 8 |
| Tissue | Expression Dynamics | Abbreviation |
| Esophagus | 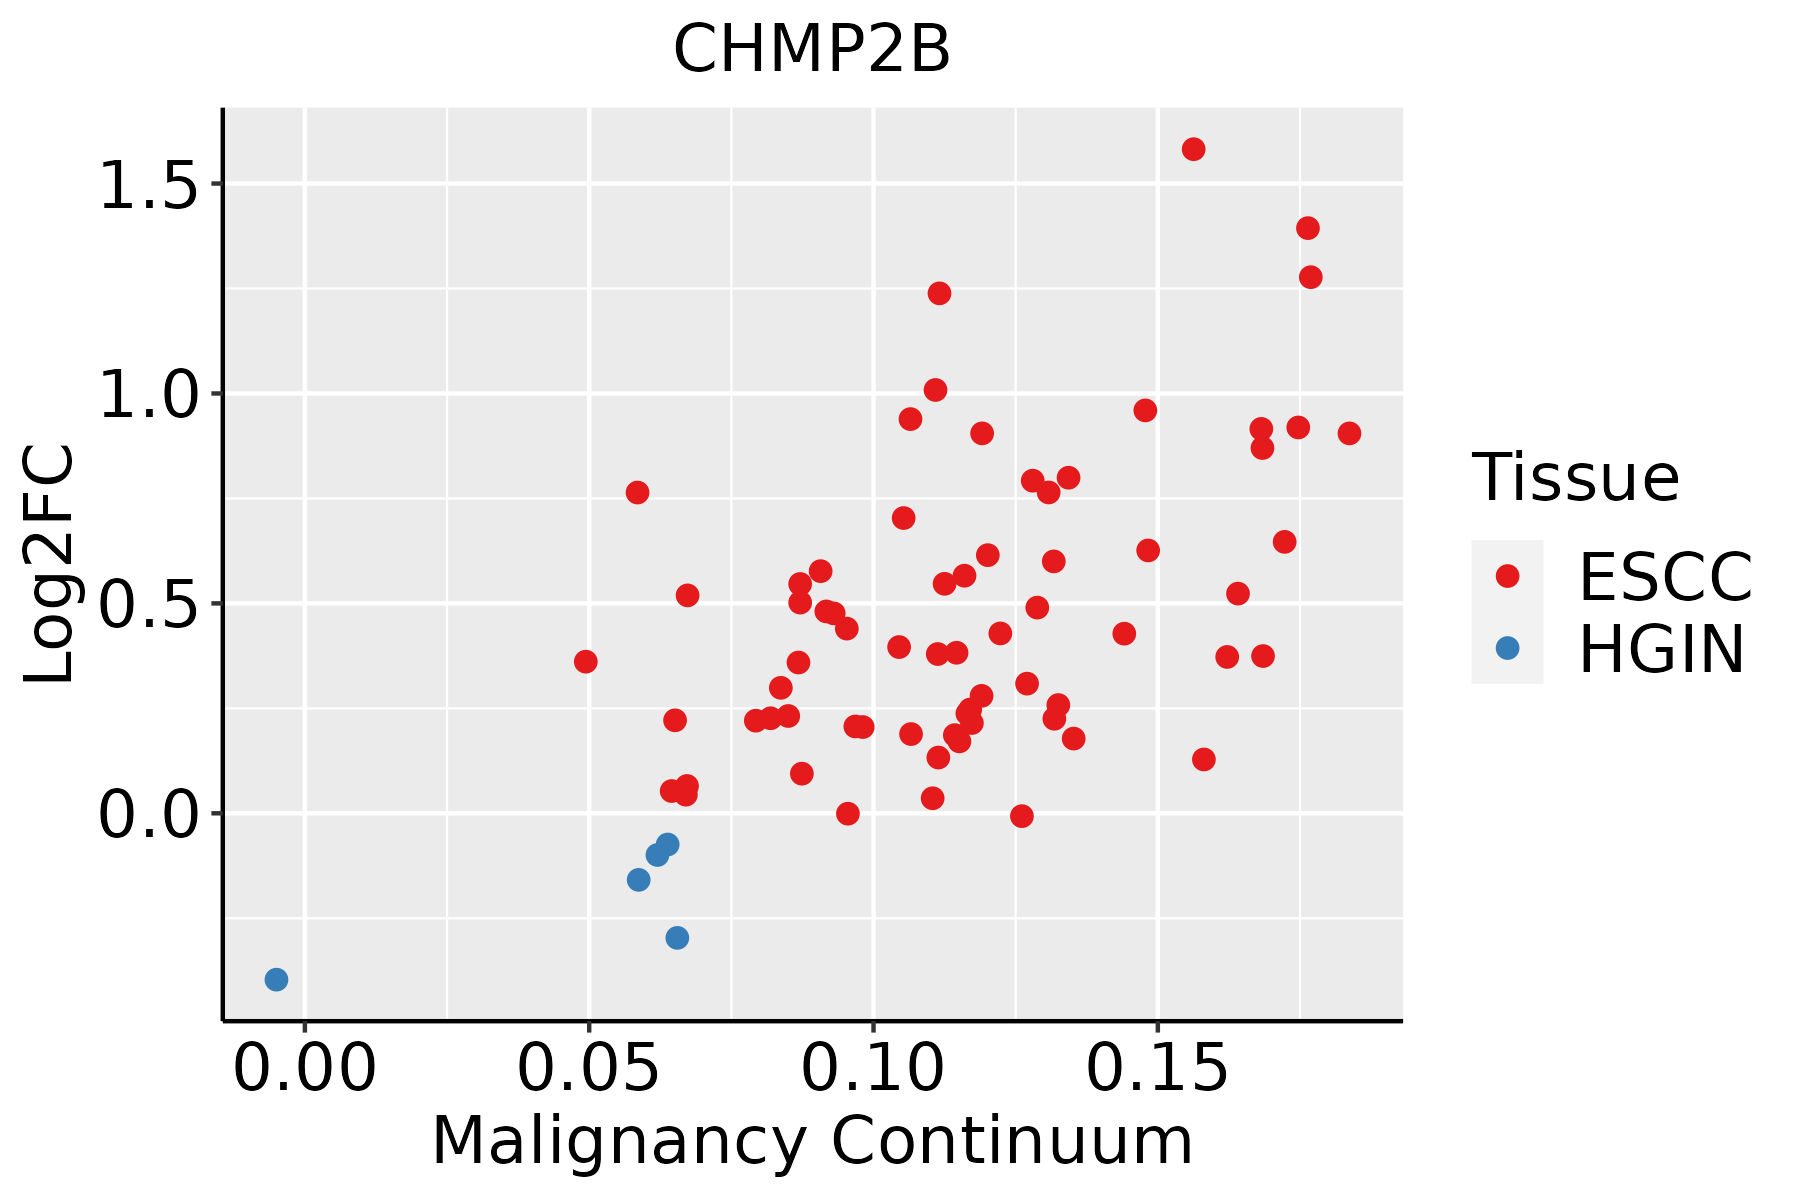 | ESCC: Esophageal squamous cell carcinoma |
| HGIN: High-grade intraepithelial neoplasias | ||
| LGIN: Low-grade intraepithelial neoplasias | ||
| Liver | 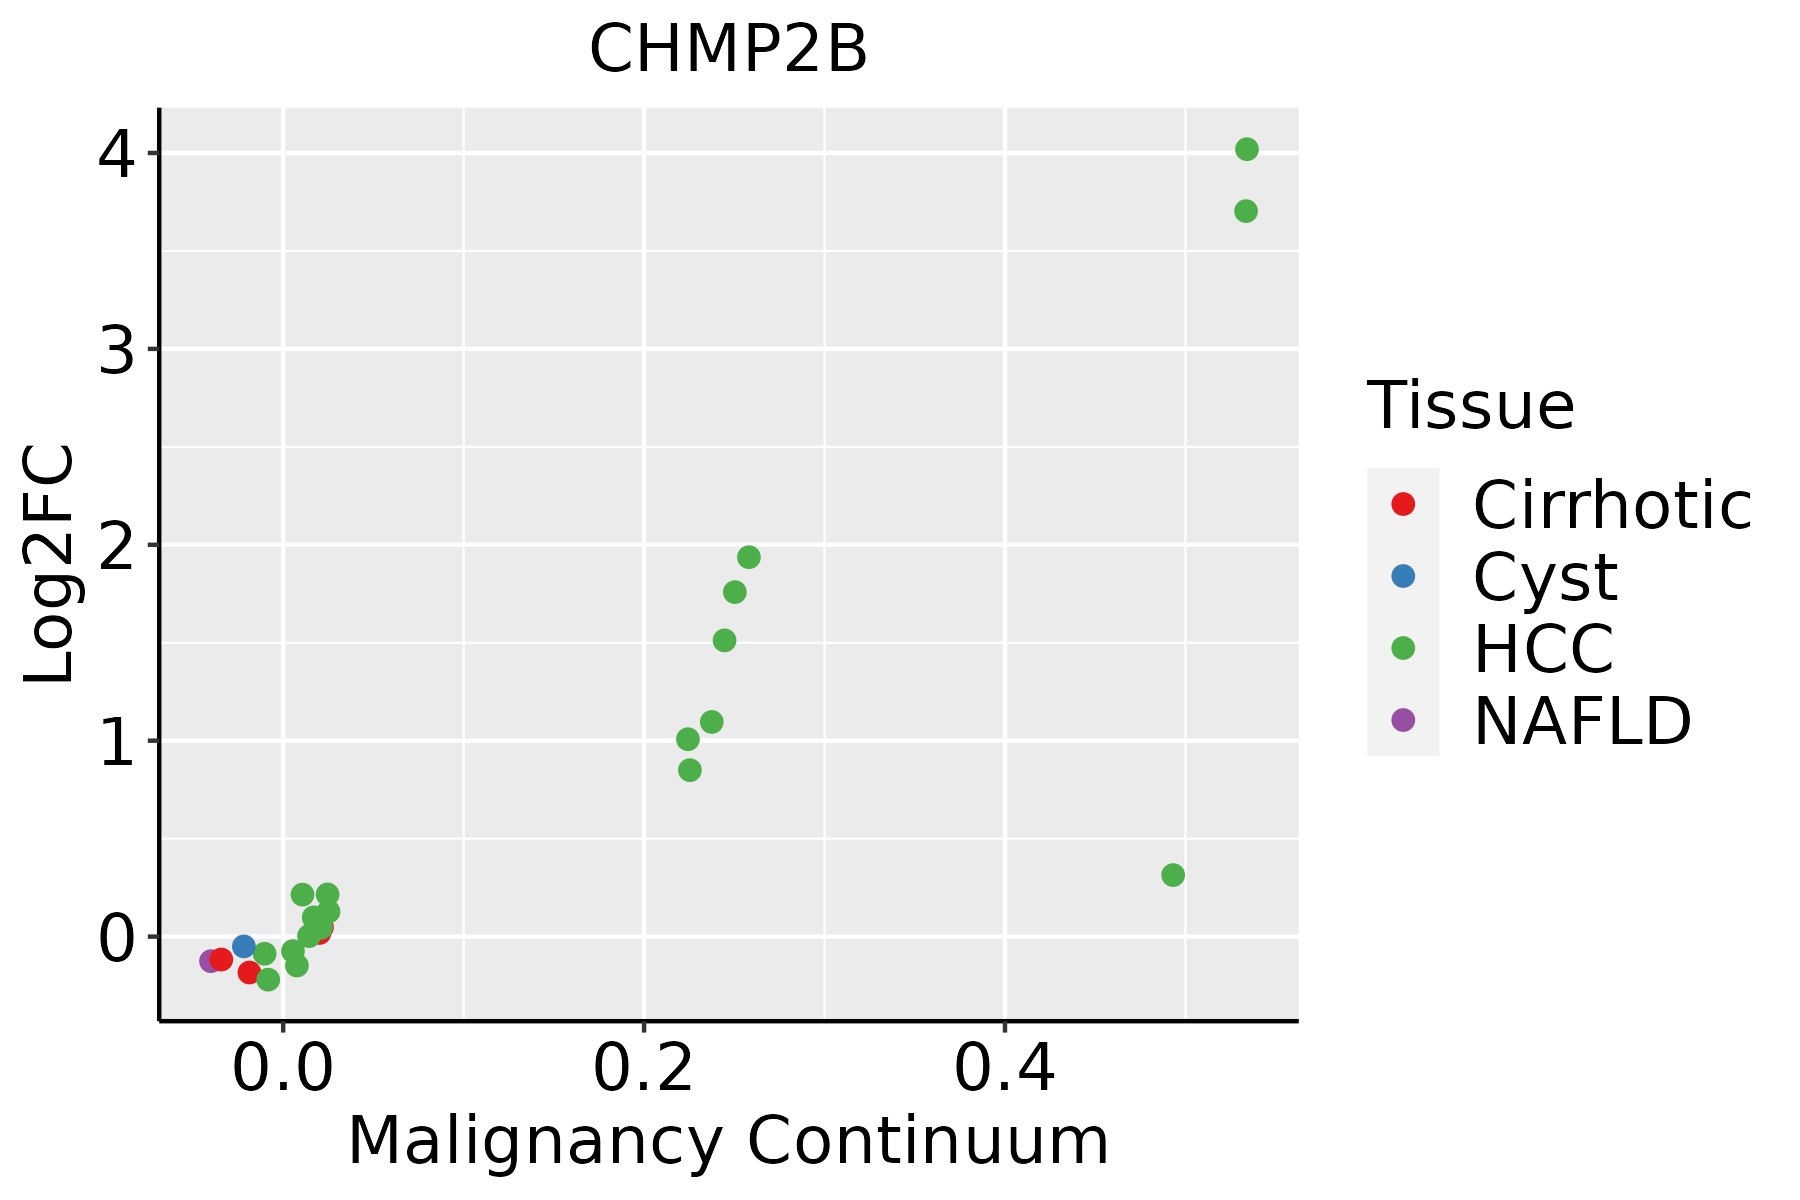 | HCC: Hepatocellular carcinoma |
| NAFLD: Non-alcoholic fatty liver disease | ||
| Oral Cavity | 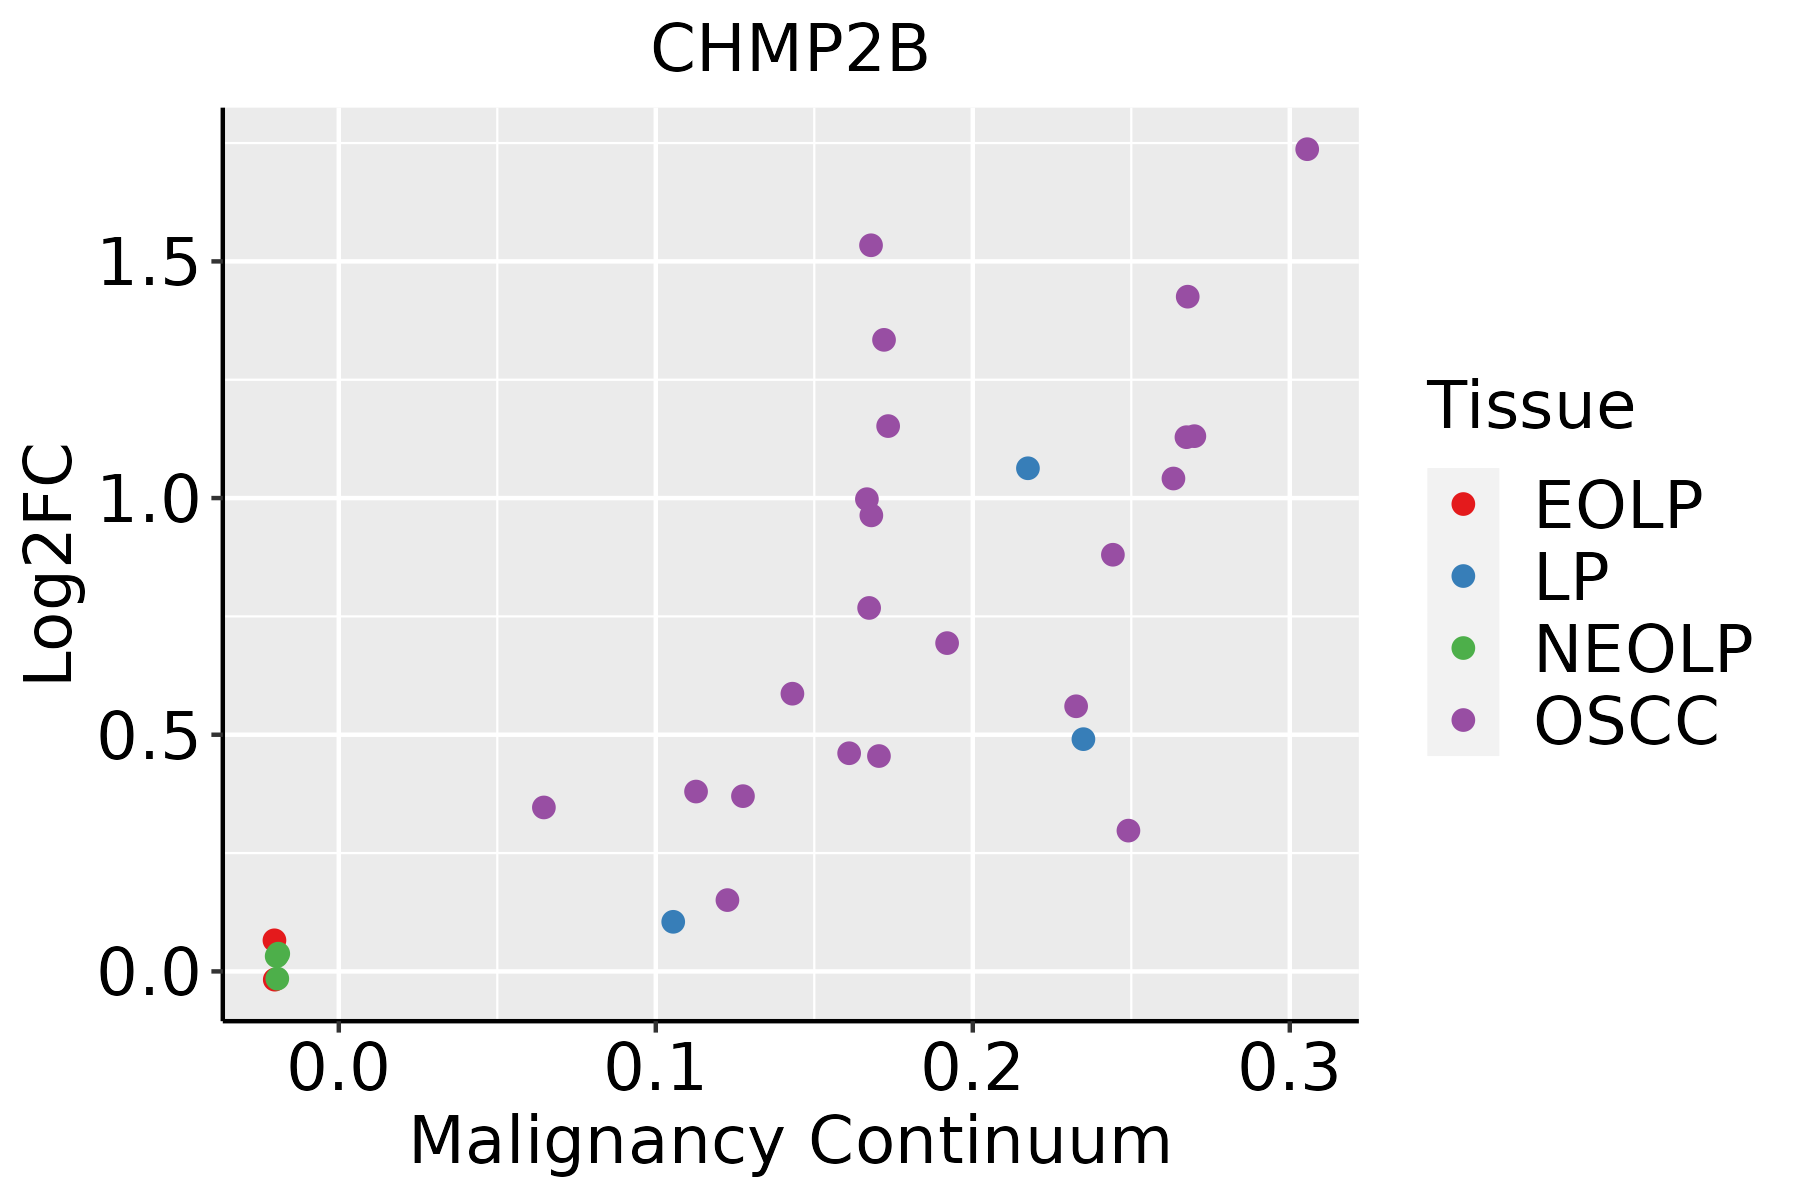 | EOLP: Erosive Oral lichen planus |
| LP: leukoplakia | ||
| NEOLP: Non-erosive oral lichen planus | ||
| OSCC: Oral squamous cell carcinoma | ||
| Prostate | 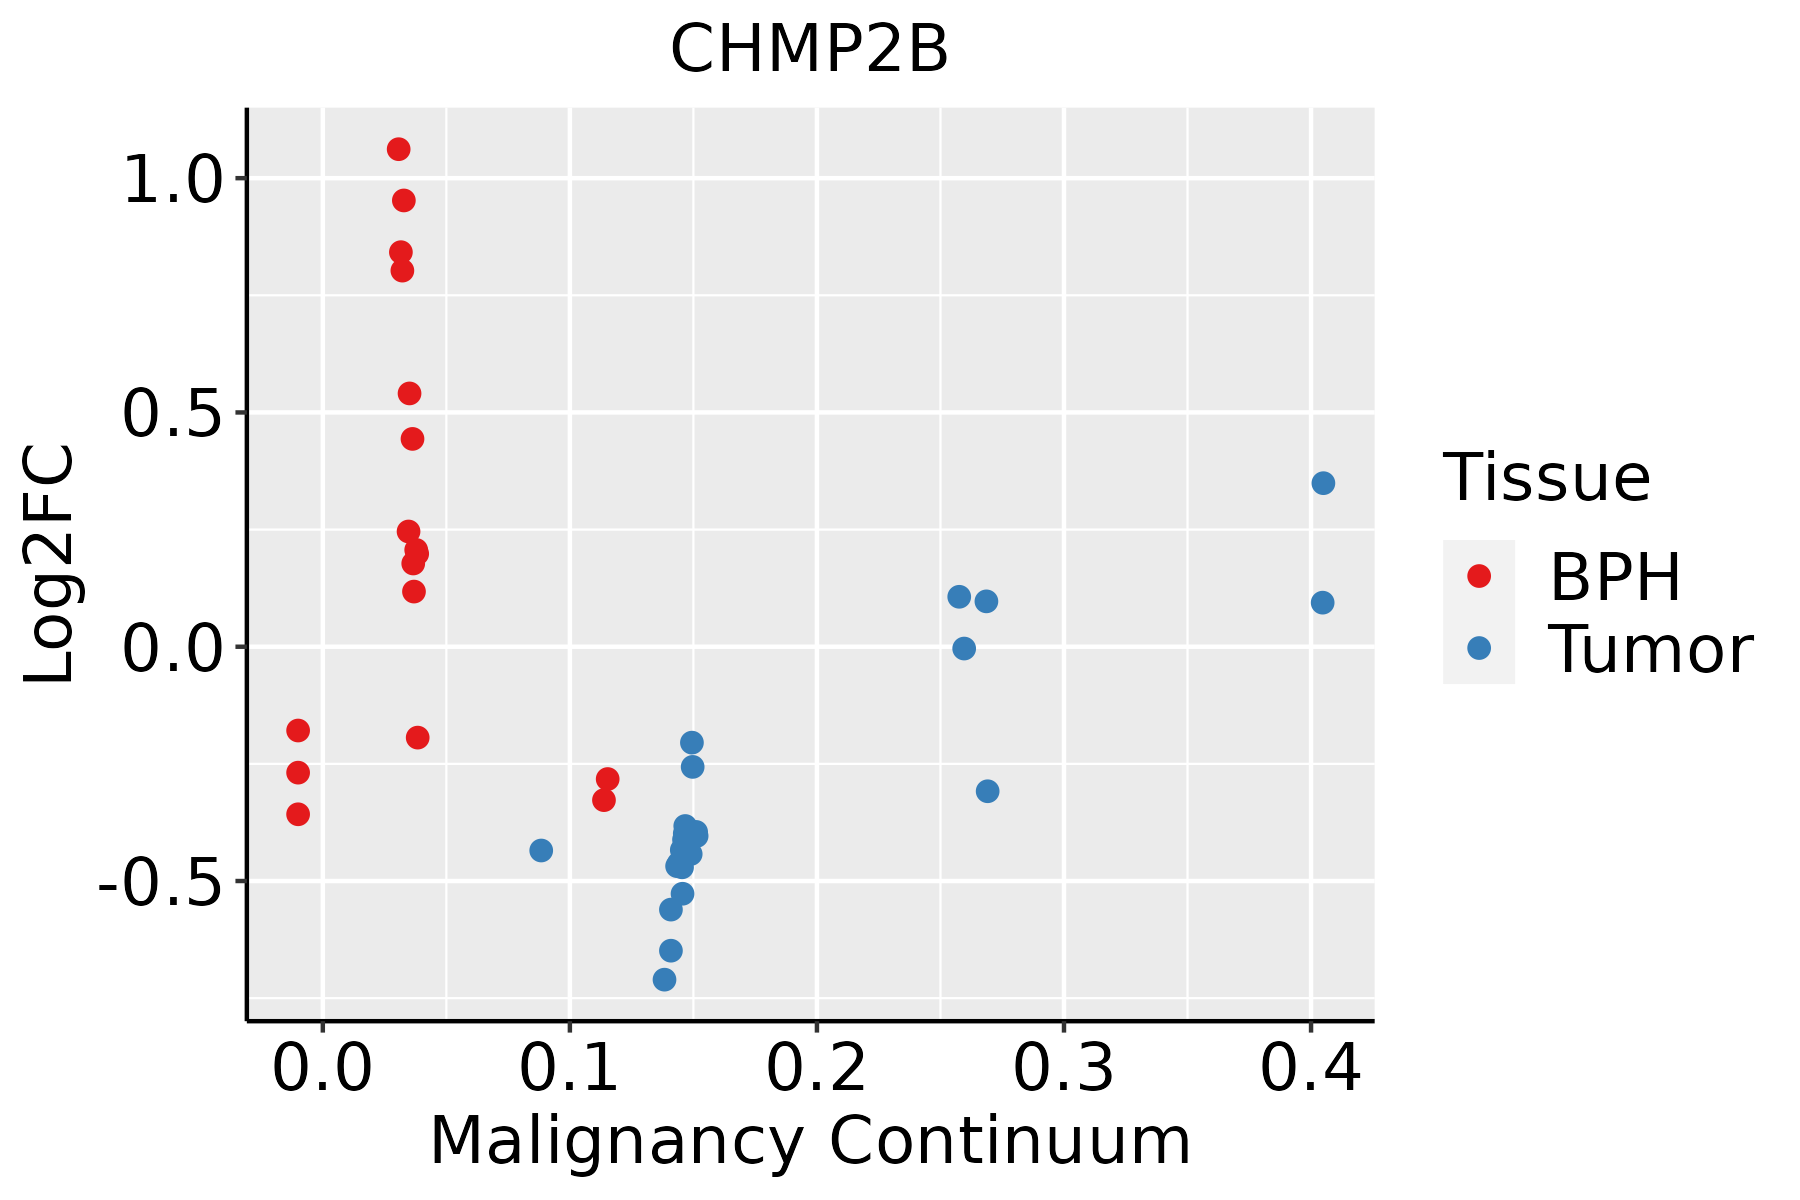 | BPH: Benign Prostatic Hyperplasia |
| Skin | 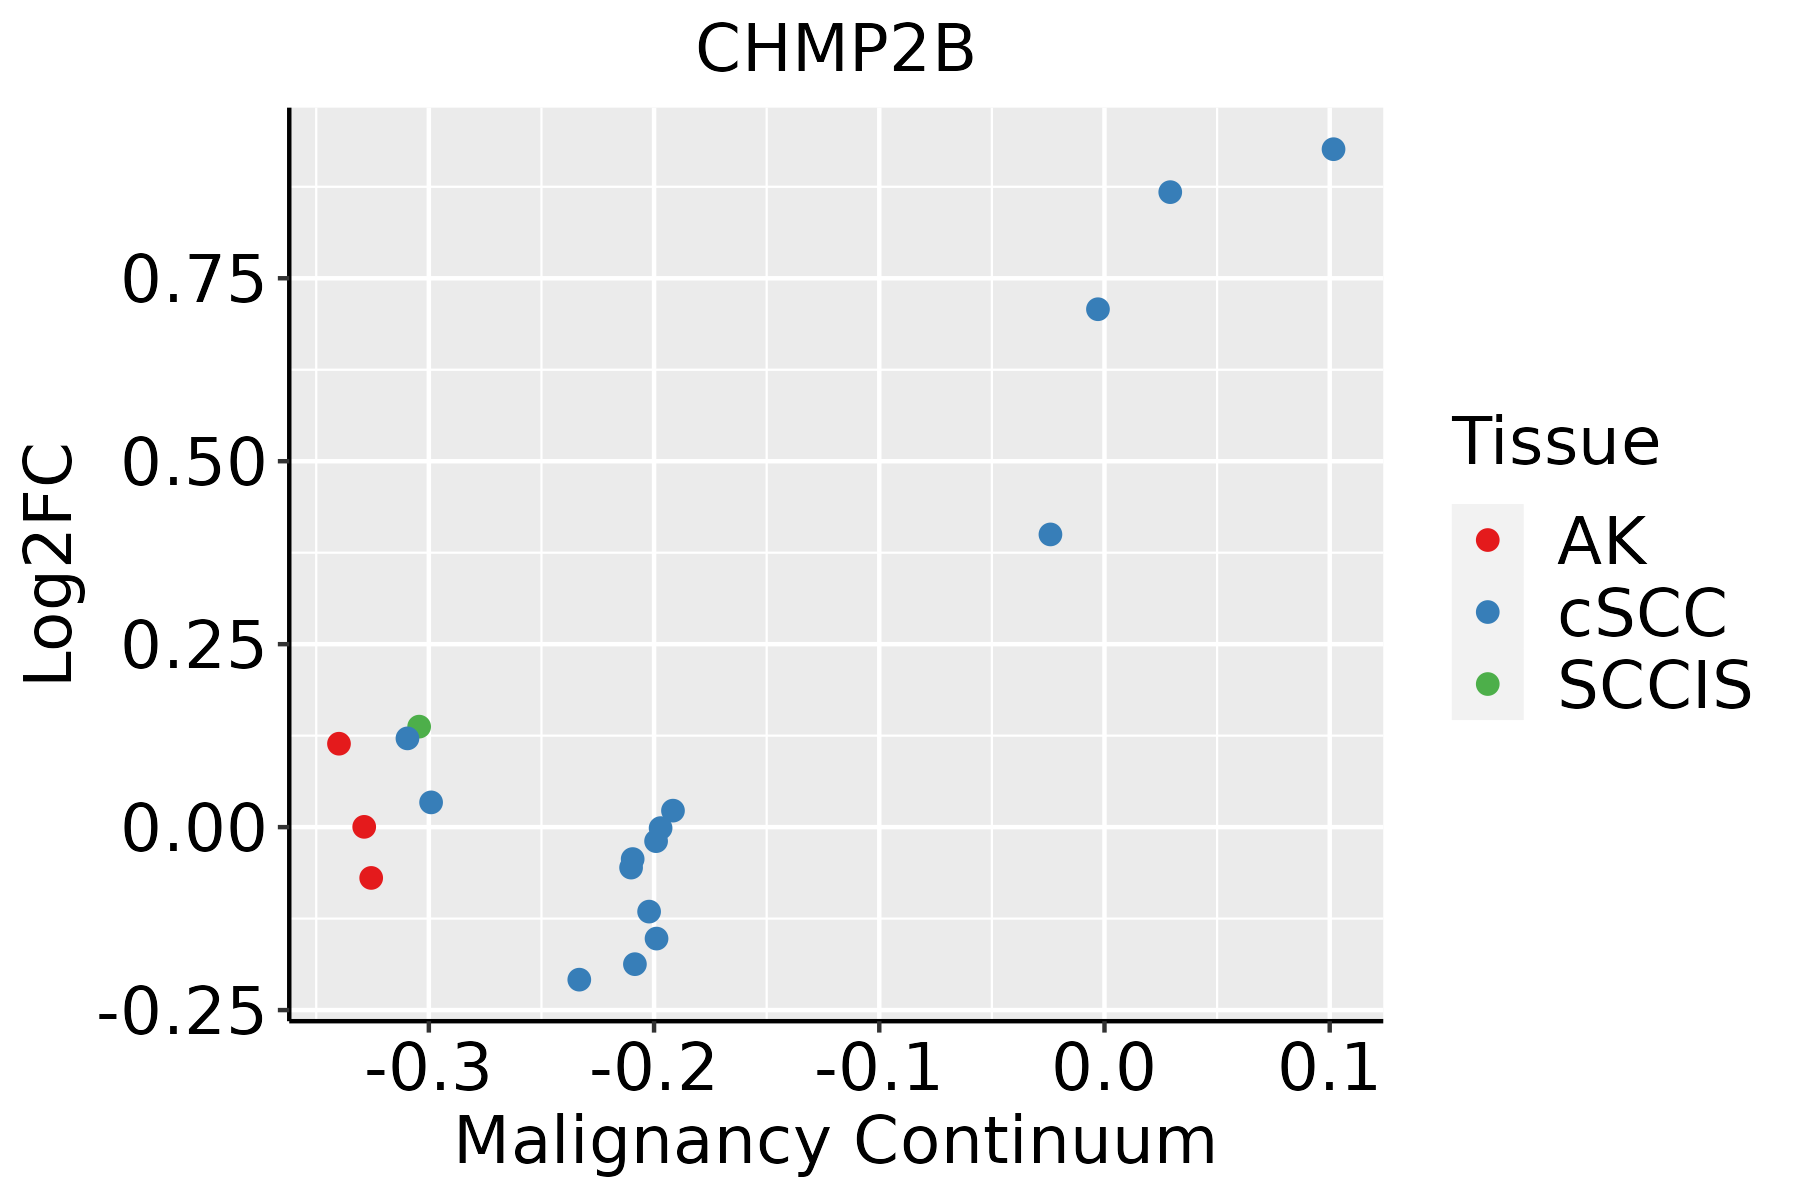 | AK: Actinic keratosis |
| cSCC: Cutaneous squamous cell carcinoma | ||
| SCCIS:squamous cell carcinoma in situ | ||
| Thyroid |  | ATC: Anaplastic thyroid cancer |
| HT: Hashimoto's thyroiditis | ||
| PTC: Papillary thyroid cancer |
| ∗log2FC in expression of this searched gene in stem-like cells from each diseased tissue sample relative to stem-like cells in normal samples in each tissue plotted against the malignancy continuum. Samples are colored based on if they are from different disease stage. |
Top |
Malignant transformation related pathway analysis |
| Find out the enriched GO biological processes and KEGG pathways involved in transition from healthy to precancer to cancer |
| Tissue | Disease Stage | Enriched GO biological Processes |
| Colorectum | AD |  |
| Colorectum | SER |  |
| Colorectum | MSS |  |
| Colorectum | MSI-H |  |
| Colorectum | FAP |  |
| ∗Top 15 enriched GO BP terms are showed in the bar plot of each disease state in each tissue. Each row represents a significant GO biological process which is colored according to the -log10(p.adjust). |
| Page: 1 2 3 4 5 6 7 8 9 |
| GO ID | Tissue | Disease Stage | Description | Gene Ratio | Bg Ratio | pvalue | p.adjust | Count |
| GO:004390319 | Oral cavity | OSCC | regulation of biological process involved in symbiotic interaction | 44/7305 | 72/18723 | 1.20e-04 | 8.57e-04 | 44 |
| GO:19016736 | Oral cavity | OSCC | regulation of mitotic spindle assembly | 15/7305 | 18/18723 | 1.53e-04 | 1.07e-03 | 15 |
| GO:19021884 | Oral cavity | OSCC | positive regulation of viral release from host cell | 10/7305 | 11/18723 | 5.78e-04 | 3.30e-03 | 10 |
| GO:00610253 | Oral cavity | OSCC | membrane fusion | 84/7305 | 163/18723 | 7.56e-04 | 4.12e-03 | 84 |
| GO:00083332 | Oral cavity | OSCC | endosome to lysosome transport | 33/7305 | 55/18723 | 1.30e-03 | 6.46e-03 | 33 |
| GO:00328863 | Oral cavity | OSCC | regulation of microtubule-based process | 115/7305 | 240/18723 | 2.95e-03 | 1.28e-02 | 115 |
| GO:00070981 | Oral cavity | OSCC | centrosome cycle | 66/7305 | 130/18723 | 4.17e-03 | 1.70e-02 | 66 |
| GO:19021863 | Oral cavity | OSCC | regulation of viral release from host cell | 17/7305 | 26/18723 | 5.83e-03 | 2.23e-02 | 17 |
| GO:00310232 | Oral cavity | OSCC | microtubule organizing center organization | 70/7305 | 143/18723 | 9.71e-03 | 3.44e-02 | 70 |
| GO:0016032110 | Oral cavity | LP | viral process | 211/4623 | 415/18723 | 4.06e-31 | 3.18e-28 | 211 |
| GO:0019058110 | Oral cavity | LP | viral life cycle | 161/4623 | 317/18723 | 5.99e-24 | 2.21e-21 | 161 |
| GO:001623615 | Oral cavity | LP | macroautophagy | 135/4623 | 291/18723 | 4.71e-16 | 6.70e-14 | 135 |
| GO:0051701110 | Oral cavity | LP | biological process involved in interaction with host | 100/4623 | 203/18723 | 2.72e-14 | 3.10e-12 | 100 |
| GO:0044403110 | Oral cavity | LP | biological process involved in symbiotic interaction | 130/4623 | 290/18723 | 4.23e-14 | 4.64e-12 | 130 |
| GO:0050792110 | Oral cavity | LP | regulation of viral process | 83/4623 | 164/18723 | 6.50e-13 | 5.74e-11 | 83 |
| GO:0052126110 | Oral cavity | LP | movement in host environment | 87/4623 | 175/18723 | 6.65e-13 | 5.79e-11 | 87 |
| GO:001605013 | Oral cavity | LP | vesicle organization | 128/4623 | 300/18723 | 4.96e-12 | 3.98e-10 | 128 |
| GO:0022411110 | Oral cavity | LP | cellular component disassembly | 173/4623 | 443/18723 | 9.97e-12 | 7.44e-10 | 173 |
| GO:1903900110 | Oral cavity | LP | regulation of viral life cycle | 72/4623 | 148/18723 | 2.23e-10 | 1.19e-08 | 72 |
| GO:004852418 | Oral cavity | LP | positive regulation of viral process | 40/4623 | 65/18723 | 3.14e-10 | 1.64e-08 | 40 |
| Page: 1 2 3 4 5 6 7 8 9 10 11 12 13 14 15 16 17 18 19 20 21 22 23 24 25 26 27 28 29 30 31 32 33 34 35 36 37 38 |
| Pathway ID | Tissue | Disease Stage | Description | Gene Ratio | Bg Ratio | pvalue | p.adjust | qvalue | Count |
| hsa05014210 | Esophagus | ESCC | Amyotrophic lateral sclerosis | 266/4205 | 364/8465 | 1.31e-20 | 2.20e-18 | 1.13e-18 | 266 |
| hsa04144210 | Esophagus | ESCC | Endocytosis | 186/4205 | 251/8465 | 9.74e-16 | 4.66e-14 | 2.39e-14 | 186 |
| hsa05022210 | Esophagus | ESCC | Pathways of neurodegeneration - multiple diseases | 318/4205 | 476/8465 | 6.10e-15 | 2.04e-13 | 1.05e-13 | 318 |
| hsa0501438 | Esophagus | ESCC | Amyotrophic lateral sclerosis | 266/4205 | 364/8465 | 1.31e-20 | 2.20e-18 | 1.13e-18 | 266 |
| hsa0414437 | Esophagus | ESCC | Endocytosis | 186/4205 | 251/8465 | 9.74e-16 | 4.66e-14 | 2.39e-14 | 186 |
| hsa0502238 | Esophagus | ESCC | Pathways of neurodegeneration - multiple diseases | 318/4205 | 476/8465 | 6.10e-15 | 2.04e-13 | 1.05e-13 | 318 |
| hsa0501414 | Liver | Cirrhotic | Amyotrophic lateral sclerosis | 187/2530 | 364/8465 | 1.56e-18 | 6.50e-17 | 4.01e-17 | 187 |
| hsa0502214 | Liver | Cirrhotic | Pathways of neurodegeneration - multiple diseases | 217/2530 | 476/8465 | 7.30e-14 | 2.03e-12 | 1.25e-12 | 217 |
| hsa0414412 | Liver | Cirrhotic | Endocytosis | 119/2530 | 251/8465 | 2.33e-09 | 4.56e-08 | 2.81e-08 | 119 |
| hsa0501415 | Liver | Cirrhotic | Amyotrophic lateral sclerosis | 187/2530 | 364/8465 | 1.56e-18 | 6.50e-17 | 4.01e-17 | 187 |
| hsa0502215 | Liver | Cirrhotic | Pathways of neurodegeneration - multiple diseases | 217/2530 | 476/8465 | 7.30e-14 | 2.03e-12 | 1.25e-12 | 217 |
| hsa0414413 | Liver | Cirrhotic | Endocytosis | 119/2530 | 251/8465 | 2.33e-09 | 4.56e-08 | 2.81e-08 | 119 |
| hsa0501422 | Liver | HCC | Amyotrophic lateral sclerosis | 252/4020 | 364/8465 | 8.85e-18 | 7.41e-16 | 4.12e-16 | 252 |
| hsa0414422 | Liver | HCC | Endocytosis | 178/4020 | 251/8465 | 2.03e-14 | 5.22e-13 | 2.91e-13 | 178 |
| hsa0502222 | Liver | HCC | Pathways of neurodegeneration - multiple diseases | 298/4020 | 476/8465 | 6.59e-12 | 1.30e-10 | 7.22e-11 | 298 |
| hsa0501432 | Liver | HCC | Amyotrophic lateral sclerosis | 252/4020 | 364/8465 | 8.85e-18 | 7.41e-16 | 4.12e-16 | 252 |
| hsa0414432 | Liver | HCC | Endocytosis | 178/4020 | 251/8465 | 2.03e-14 | 5.22e-13 | 2.91e-13 | 178 |
| hsa0502232 | Liver | HCC | Pathways of neurodegeneration - multiple diseases | 298/4020 | 476/8465 | 6.59e-12 | 1.30e-10 | 7.22e-11 | 298 |
| hsa0501428 | Oral cavity | OSCC | Amyotrophic lateral sclerosis | 246/3704 | 364/8465 | 6.65e-21 | 1.11e-18 | 5.67e-19 | 246 |
| hsa0414427 | Oral cavity | OSCC | Endocytosis | 174/3704 | 251/8465 | 9.42e-17 | 4.51e-15 | 2.29e-15 | 174 |
| Page: 1 2 3 |
Top |
Cell-cell communication analysis |
| Identification of potential cell-cell interactions between two cell types and their ligand-receptor pairs for different disease states |
| Ligand | Receptor | LRpair | Pathway | Tissue | Disease Stage |
| Page: 1 |
Top |
Single-cell gene regulatory network inference analysis |
| Find out the significant the regulons (TFs) and the target genes of each regulon across cell types for different disease states |
| TF | Cell Type | Tissue | Disease Stage | Target Gene | RSS | Regulon Activity |
| ∗The dot plots of a searched regulon are shown for all cell subpopulations in each disease state of each tissue based on the regulon specific score inferred using pySCENIC and by calculating the average expression. |
| Page: 1 |
Top |
Somatic mutation of malignant transformation related genes |
| Annotation of somatic variants for genes involved in malignant transformation |
| Hugo Symbol | Variant Class | Variant Classification | dbSNP RS | HGVSc | HGVSp | HGVSp Short | SWISSPROT | BIOTYPE | SIFT | PolyPhen | Tumor Sample Barcode | Tissue | Histology | Sex | Age | Stage | Therapy Types | Drugs | Outcome |
| CHMP2B | SNV | Missense_Mutation | c.369N>C | p.Gln123His | p.Q123H | Q9UQN3 | protein_coding | deleterious(0.03) | possibly_damaging(0.77) | TCGA-AA-3510-01 | Colorectum | colon adenocarcinoma | Male | >=65 | I/II | Unknown | Unknown | SD | |
| CHMP2B | SNV | Missense_Mutation | c.296N>T | p.Ala99Val | p.A99V | Q9UQN3 | protein_coding | deleterious(0.01) | probably_damaging(0.998) | TCGA-AA-A022-01 | Colorectum | colon adenocarcinoma | Female | >=65 | I/II | Unknown | Unknown | SD | |
| CHMP2B | SNV | Missense_Mutation | c.194T>G | p.Leu65Arg | p.L65R | Q9UQN3 | protein_coding | deleterious(0) | probably_damaging(0.999) | TCGA-G4-6586-01 | Colorectum | colon adenocarcinoma | Female | >=65 | I/II | Unknown | Unknown | SD | |
| CHMP2B | SNV | Missense_Mutation | novel | c.499N>A | p.Leu167Ile | p.L167I | Q9UQN3 | protein_coding | deleterious(0) | probably_damaging(0.997) | TCGA-AG-A002-01 | Colorectum | rectum adenocarcinoma | Male | <65 | I/II | Unknown | Unknown | SD |
| CHMP2B | SNV | Missense_Mutation | novel | c.554N>T | p.Ala185Val | p.A185V | Q9UQN3 | protein_coding | tolerated(0.28) | benign(0.028) | TCGA-A5-A0G1-01 | Endometrium | uterine corpus endometrioid carcinoma | Female | >=65 | I/II | Unknown | Unknown | SD |
| CHMP2B | SNV | Missense_Mutation | novel | c.327N>A | p.Met109Ile | p.M109I | Q9UQN3 | protein_coding | deleterious(0.01) | possibly_damaging(0.785) | TCGA-A5-A1OF-01 | Endometrium | uterine corpus endometrioid carcinoma | Female | <65 | I/II | Unknown | Unknown | SD |
| CHMP2B | SNV | Missense_Mutation | novel | c.25A>T | p.Thr9Ser | p.T9S | Q9UQN3 | protein_coding | tolerated(0.19) | benign(0) | TCGA-AX-A2HJ-01 | Endometrium | uterine corpus endometrioid carcinoma | Female | <65 | I/II | Unknown | Unknown | SD |
| CHMP2B | SNV | Missense_Mutation | novel | c.238N>G | p.Ser80Ala | p.S80A | Q9UQN3 | protein_coding | tolerated(0.34) | benign(0.23) | TCGA-B5-A1MR-01 | Endometrium | uterine corpus endometrioid carcinoma | Female | >=65 | III/IV | Unknown | Unknown | SD |
| CHMP2B | SNV | Missense_Mutation | novel | c.375N>A | p.Met125Ile | p.M125I | Q9UQN3 | protein_coding | deleterious(0.04) | benign(0.162) | TCGA-D1-A175-01 | Endometrium | uterine corpus endometrioid carcinoma | Female | <65 | I/II | Chemotherapy | paclitaxel | SD |
| CHMP2B | SNV | Missense_Mutation | novel | c.499C>A | p.Leu167Ile | p.L167I | Q9UQN3 | protein_coding | deleterious(0) | probably_damaging(0.997) | TCGA-E6-A1LX-01 | Endometrium | uterine corpus endometrioid carcinoma | Female | <65 | I/II | Unknown | Unknown | SD |
| Page: 1 2 |
Top |
Related drugs of malignant transformation related genes |
| Identification of chemicals and drugs interact with genes involved in malignant transfromation |
| (DGIdb 4.0) |
| Entrez ID | Symbol | Category | Interaction Types | Drug Claim Name | Drug Name | PMIDs |
| Page: 1 |

Copyright 2023-Present -The University of Texas Health Science Center at Houston |