| Tissue | Expression Dynamics | Abbreviation |
| Cervix | 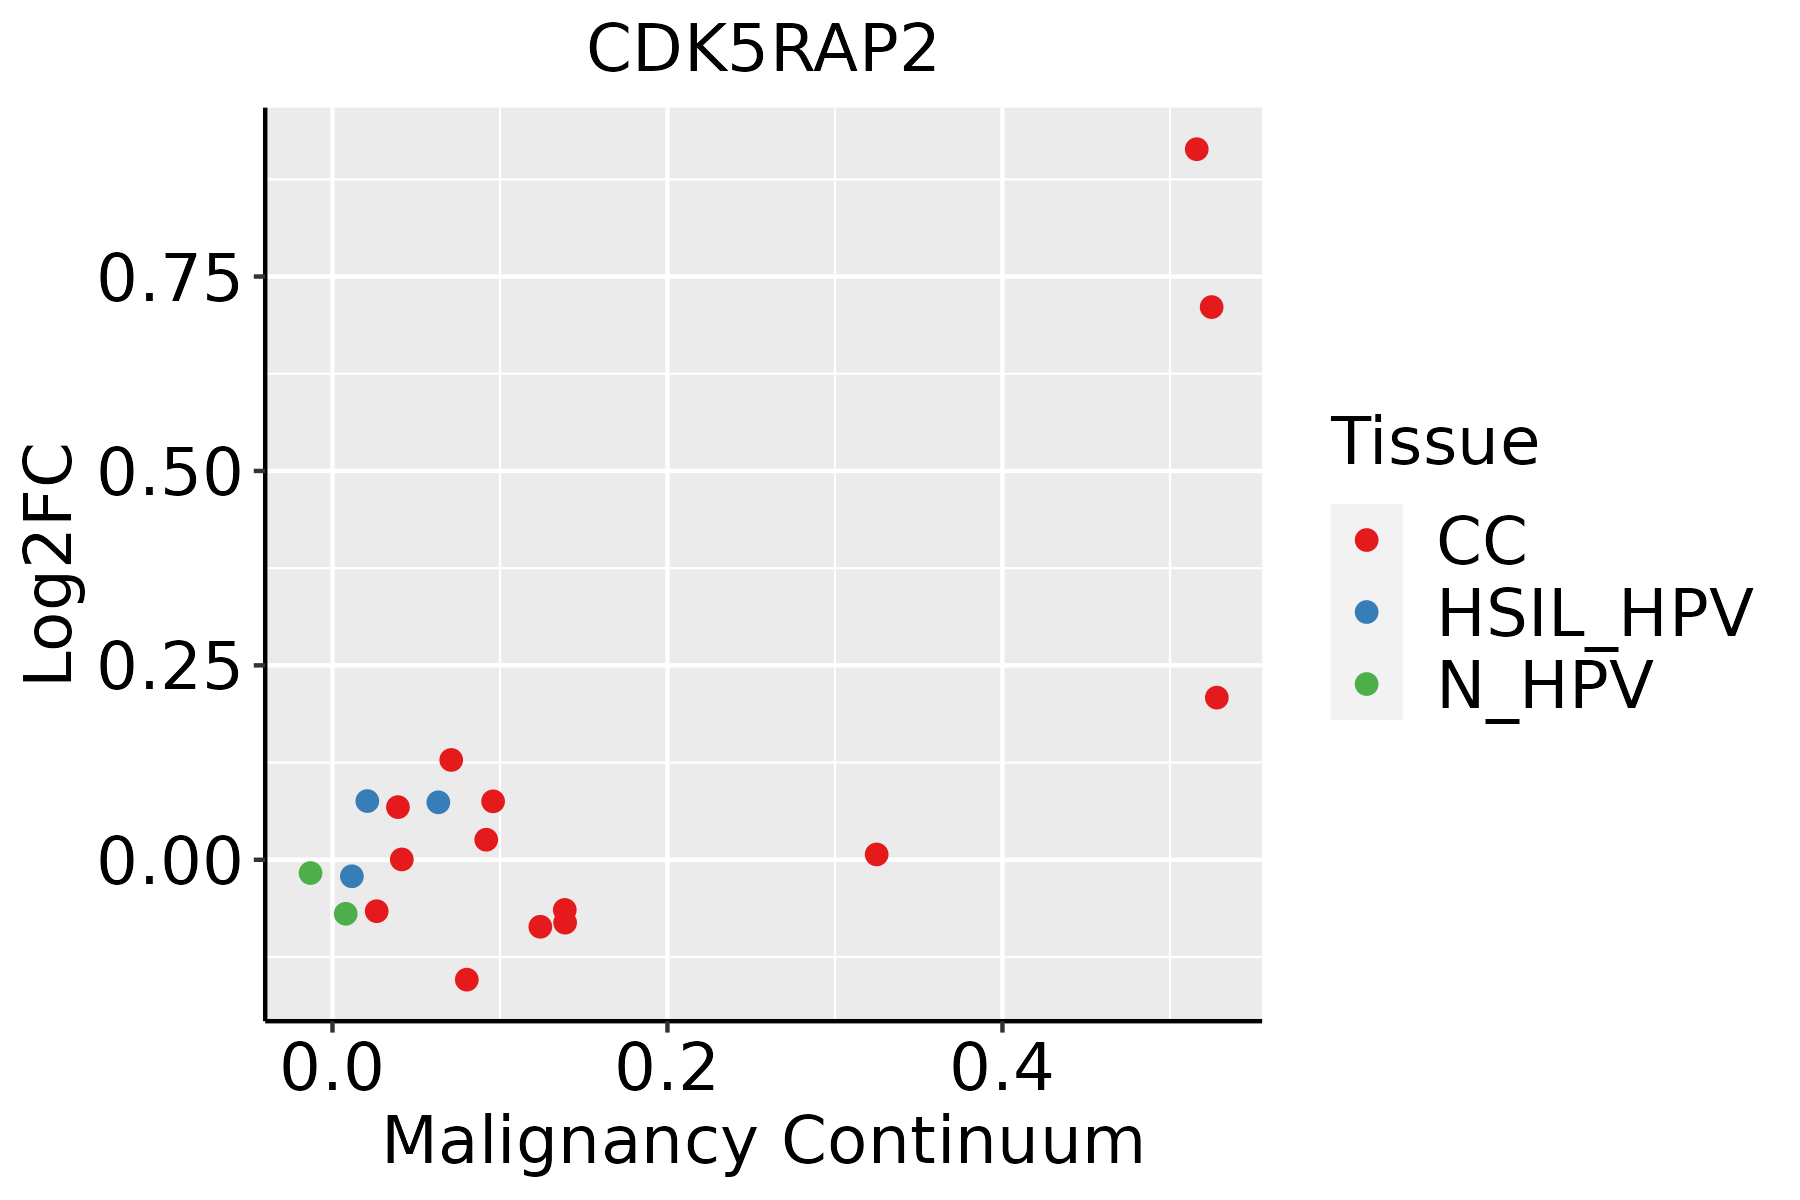 | CC: Cervix cancer |
| HSIL_HPV: HPV-infected high-grade squamous intraepithelial lesions |
| N_HPV: HPV-infected normal cervix |
| Esophagus | 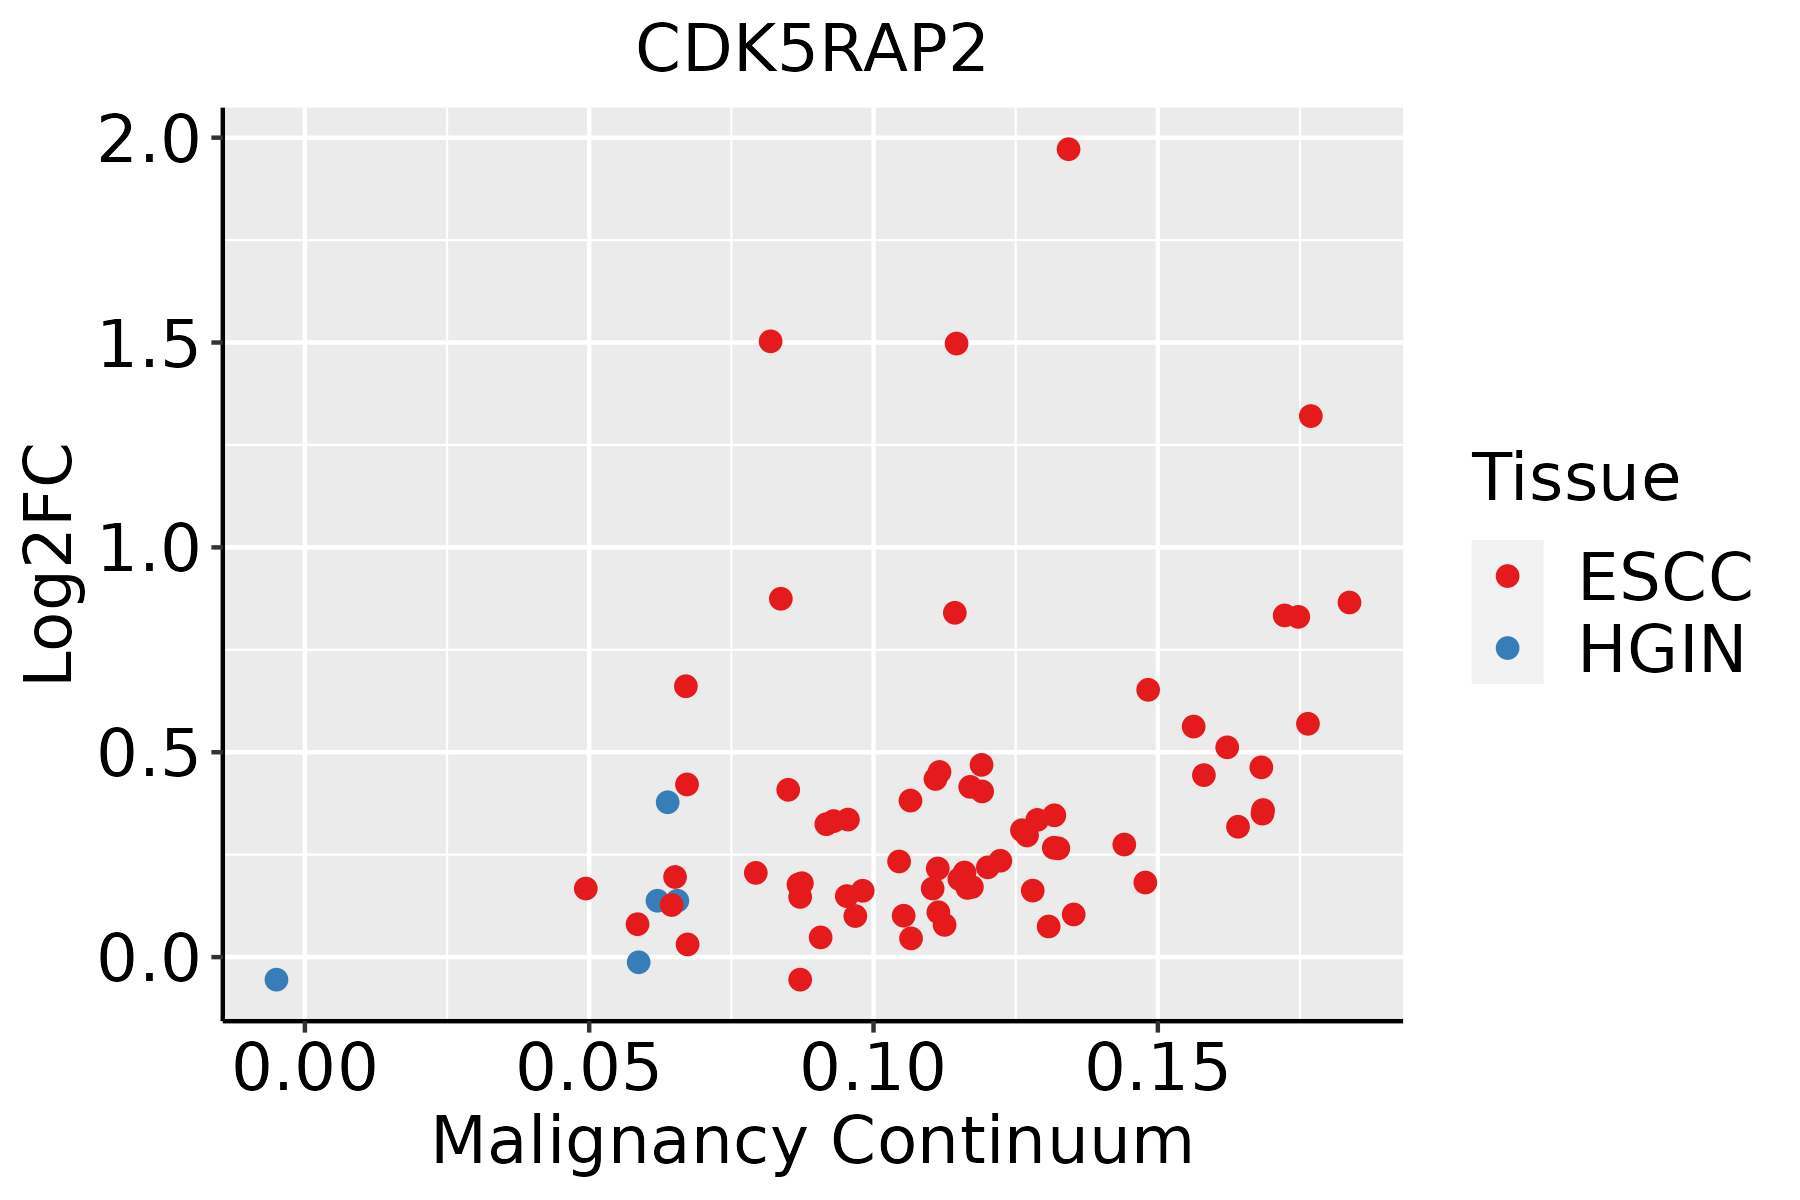 | ESCC: Esophageal squamous cell carcinoma |
| HGIN: High-grade intraepithelial neoplasias |
| LGIN: Low-grade intraepithelial neoplasias |
| Liver | 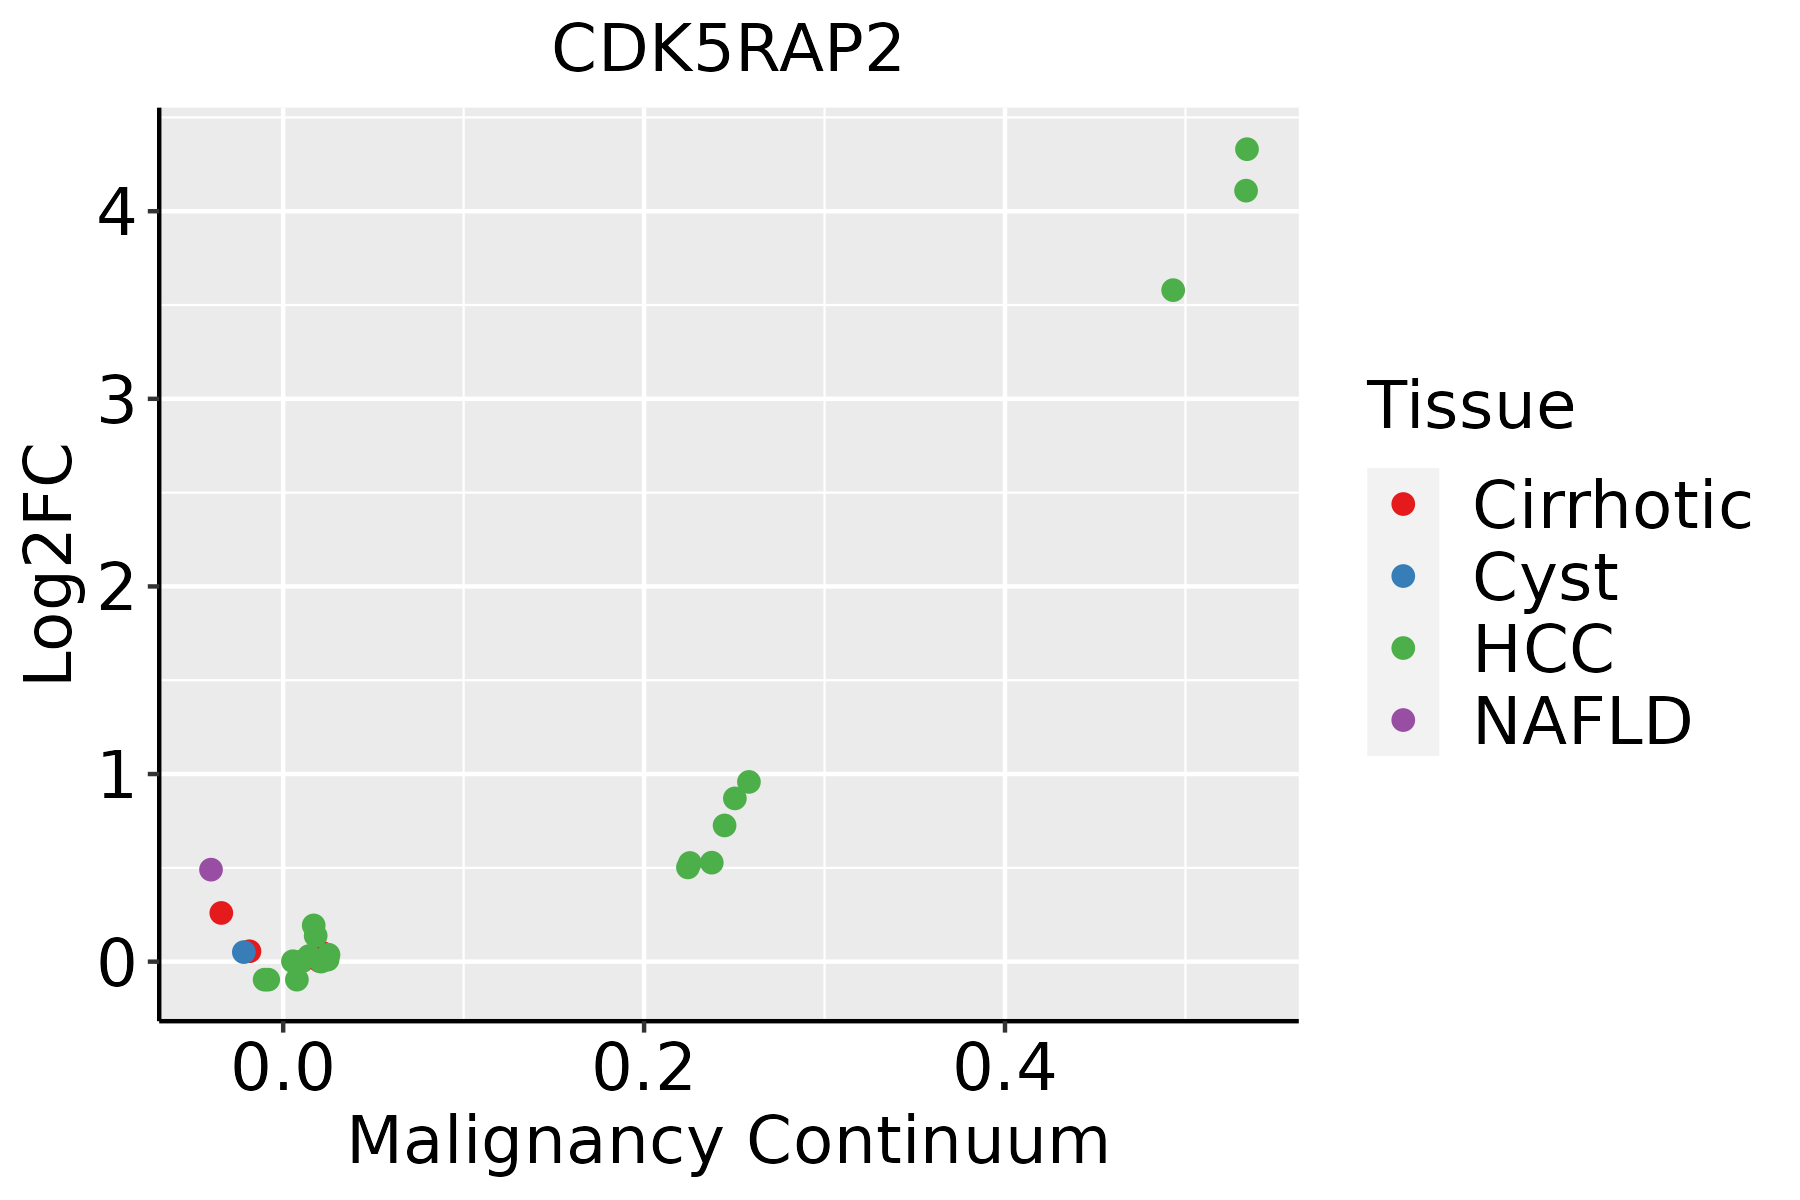 | HCC: Hepatocellular carcinoma |
| NAFLD: Non-alcoholic fatty liver disease |
| Lung | 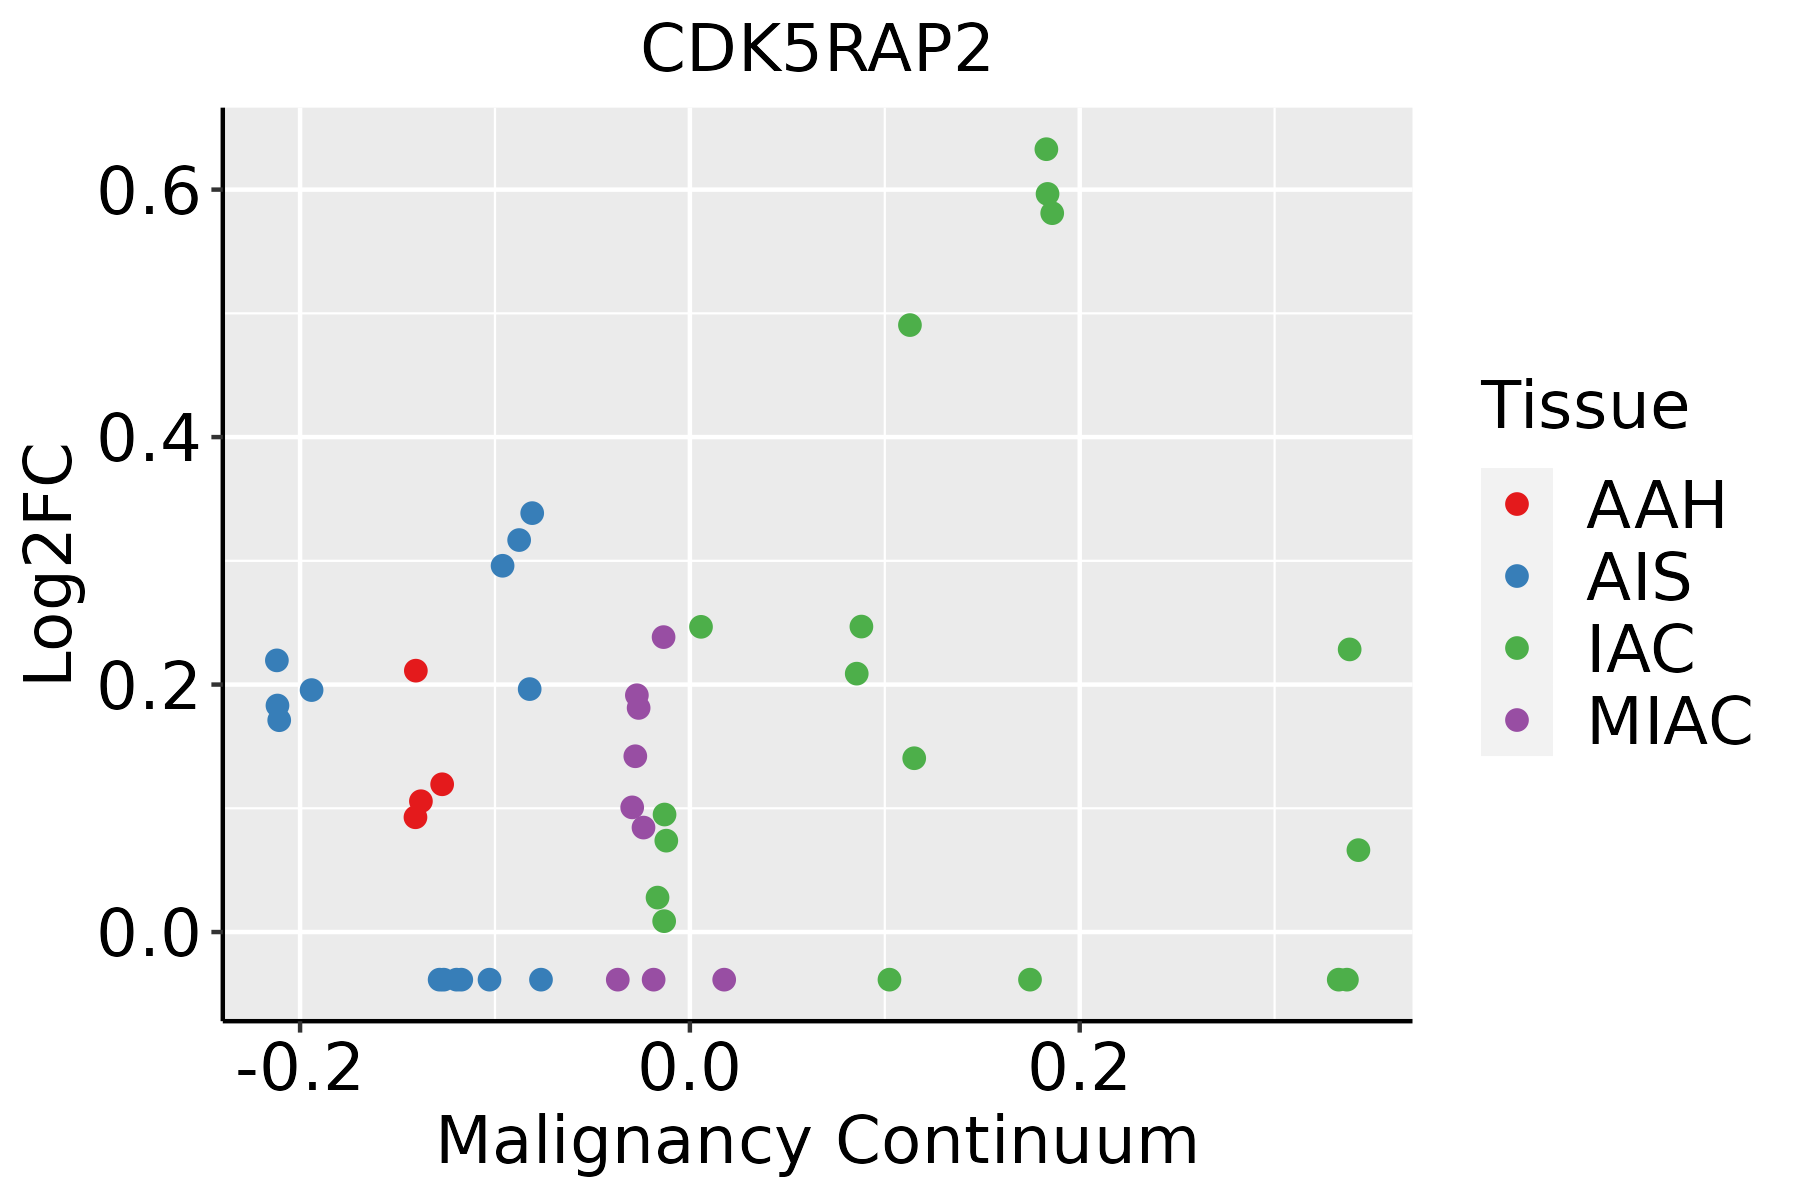 | AAH: Atypical adenomatous hyperplasia |
| AIS: Adenocarcinoma in situ |
| IAC: Invasive lung adenocarcinoma |
| MIA: Minimally invasive adenocarcinoma |
| Oral Cavity | 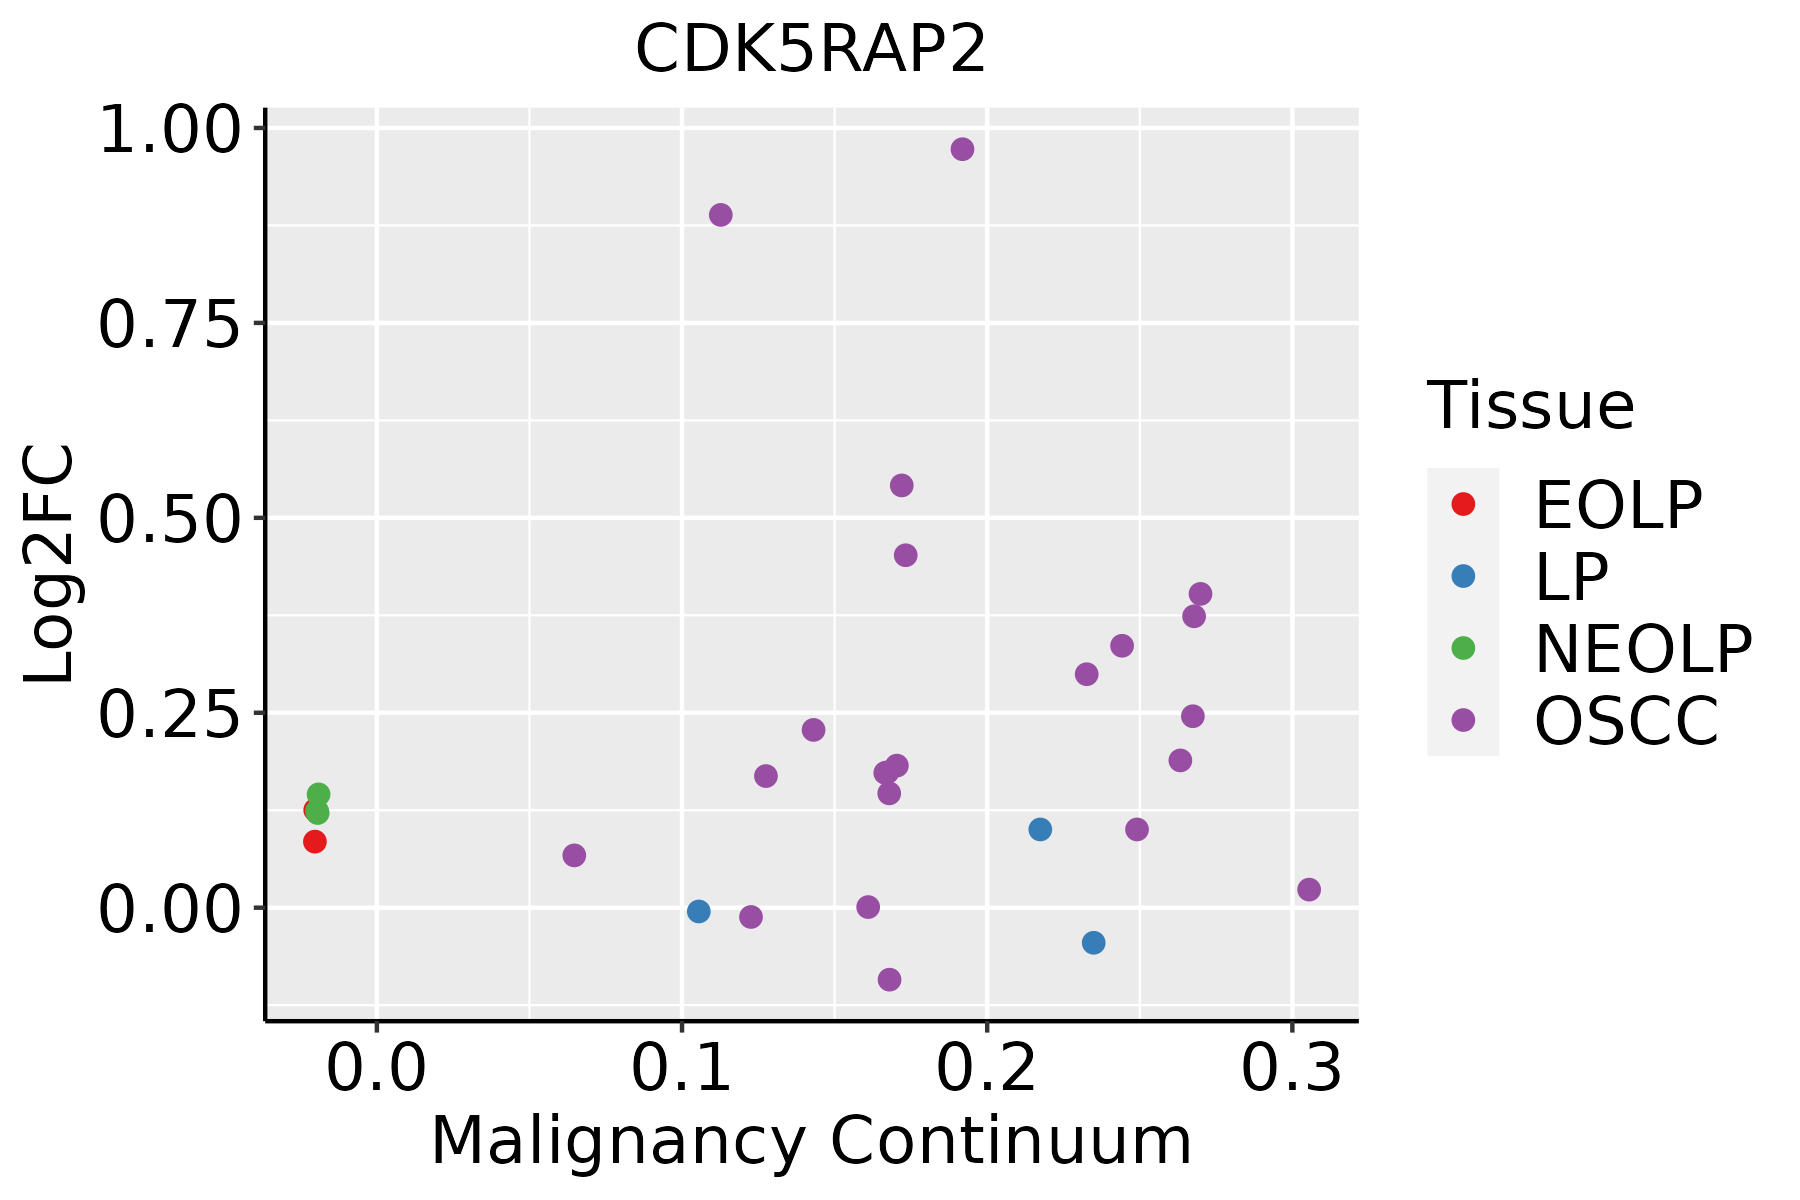 | EOLP: Erosive Oral lichen planus |
| LP: leukoplakia |
| NEOLP: Non-erosive oral lichen planus |
| OSCC: Oral squamous cell carcinoma |
| Prostate | 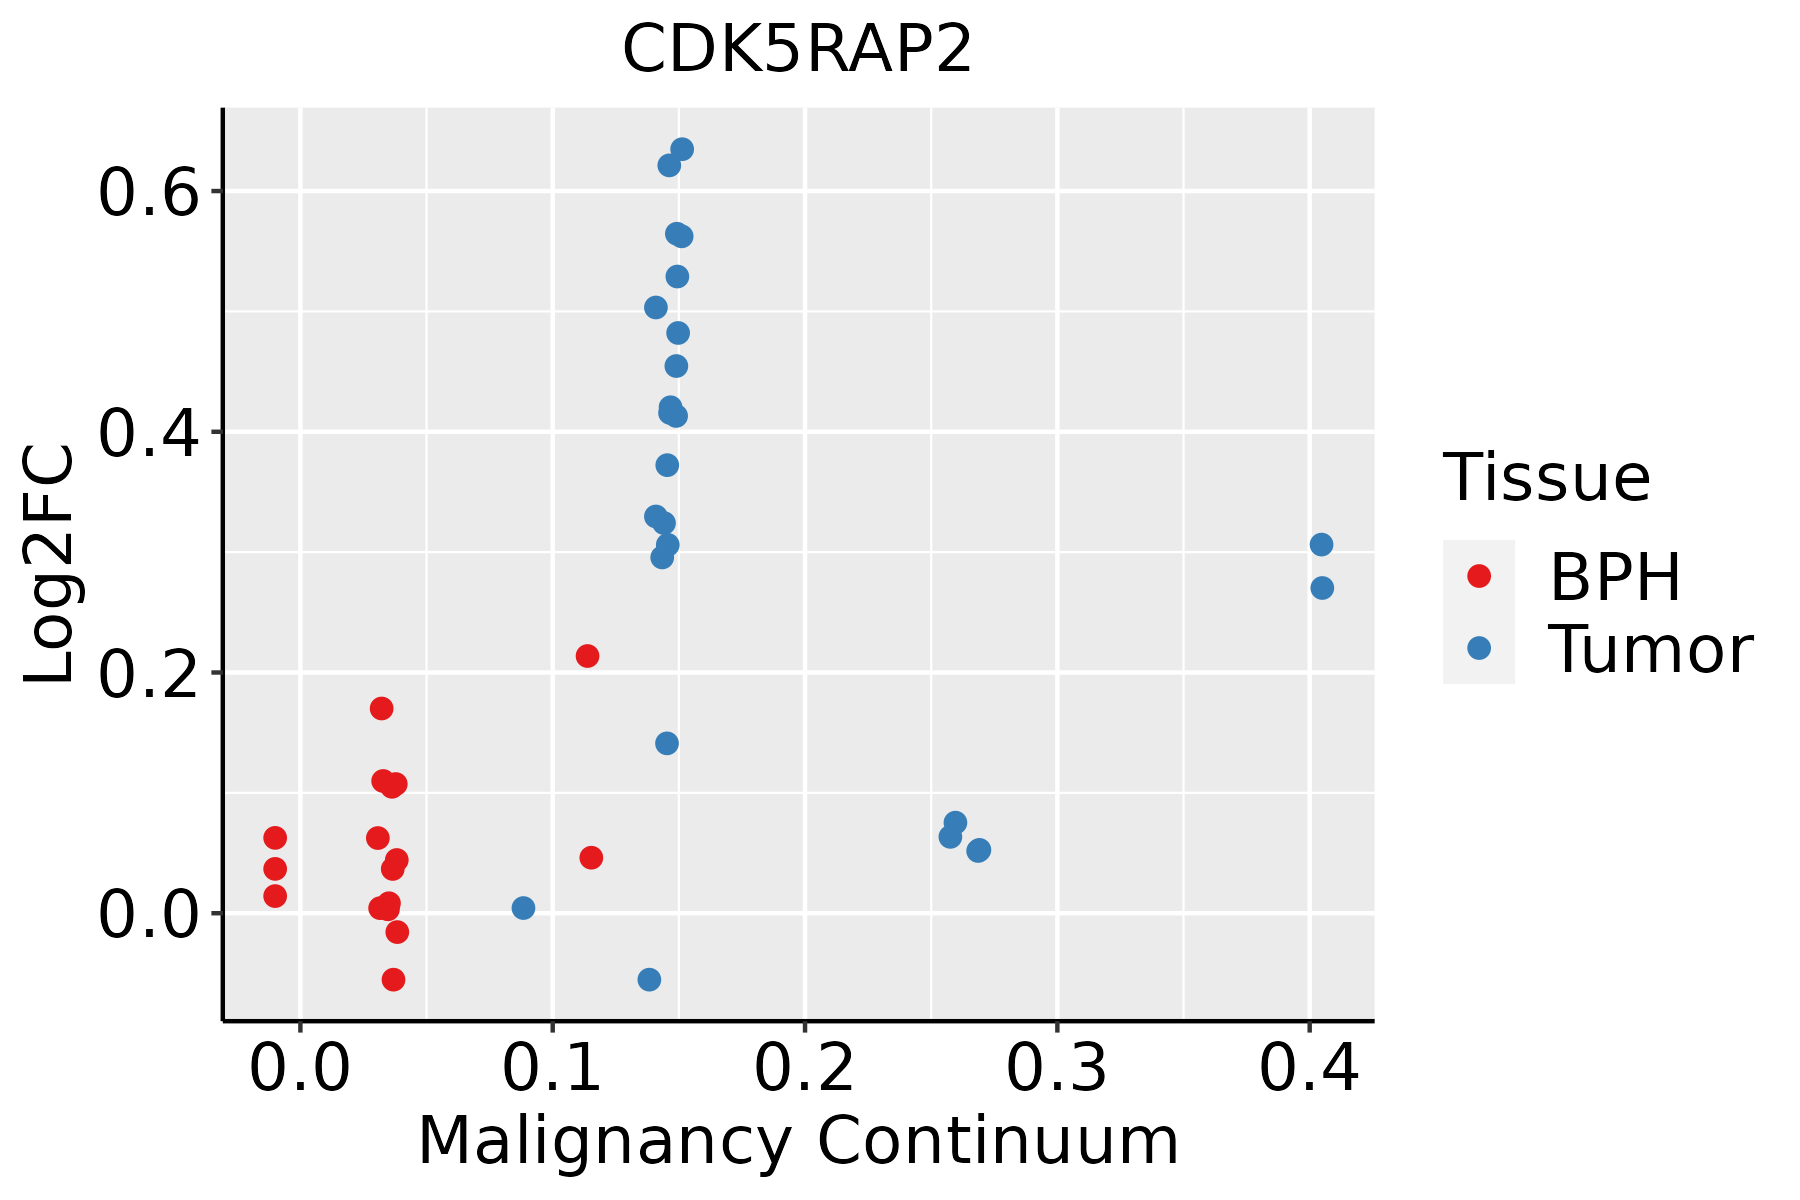 | BPH: Benign Prostatic Hyperplasia |
| Thyroid | 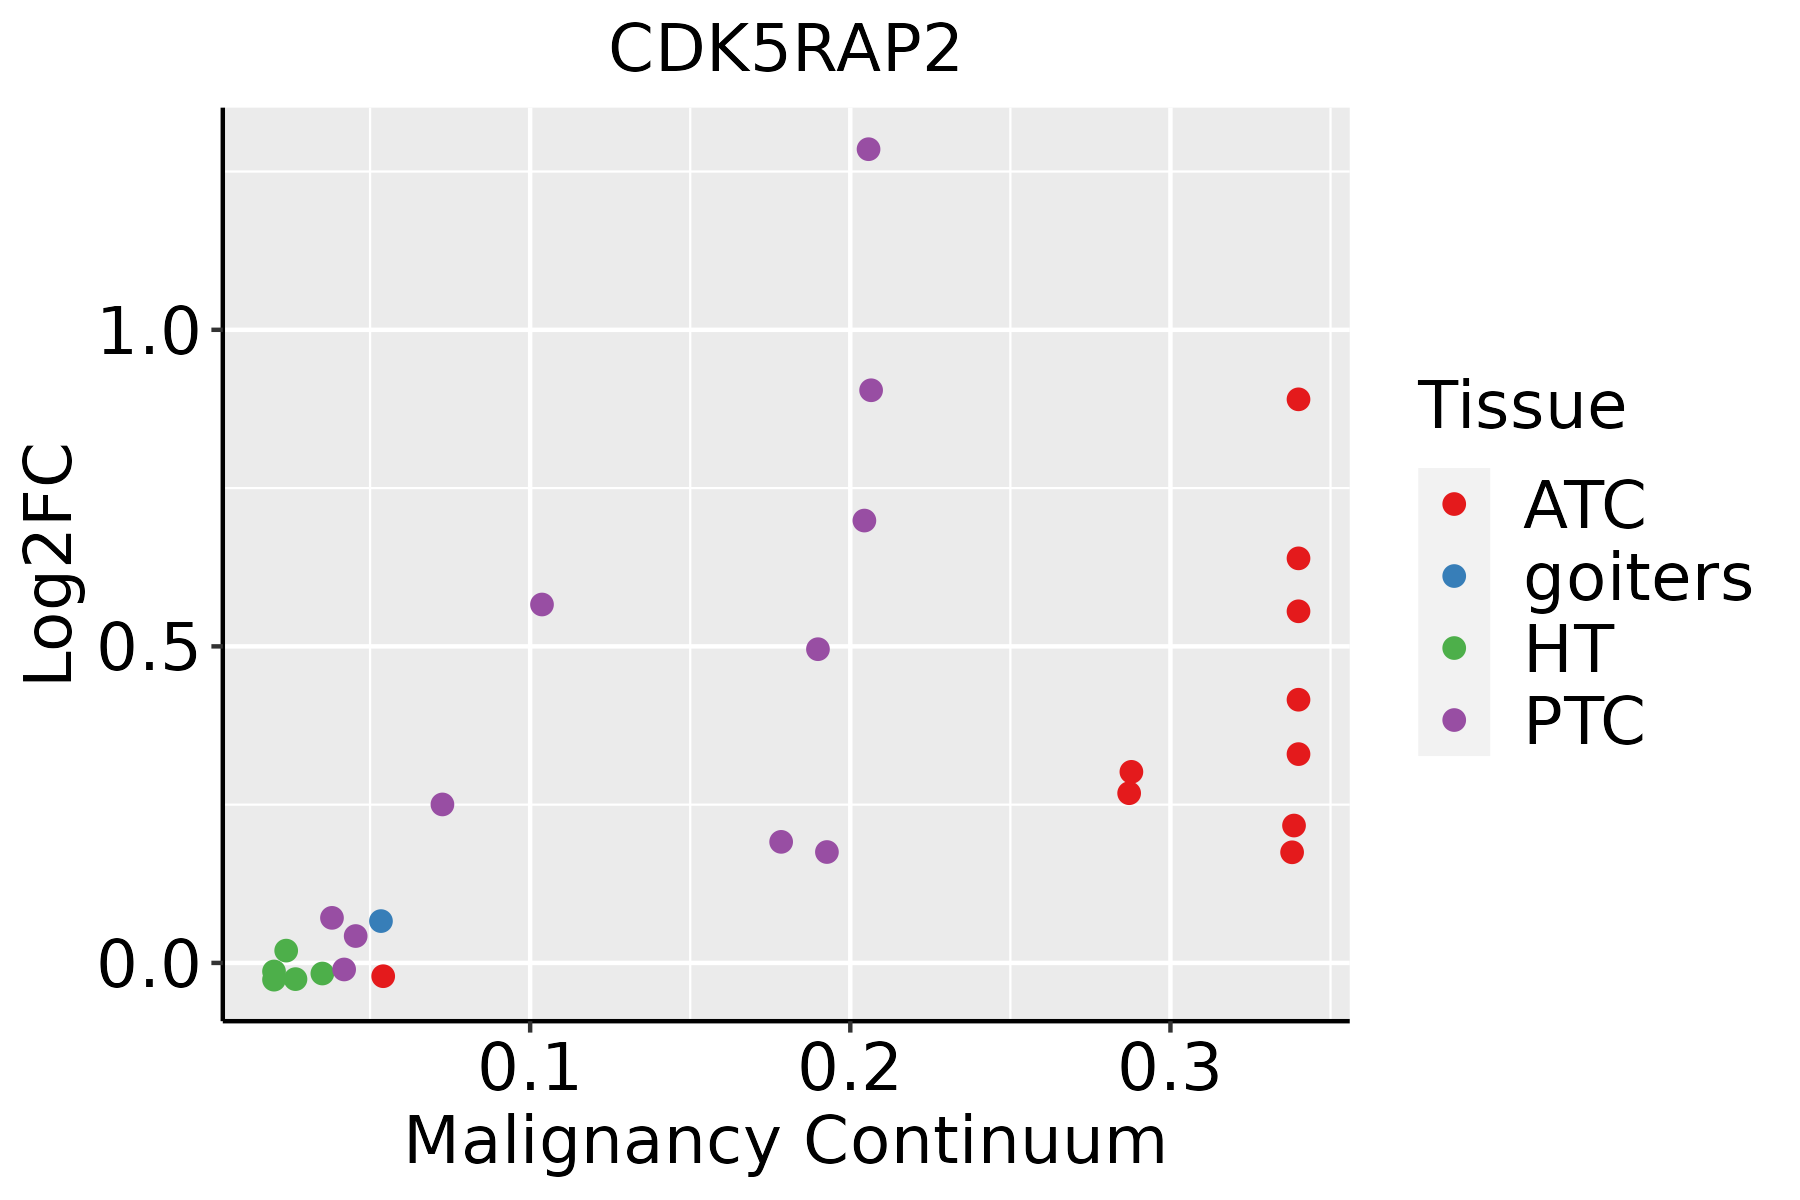 | ATC: Anaplastic thyroid cancer |
| HT: Hashimoto's thyroiditis |
| PTC: Papillary thyroid cancer |
| GO ID | Tissue | Disease Stage | Description | Gene Ratio | Bg Ratio | pvalue | p.adjust | Count |
| GO:00513041 | Oral cavity | OSCC | chromosome separation | 53/7305 | 96/18723 | 9.24e-04 | 4.86e-03 | 53 |
| GO:19021161 | Oral cavity | OSCC | negative regulation of organelle assembly | 26/7305 | 41/18723 | 1.34e-03 | 6.62e-03 | 26 |
| GO:00070941 | Oral cavity | OSCC | mitotic spindle assembly checkpoint | 24/7305 | 38/18723 | 2.21e-03 | 1.00e-02 | 24 |
| GO:00711731 | Oral cavity | OSCC | spindle assembly checkpoint | 24/7305 | 38/18723 | 2.21e-03 | 1.00e-02 | 24 |
| GO:00711741 | Oral cavity | OSCC | mitotic spindle checkpoint | 24/7305 | 38/18723 | 2.21e-03 | 1.00e-02 | 24 |
| GO:00458411 | Oral cavity | OSCC | negative regulation of mitotic metaphase/anaphase transition | 25/7305 | 40/18723 | 2.22e-03 | 1.00e-02 | 25 |
| GO:00328863 | Oral cavity | OSCC | regulation of microtubule-based process | 115/7305 | 240/18723 | 2.95e-03 | 1.28e-02 | 115 |
| GO:00330461 | Oral cavity | OSCC | negative regulation of sister chromatid segregation | 26/7305 | 43/18723 | 3.55e-03 | 1.49e-02 | 26 |
| GO:00330481 | Oral cavity | OSCC | negative regulation of mitotic sister chromatid segregation | 26/7305 | 43/18723 | 3.55e-03 | 1.49e-02 | 26 |
| GO:20008161 | Oral cavity | OSCC | negative regulation of mitotic sister chromatid separation | 26/7305 | 43/18723 | 3.55e-03 | 1.49e-02 | 26 |
| GO:00315771 | Oral cavity | OSCC | spindle checkpoint | 24/7305 | 39/18723 | 3.64e-03 | 1.51e-02 | 24 |
| GO:00070981 | Oral cavity | OSCC | centrosome cycle | 66/7305 | 130/18723 | 4.17e-03 | 1.70e-02 | 66 |
| GO:00311103 | Oral cavity | OSCC | regulation of microtubule polymerization or depolymerization | 47/7305 | 88/18723 | 4.23e-03 | 1.72e-02 | 47 |
| GO:19021001 | Oral cavity | OSCC | negative regulation of metaphase/anaphase transition of cell cycle | 25/7305 | 42/18723 | 5.63e-03 | 2.17e-02 | 25 |
| GO:00519851 | Oral cavity | OSCC | negative regulation of chromosome segregation | 26/7305 | 45/18723 | 8.23e-03 | 3.00e-02 | 26 |
| GO:19058191 | Oral cavity | OSCC | negative regulation of chromosome separation | 26/7305 | 45/18723 | 8.23e-03 | 3.00e-02 | 26 |
| GO:0051294 | Oral cavity | OSCC | establishment of spindle orientation | 22/7305 | 37/18723 | 9.34e-03 | 3.34e-02 | 22 |
| GO:00516532 | Oral cavity | OSCC | spindle localization | 31/7305 | 56/18723 | 9.53e-03 | 3.39e-02 | 31 |
| GO:0040001 | Oral cavity | OSCC | establishment of mitotic spindle localization | 21/7305 | 35/18723 | 9.58e-03 | 3.40e-02 | 21 |
| GO:00310232 | Oral cavity | OSCC | microtubule organizing center organization | 70/7305 | 143/18723 | 9.71e-03 | 3.44e-02 | 70 |
| Hugo Symbol | Variant Class | Variant Classification | dbSNP RS | HGVSc | HGVSp | HGVSp Short | SWISSPROT | BIOTYPE | SIFT | PolyPhen | Tumor Sample Barcode | Tissue | Histology | Sex | Age | Stage | Therapy Types | Drugs | Outcome |
| CDK5RAP2 | SNV | Missense_Mutation | | c.1209N>C | p.Lys403Asn | p.K403N | Q96SN8 | protein_coding | deleterious(0.01) | possibly_damaging(0.601) | TCGA-A2-A04W-01 | Breast | breast invasive carcinoma | Female | <65 | I/II | Chemotherapy | cytoxan | SD |
| CDK5RAP2 | SNV | Missense_Mutation | rs746903524 | c.2836C>T | p.Arg946Trp | p.R946W | Q96SN8 | protein_coding | deleterious(0.02) | benign(0.23) | TCGA-A2-A0YI-01 | Breast | breast invasive carcinoma | Female | <65 | I/II | Unspecific | Femara | SD |
| CDK5RAP2 | SNV | Missense_Mutation | rs151280101 | c.1488C>A | p.Phe496Leu | p.F496L | Q96SN8 | protein_coding | tolerated(1) | benign(0) | TCGA-A2-A0YM-01 | Breast | breast invasive carcinoma | Female | >=65 | I/II | Unknown | Unknown | SD |
| CDK5RAP2 | SNV | Missense_Mutation | novel | c.4591N>A | p.Gln1531Lys | p.Q1531K | Q96SN8 | protein_coding | tolerated(0.17) | benign(0.007) | TCGA-A2-A25A-01 | Breast | breast invasive carcinoma | Female | <65 | I/II | Unspecific | Cytoxan | SD |
| CDK5RAP2 | SNV | Missense_Mutation | | c.4539C>A | p.Ser1513Arg | p.S1513R | Q96SN8 | protein_coding | tolerated(0.19) | benign(0.003) | TCGA-A7-A4SD-01 | Breast | breast invasive carcinoma | Female | <65 | I/II | Chemotherapy | taxotere | CR |
| CDK5RAP2 | SNV | Missense_Mutation | novel | c.920N>A | p.Ala307Asp | p.A307D | Q96SN8 | protein_coding | deleterious(0.01) | possibly_damaging(0.532) | TCGA-A7-A6VV-01 | Breast | breast invasive carcinoma | Female | <65 | I/II | Chemotherapy | cyclophosphamide | CR |
| CDK5RAP2 | SNV | Missense_Mutation | | c.1201A>C | p.Ile401Leu | p.I401L | Q96SN8 | protein_coding | tolerated(0.19) | benign(0.006) | TCGA-AN-A0AR-01 | Breast | breast invasive carcinoma | Female | <65 | I/II | Unknown | Unknown | SD |
| CDK5RAP2 | SNV | Missense_Mutation | | c.1894T>G | p.Tyr632Asp | p.Y632D | Q96SN8 | protein_coding | deleterious(0) | probably_damaging(0.997) | TCGA-B6-A0I9-01 | Breast | breast invasive carcinoma | Female | <65 | III/IV | Unknown | Unknown | PD |
| CDK5RAP2 | SNV | Missense_Mutation | novel | c.314N>G | p.Glu105Gly | p.E105G | Q96SN8 | protein_coding | deleterious(0) | probably_damaging(0.999) | TCGA-BH-A0BV-01 | Breast | breast invasive carcinoma | Female | >=65 | I/II | Chemotherapy | doxorubicin | SD |
| CDK5RAP2 | SNV | Missense_Mutation | | c.5248N>A | p.Glu1750Lys | p.E1750K | Q96SN8 | protein_coding | tolerated(0.15) | benign(0.033) | TCGA-BH-A0HF-01 | Breast | breast invasive carcinoma | Female | >=65 | I/II | Hormone Therapy | arimidex | SD |


