
|
|||||
|
 | |
| |
| |
| |
| |
| |
|
Gene: CCNB1 |
Gene summary for CCNB1 |
| Gene information | Species | Human | Gene symbol | CCNB1 | Gene ID | 891 |
| Gene name | cyclin B1 | |
| Gene Alias | CCNB | |
| Cytomap | 5q13.2 | |
| Gene Type | protein-coding | GO ID | GO:0000003 | UniProtAcc | P14635 |
Top |
Malignant transformation analysis |
| Identification of the aberrant gene expression in precancerous and cancerous lesions by comparing the gene expression of stem-like cells in diseased tissues with normal stem cells |
| Entrez ID | Symbol | Replicates | Species | Organ | Tissue | Adj P-value | Log2FC | Malignancy |
| 891 | CCNB1 | LZE2T | Human | Esophagus | ESCC | 2.32e-07 | 1.83e+00 | 0.082 |
| 891 | CCNB1 | LZE24T | Human | Esophagus | ESCC | 2.60e-07 | 4.61e-01 | 0.0596 |
| 891 | CCNB1 | LZE6T | Human | Esophagus | ESCC | 1.81e-10 | 5.92e-01 | 0.0845 |
| 891 | CCNB1 | P2T-E | Human | Esophagus | ESCC | 6.27e-26 | 1.41e+00 | 0.1177 |
| 891 | CCNB1 | P4T-E | Human | Esophagus | ESCC | 5.96e-25 | 1.14e+00 | 0.1323 |
| 891 | CCNB1 | P5T-E | Human | Esophagus | ESCC | 3.71e-18 | 7.94e-01 | 0.1327 |
| 891 | CCNB1 | P8T-E | Human | Esophagus | ESCC | 1.72e-05 | 3.14e-01 | 0.0889 |
| 891 | CCNB1 | P9T-E | Human | Esophagus | ESCC | 3.61e-12 | 8.60e-01 | 0.1131 |
| 891 | CCNB1 | P10T-E | Human | Esophagus | ESCC | 2.38e-08 | 6.38e-01 | 0.116 |
| 891 | CCNB1 | P11T-E | Human | Esophagus | ESCC | 2.49e-04 | 7.35e-01 | 0.1426 |
| 891 | CCNB1 | P12T-E | Human | Esophagus | ESCC | 1.88e-05 | 3.79e-01 | 0.1122 |
| 891 | CCNB1 | P15T-E | Human | Esophagus | ESCC | 4.63e-09 | 7.82e-01 | 0.1149 |
| 891 | CCNB1 | P16T-E | Human | Esophagus | ESCC | 2.75e-07 | 3.43e-01 | 0.1153 |
| 891 | CCNB1 | P17T-E | Human | Esophagus | ESCC | 3.33e-09 | 1.25e+00 | 0.1278 |
| 891 | CCNB1 | P19T-E | Human | Esophagus | ESCC | 1.07e-06 | 1.54e+00 | 0.1662 |
| 891 | CCNB1 | P20T-E | Human | Esophagus | ESCC | 2.13e-08 | 6.87e-01 | 0.1124 |
| 891 | CCNB1 | P21T-E | Human | Esophagus | ESCC | 3.70e-18 | 1.32e+00 | 0.1617 |
| 891 | CCNB1 | P22T-E | Human | Esophagus | ESCC | 4.14e-13 | 7.51e-01 | 0.1236 |
| 891 | CCNB1 | P23T-E | Human | Esophagus | ESCC | 2.88e-04 | 6.08e-01 | 0.108 |
| 891 | CCNB1 | P24T-E | Human | Esophagus | ESCC | 4.71e-16 | 1.06e+00 | 0.1287 |
| Page: 1 2 3 4 5 |
| Tissue | Expression Dynamics | Abbreviation |
| Esophagus | 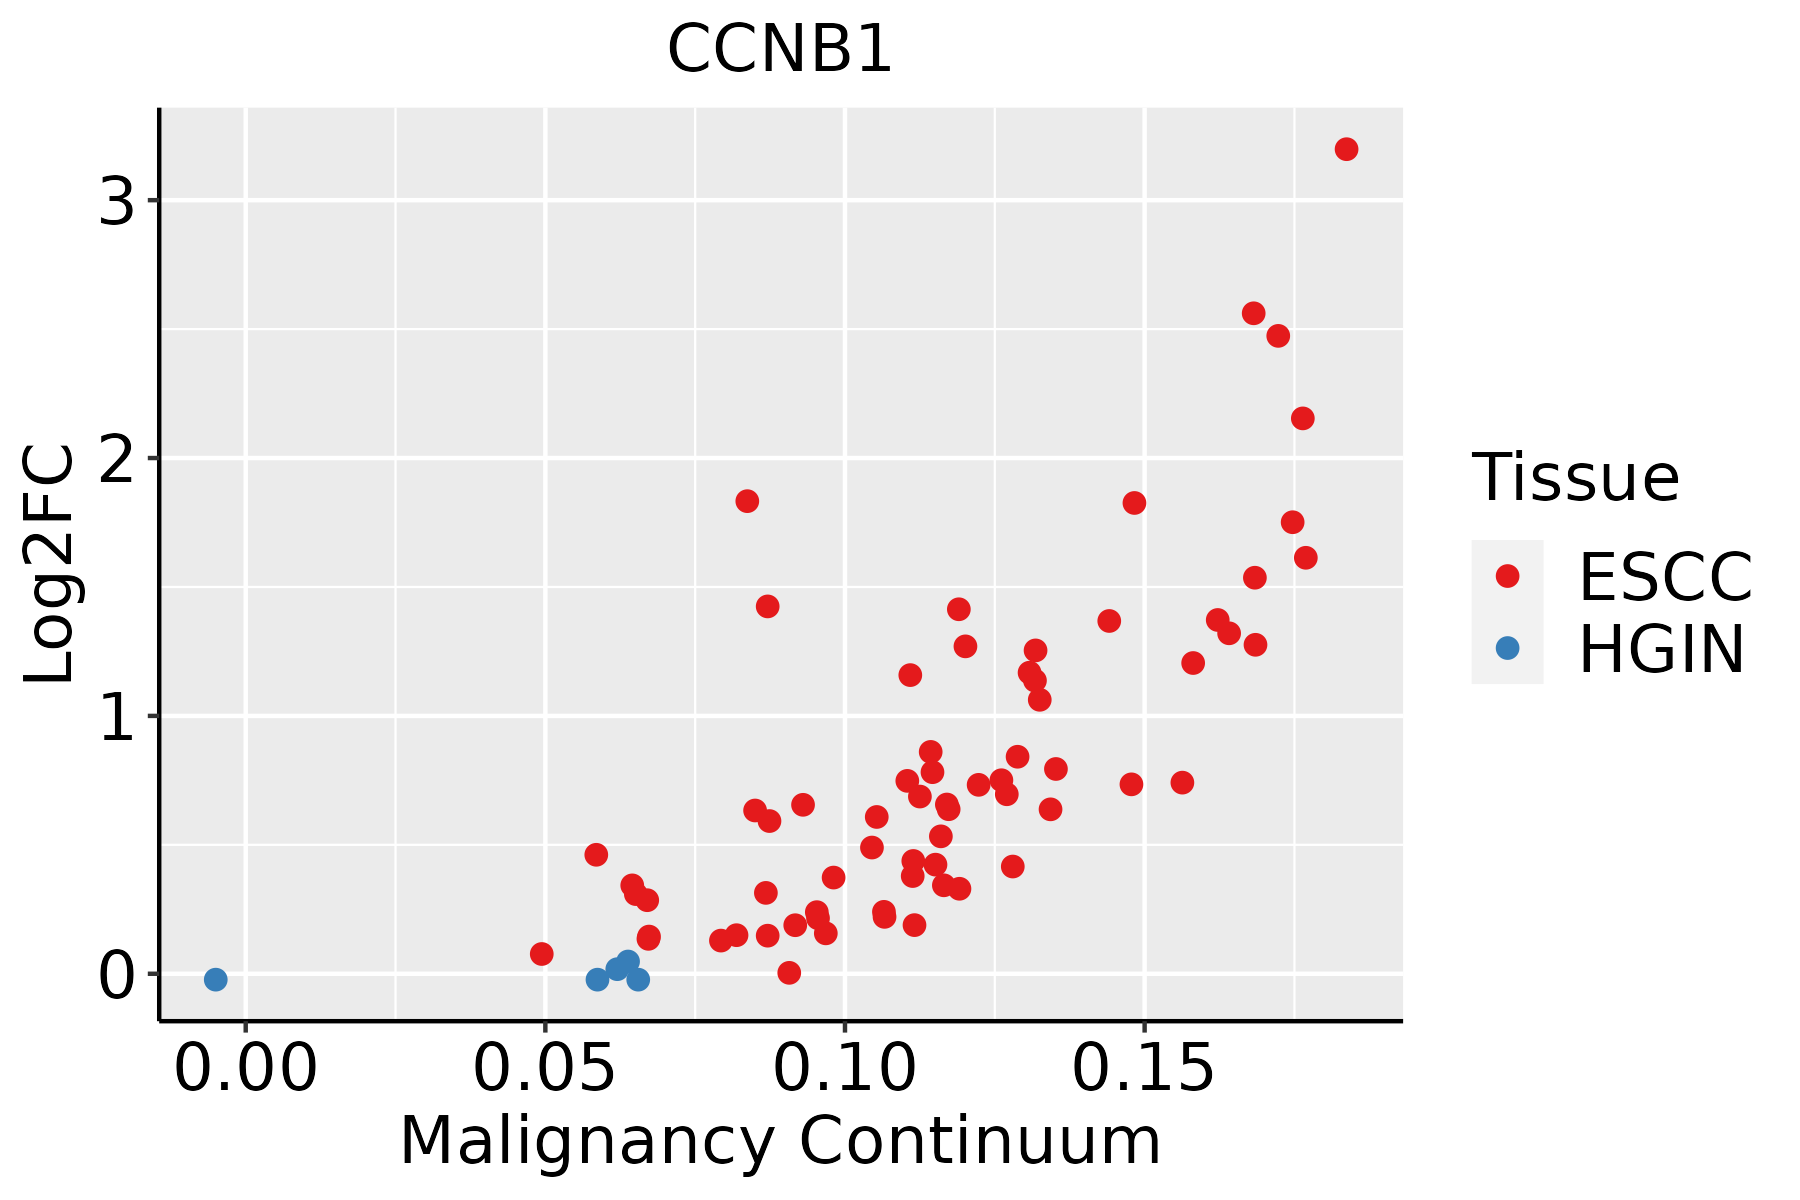 | ESCC: Esophageal squamous cell carcinoma |
| HGIN: High-grade intraepithelial neoplasias | ||
| LGIN: Low-grade intraepithelial neoplasias | ||
| Liver |  | HCC: Hepatocellular carcinoma |
| NAFLD: Non-alcoholic fatty liver disease | ||
| Oral Cavity | 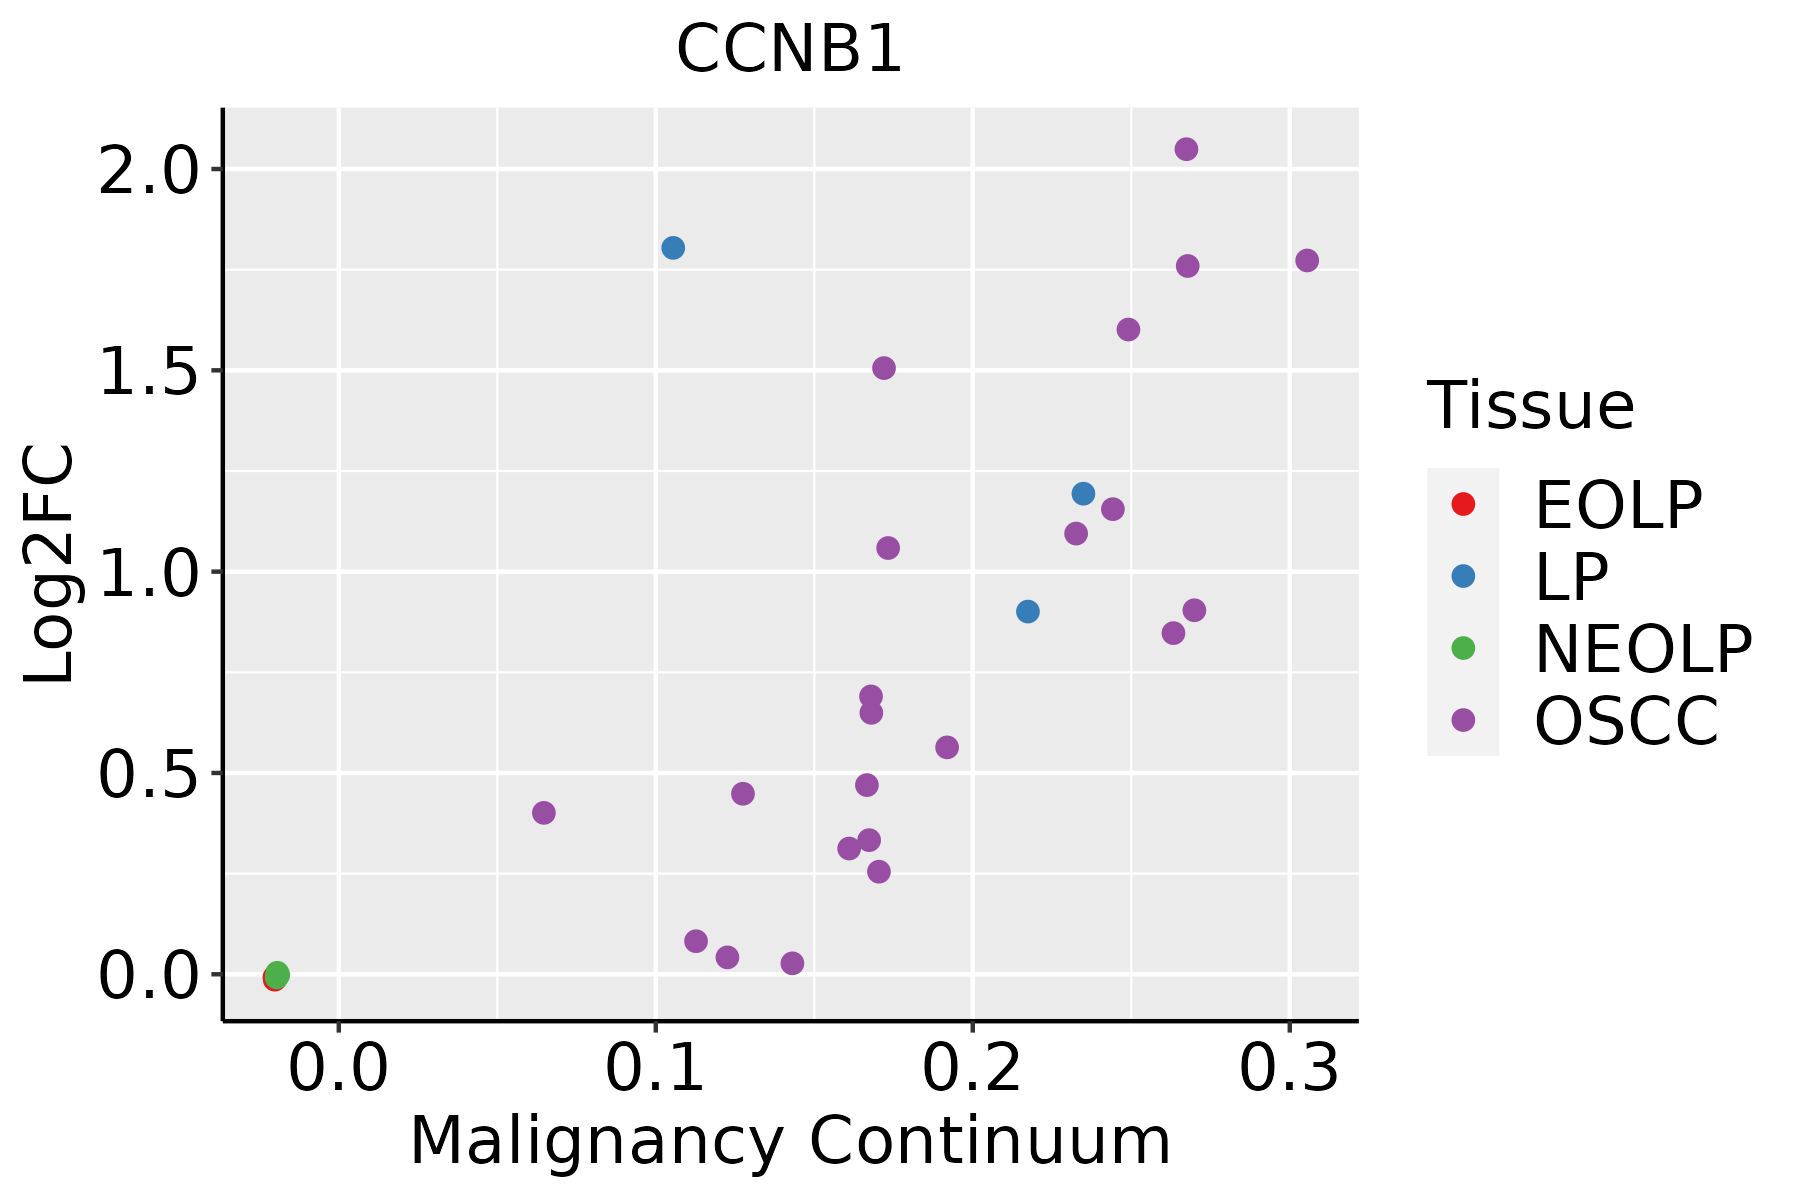 | EOLP: Erosive Oral lichen planus |
| LP: leukoplakia | ||
| NEOLP: Non-erosive oral lichen planus | ||
| OSCC: Oral squamous cell carcinoma | ||
| Skin | 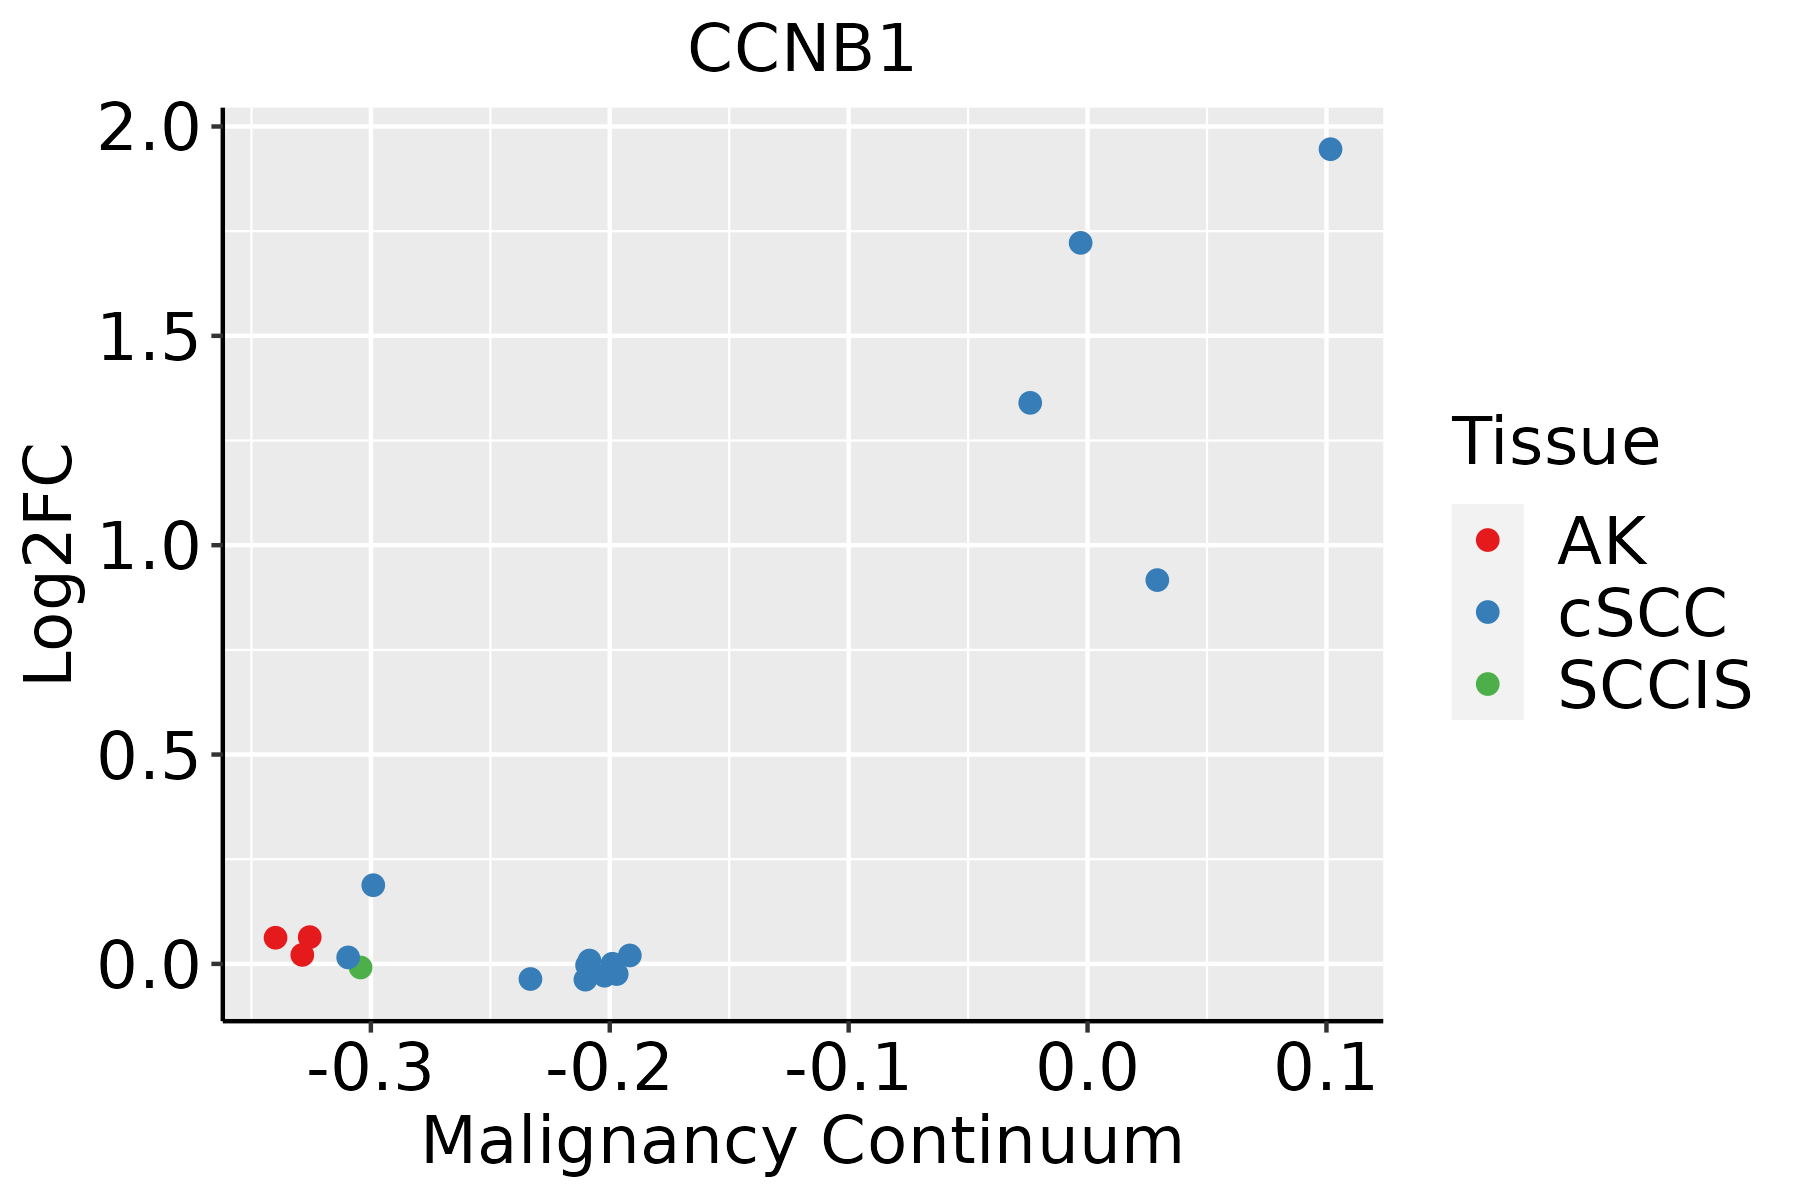 | AK: Actinic keratosis |
| cSCC: Cutaneous squamous cell carcinoma | ||
| SCCIS:squamous cell carcinoma in situ | ||
| Thyroid | 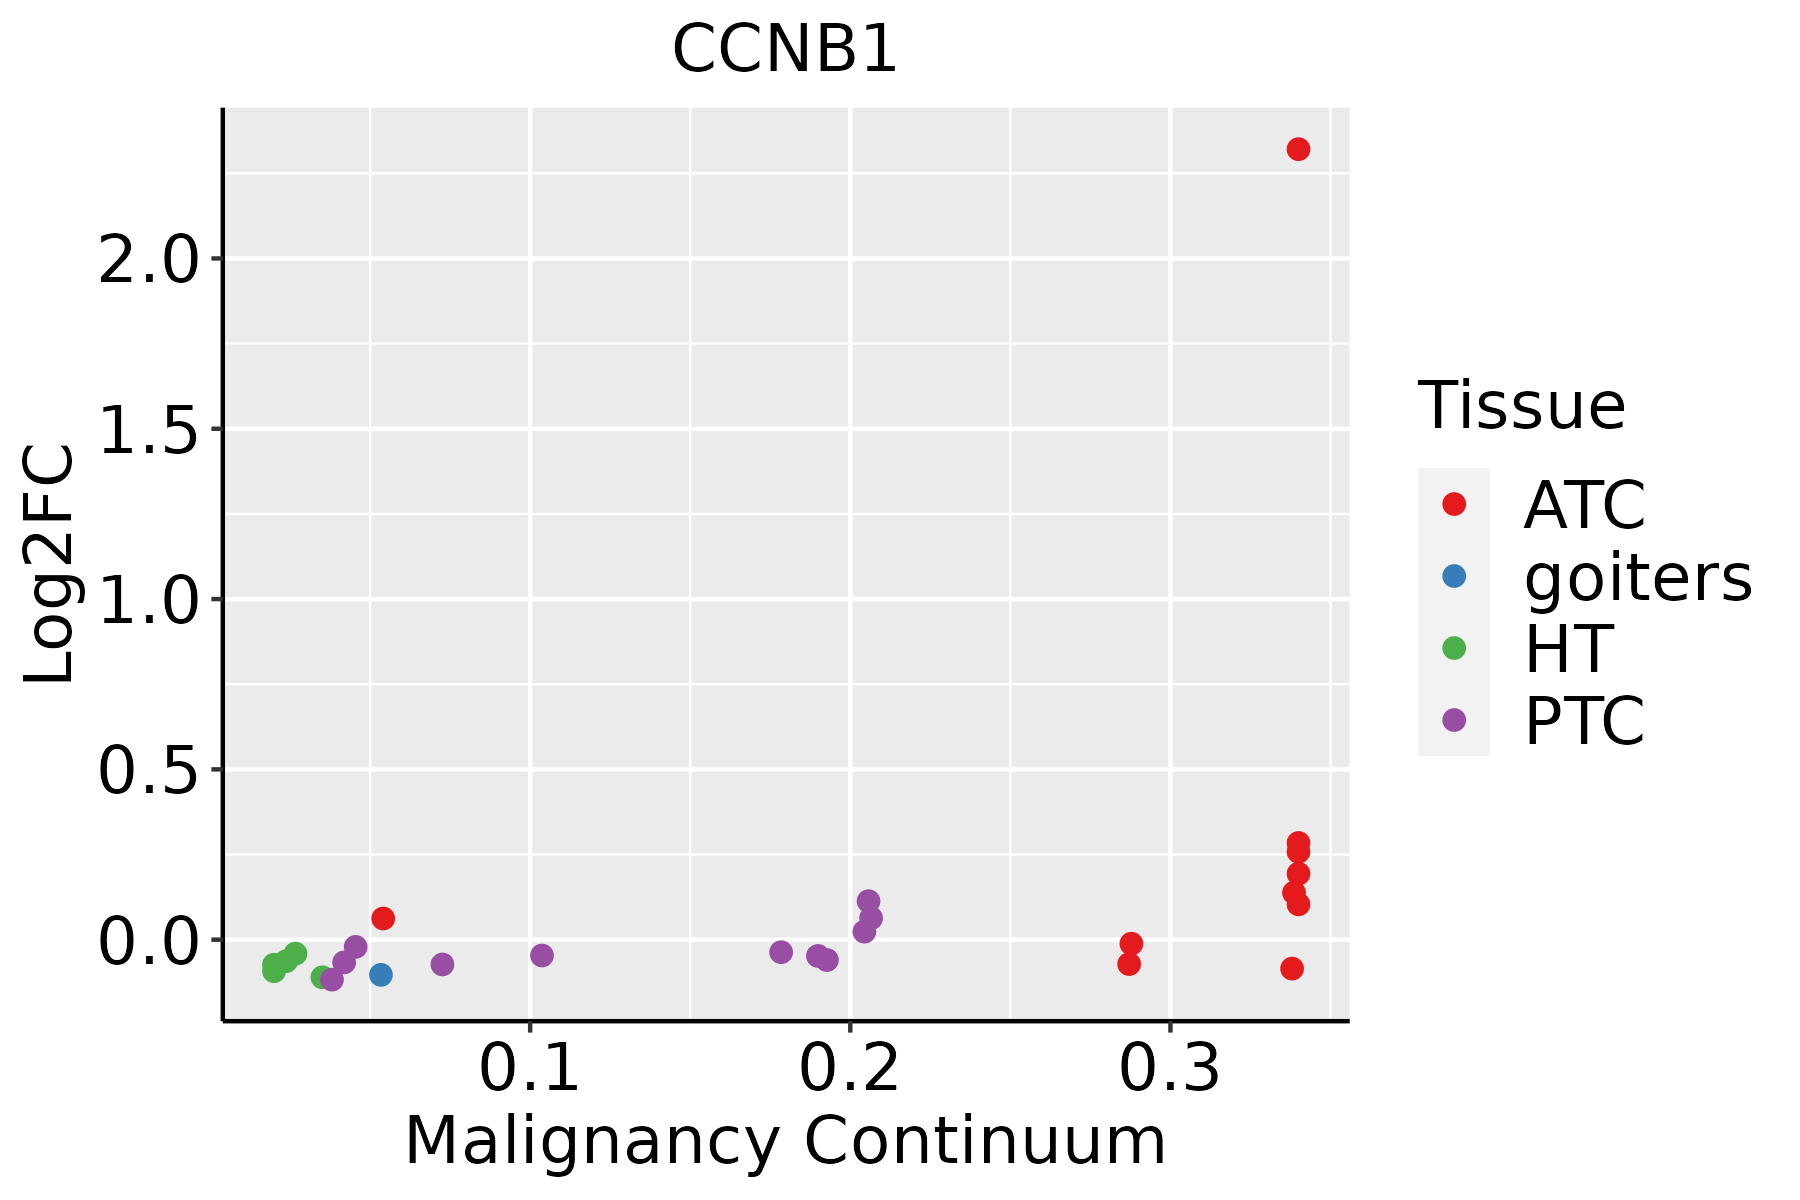 | ATC: Anaplastic thyroid cancer |
| HT: Hashimoto's thyroiditis | ||
| PTC: Papillary thyroid cancer |
| ∗log2FC in expression of this searched gene in stem-like cells from each diseased tissue sample relative to stem-like cells in normal samples in each tissue plotted against the malignancy continuum. Samples are colored based on if they are from different disease stage. |
Top |
Malignant transformation related pathway analysis |
| Find out the enriched GO biological processes and KEGG pathways involved in transition from healthy to precancer to cancer |
| Tissue | Disease Stage | Enriched GO biological Processes |
| Colorectum | AD |  |
| Colorectum | SER |  |
| Colorectum | MSS |  |
| Colorectum | MSI-H |  |
| Colorectum | FAP |  |
| ∗Top 15 enriched GO BP terms are showed in the bar plot of each disease state in each tissue. Each row represents a significant GO biological process which is colored according to the -log10(p.adjust). |
| Page: 1 2 3 4 5 6 7 8 9 |
| GO ID | Tissue | Disease Stage | Description | Gene Ratio | Bg Ratio | pvalue | p.adjust | Count |
| GO:19028506 | Oral cavity | OSCC | microtubule cytoskeleton organization involved in mitosis | 99/7305 | 147/18723 | 2.94e-12 | 1.18e-10 | 99 |
| GO:00482852 | Oral cavity | OSCC | organelle fission | 265/7305 | 488/18723 | 3.22e-12 | 1.27e-10 | 265 |
| GO:000170116 | Oral cavity | OSCC | in utero embryonic development | 207/7305 | 367/18723 | 7.92e-12 | 2.95e-10 | 207 |
| GO:00070517 | Oral cavity | OSCC | spindle organization | 117/7305 | 184/18723 | 1.16e-11 | 4.17e-10 | 117 |
| GO:19033139 | Oral cavity | OSCC | positive regulation of mRNA metabolic process | 82/7305 | 118/18723 | 1.77e-11 | 6.13e-10 | 82 |
| GO:000166619 | Oral cavity | OSCC | response to hypoxia | 177/7305 | 307/18723 | 2.21e-11 | 7.50e-10 | 177 |
| GO:004232619 | Oral cavity | OSCC | negative regulation of phosphorylation | 214/7305 | 385/18723 | 2.30e-11 | 7.74e-10 | 214 |
| GO:19019905 | Oral cavity | OSCC | regulation of mitotic cell cycle phase transition | 173/7305 | 299/18723 | 2.49e-11 | 8.35e-10 | 173 |
| GO:007190010 | Oral cavity | OSCC | regulation of protein serine/threonine kinase activity | 201/7305 | 359/18723 | 3.90e-11 | 1.27e-09 | 201 |
| GO:00070802 | Oral cavity | OSCC | mitotic metaphase plate congression | 42/7305 | 50/18723 | 7.48e-11 | 2.30e-09 | 42 |
| GO:00002801 | Oral cavity | OSCC | nuclear division | 237/7305 | 439/18723 | 9.62e-11 | 2.90e-09 | 237 |
| GO:003629319 | Oral cavity | OSCC | response to decreased oxygen levels | 182/7305 | 322/18723 | 1.14e-10 | 3.41e-09 | 182 |
| GO:00311242 | Oral cavity | OSCC | mRNA 3'-end processing | 49/7305 | 62/18723 | 1.40e-10 | 4.14e-09 | 49 |
| GO:00988132 | Oral cavity | OSCC | nuclear chromosome segregation | 162/7305 | 281/18723 | 1.56e-10 | 4.56e-09 | 162 |
| GO:000193319 | Oral cavity | OSCC | negative regulation of protein phosphorylation | 191/7305 | 342/18723 | 1.58e-10 | 4.62e-09 | 191 |
| GO:00513032 | Oral cavity | OSCC | establishment of chromosome localization | 59/7305 | 80/18723 | 2.80e-10 | 7.72e-09 | 59 |
| GO:00500002 | Oral cavity | OSCC | chromosome localization | 60/7305 | 82/18723 | 3.38e-10 | 9.11e-09 | 60 |
| GO:00513102 | Oral cavity | OSCC | metaphase plate congression | 50/7305 | 65/18723 | 5.21e-10 | 1.37e-08 | 50 |
| GO:001063918 | Oral cavity | OSCC | negative regulation of organelle organization | 190/7305 | 348/18723 | 2.12e-09 | 4.97e-08 | 190 |
| GO:19019875 | Oral cavity | OSCC | regulation of cell cycle phase transition | 209/7305 | 390/18723 | 2.79e-09 | 6.42e-08 | 209 |
| Page: 1 2 3 4 5 6 7 8 9 10 11 12 13 14 15 16 17 18 19 20 21 22 23 24 25 26 27 28 29 30 31 32 33 34 35 36 37 38 39 40 41 42 43 |
| Pathway ID | Tissue | Disease Stage | Description | Gene Ratio | Bg Ratio | pvalue | p.adjust | qvalue | Count |
| hsa0411023 | Esophagus | ESCC | Cell cycle | 126/4205 | 157/8465 | 1.34e-15 | 5.60e-14 | 2.87e-14 | 126 |
| hsa0411524 | Esophagus | ESCC | p53 signaling pathway | 65/4205 | 74/8465 | 3.88e-12 | 6.50e-11 | 3.33e-11 | 65 |
| hsa0421829 | Esophagus | ESCC | Cellular senescence | 119/4205 | 156/8465 | 5.89e-12 | 9.40e-11 | 4.81e-11 | 119 |
| hsa05170210 | Esophagus | ESCC | Human immunodeficiency virus 1 infection | 147/4205 | 212/8465 | 3.37e-09 | 3.53e-08 | 1.81e-08 | 147 |
| hsa040689 | Esophagus | ESCC | FoxO signaling pathway | 89/4205 | 131/8465 | 1.56e-05 | 7.98e-05 | 4.09e-05 | 89 |
| hsa041146 | Esophagus | ESCC | Oocyte meiosis | 77/4205 | 131/8465 | 2.19e-02 | 4.80e-02 | 2.46e-02 | 77 |
| hsa0411033 | Esophagus | ESCC | Cell cycle | 126/4205 | 157/8465 | 1.34e-15 | 5.60e-14 | 2.87e-14 | 126 |
| hsa0411534 | Esophagus | ESCC | p53 signaling pathway | 65/4205 | 74/8465 | 3.88e-12 | 6.50e-11 | 3.33e-11 | 65 |
| hsa0421838 | Esophagus | ESCC | Cellular senescence | 119/4205 | 156/8465 | 5.89e-12 | 9.40e-11 | 4.81e-11 | 119 |
| hsa0517038 | Esophagus | ESCC | Human immunodeficiency virus 1 infection | 147/4205 | 212/8465 | 3.37e-09 | 3.53e-08 | 1.81e-08 | 147 |
| hsa0406814 | Esophagus | ESCC | FoxO signaling pathway | 89/4205 | 131/8465 | 1.56e-05 | 7.98e-05 | 4.09e-05 | 89 |
| hsa0411411 | Esophagus | ESCC | Oocyte meiosis | 77/4205 | 131/8465 | 2.19e-02 | 4.80e-02 | 2.46e-02 | 77 |
| hsa041102 | Liver | HCC | Cell cycle | 106/4020 | 157/8465 | 2.54e-07 | 3.04e-06 | 1.69e-06 | 106 |
| hsa0421822 | Liver | HCC | Cellular senescence | 102/4020 | 156/8465 | 4.18e-06 | 3.59e-05 | 2.00e-05 | 102 |
| hsa040684 | Liver | HCC | FoxO signaling pathway | 85/4020 | 131/8465 | 3.99e-05 | 2.16e-04 | 1.20e-04 | 85 |
| hsa051709 | Liver | HCC | Human immunodeficiency virus 1 infection | 125/4020 | 212/8465 | 4.51e-04 | 1.94e-03 | 1.08e-03 | 125 |
| hsa041156 | Liver | HCC | p53 signaling pathway | 46/4020 | 74/8465 | 7.64e-03 | 2.08e-02 | 1.16e-02 | 46 |
| hsa041103 | Liver | HCC | Cell cycle | 106/4020 | 157/8465 | 2.54e-07 | 3.04e-06 | 1.69e-06 | 106 |
| hsa0421832 | Liver | HCC | Cellular senescence | 102/4020 | 156/8465 | 4.18e-06 | 3.59e-05 | 2.00e-05 | 102 |
| hsa040685 | Liver | HCC | FoxO signaling pathway | 85/4020 | 131/8465 | 3.99e-05 | 2.16e-04 | 1.20e-04 | 85 |
| Page: 1 2 3 |
Top |
Cell-cell communication analysis |
| Identification of potential cell-cell interactions between two cell types and their ligand-receptor pairs for different disease states |
| Ligand | Receptor | LRpair | Pathway | Tissue | Disease Stage |
| Page: 1 |
Top |
Single-cell gene regulatory network inference analysis |
| Find out the significant the regulons (TFs) and the target genes of each regulon across cell types for different disease states |
| TF | Cell Type | Tissue | Disease Stage | Target Gene | RSS | Regulon Activity |
| ∗The dot plots of a searched regulon are shown for all cell subpopulations in each disease state of each tissue based on the regulon specific score inferred using pySCENIC and by calculating the average expression. |
| Page: 1 |
Top |
Somatic mutation of malignant transformation related genes |
| Annotation of somatic variants for genes involved in malignant transformation |
| Hugo Symbol | Variant Class | Variant Classification | dbSNP RS | HGVSc | HGVSp | HGVSp Short | SWISSPROT | BIOTYPE | SIFT | PolyPhen | Tumor Sample Barcode | Tissue | Histology | Sex | Age | Stage | Therapy Types | Drugs | Outcome |
| CCNB1 | SNV | Missense_Mutation | c.893N>T | p.Gly298Val | p.G298V | P14635 | protein_coding | deleterious(0) | probably_damaging(0.987) | TCGA-E2-A15K-06 | Breast | breast invasive carcinoma | Female | <65 | I/II | Chemotherapy | adriamycin | SD | |
| CCNB1 | insertion | Nonsense_Mutation | novel | c.1081_1082insTTCAATA | p.Trp361PhefsTer3 | p.W361Ffs*3 | P14635 | protein_coding | TCGA-A8-A07L-01 | Breast | breast invasive carcinoma | Female | <65 | III/IV | Chemotherapy | CR | |||
| CCNB1 | insertion | Nonsense_Mutation | novel | c.454_455insTGTAGGTCCTTGGCTGGTCGGGC | p.Ala152ValfsTer2 | p.A152Vfs*2 | P14635 | protein_coding | TCGA-BH-A0HY-01 | Breast | breast invasive carcinoma | Female | <65 | I/II | Hormone Therapy | taxotere | CR | ||
| CCNB1 | SNV | Missense_Mutation | c.449N>C | p.Ile150Thr | p.I150T | P14635 | protein_coding | deleterious(0) | benign(0.003) | TCGA-AA-3510-01 | Colorectum | colon adenocarcinoma | Male | >=65 | I/II | Unknown | Unknown | SD | |
| CCNB1 | SNV | Missense_Mutation | c.407C>T | p.Ala136Val | p.A136V | P14635 | protein_coding | tolerated(0.19) | benign(0.009) | TCGA-AA-A01K-01 | Colorectum | colon adenocarcinoma | Female | >=65 | III/IV | Chemotherapy | folinic | CR | |
| CCNB1 | SNV | Missense_Mutation | novel | c.1045N>G | p.Phe349Val | p.F349V | P14635 | protein_coding | tolerated(0.1) | benign(0.19) | TCGA-AZ-4315-01 | Colorectum | colon adenocarcinoma | Male | <65 | I/II | Unknown | Unknown | SD |
| CCNB1 | SNV | Missense_Mutation | c.785A>G | p.Tyr262Cys | p.Y262C | P14635 | protein_coding | deleterious(0) | probably_damaging(0.999) | TCGA-AZ-6601-01 | Colorectum | colon adenocarcinoma | Male | >=65 | I/II | Unknown | Unknown | PD | |
| CCNB1 | SNV | Missense_Mutation | c.804N>G | p.Asp268Glu | p.D268E | P14635 | protein_coding | deleterious(0) | possibly_damaging(0.873) | TCGA-CM-5861-01 | Colorectum | colon adenocarcinoma | Female | <65 | I/II | Unknown | Unknown | PD | |
| CCNB1 | SNV | Missense_Mutation | c.815N>G | p.Val272Gly | p.V272G | P14635 | protein_coding | deleterious(0) | probably_damaging(0.992) | TCGA-D5-6928-01 | Colorectum | colon adenocarcinoma | Male | >=65 | I/II | Unknown | Unknown | SD | |
| CCNB1 | SNV | Missense_Mutation | c.371C>G | p.Thr124Ser | p.T124S | P14635 | protein_coding | tolerated(0.72) | benign(0.001) | TCGA-F4-6570-01 | Colorectum | colon adenocarcinoma | Female | >=65 | I/II | Unknown | Unknown | SD |
| Page: 1 2 3 4 |
Top |
Related drugs of malignant transformation related genes |
| Identification of chemicals and drugs interact with genes involved in malignant transfromation |
| (DGIdb 4.0) |
| Entrez ID | Symbol | Category | Interaction Types | Drug Claim Name | Drug Name | PMIDs |
| 891 | CCNB1 | DRUGGABLE GENOME | PROTOAPIGENONE | PROTOAPIGENONE | ||
| 891 | CCNB1 | DRUGGABLE GENOME | SELICICLIB | SELICICLIB | 21080703 | |
| 891 | CCNB1 | DRUGGABLE GENOME | KENPAULLONE | KENPAULLONE |
| Page: 1 |

Copyright 2023-Present -The University of Texas Health Science Center at Houston |