Schematic overview of the cellular and molecular mechanisms involved in the cancer progression, including the proposed cellular and molecular mechanisms in cancer cells trajectory. AT1: alveolar type 1 cells; AT2: alveolar type 2 cells; AAH: atypical adenomatous hyperplasia; AIS: adenocarcinoma in situ; MIA: minimally invasive adenocarcinoma; IA: invasive adenocarcinoma; EMT: epithelial-mesenchymal transition

Home

Download

Statistics

Help

Contact

Center for Computational Systems Medicine
leaf

Gene summary

leaf

Malignant transformation analysis

leaf

Malignant transformation related pathway analysis

leaf

Cell-cell communication analysis

leaf

Single-cell gene regulatory network inference analysis

leaf

Somatic mutation of malignant transformation related genes

leaf

Related drugs of malignant transformation related genes

Gene: CCDC88A

Gene summary for CCDC88A

check button Gene summary.

Gene informationSpeciesHuman
Gene symbol

CCDC88A

Gene ID

55704

Gene namecoiled-coil domain containing 88A
Gene AliasAPE
Cytomap2p16.1
Gene Typeprotein-coding
GO ID

GO:0000226

UniProtAcc

O14997


Top

Malignant transformation analysis

check button Identification of the aberrant gene expression in precancerous and cancerous lesions by comparing the gene expression of stem-like cells in diseased tissues with normal stem cells
check button Malignant transformation involving gene list.
Entrez IDSymbolReplicatesSpeciesOrganTissueAdj P-valueLog2FCMalignancy
55704CCDC88ALZE4THumanEsophagusESCC1.25e-063.19e-010.0811
55704CCDC88ALZE22THumanEsophagusESCC1.16e-022.19e-010.068
55704CCDC88ALZE24THumanEsophagusESCC2.93e-051.78e-010.0596
55704CCDC88AP2T-EHumanEsophagusESCC5.62e-611.16e+000.1177
55704CCDC88AP4T-EHumanEsophagusESCC7.50e-276.16e-010.1323
55704CCDC88AP5T-EHumanEsophagusESCC3.29e-113.29e-010.1327
55704CCDC88AP8T-EHumanEsophagusESCC3.41e-061.01e-010.0889
55704CCDC88AP9T-EHumanEsophagusESCC9.61e-072.04e-010.1131
55704CCDC88AP10T-EHumanEsophagusESCC4.74e-183.72e-010.116
55704CCDC88AP11T-EHumanEsophagusESCC1.58e-093.54e-010.1426
55704CCDC88AP12T-EHumanEsophagusESCC1.33e-205.22e-010.1122
55704CCDC88AP15T-EHumanEsophagusESCC4.46e-185.72e-010.1149
55704CCDC88AP16T-EHumanEsophagusESCC1.55e-184.15e-010.1153
55704CCDC88AP17T-EHumanEsophagusESCC2.93e-032.53e-010.1278
55704CCDC88AP19T-EHumanEsophagusESCC1.70e-034.84e-010.1662
55704CCDC88AP20T-EHumanEsophagusESCC8.36e-133.71e-010.1124
55704CCDC88AP21T-EHumanEsophagusESCC1.69e-205.56e-010.1617
55704CCDC88AP22T-EHumanEsophagusESCC3.62e-073.69e-020.1236
55704CCDC88AP23T-EHumanEsophagusESCC6.12e-072.69e-010.108
55704CCDC88AP24T-EHumanEsophagusESCC3.86e-091.96e-010.1287
Page: 1 2 3 4 5 6 

check button Transcriptomic changes along malignancy continuum.
TissueExpression DynamicsAbbreviation
EsophagusThe image shows the transcriptomic changes along malignancy continuum.log2FC in expression of this searched gene in stem-like cells from each diseased tissue sample relative to stem-like cells in normal samples in each tissue plotted against the malignancy continuum. Samples are colored based on if they are from different disease stage.
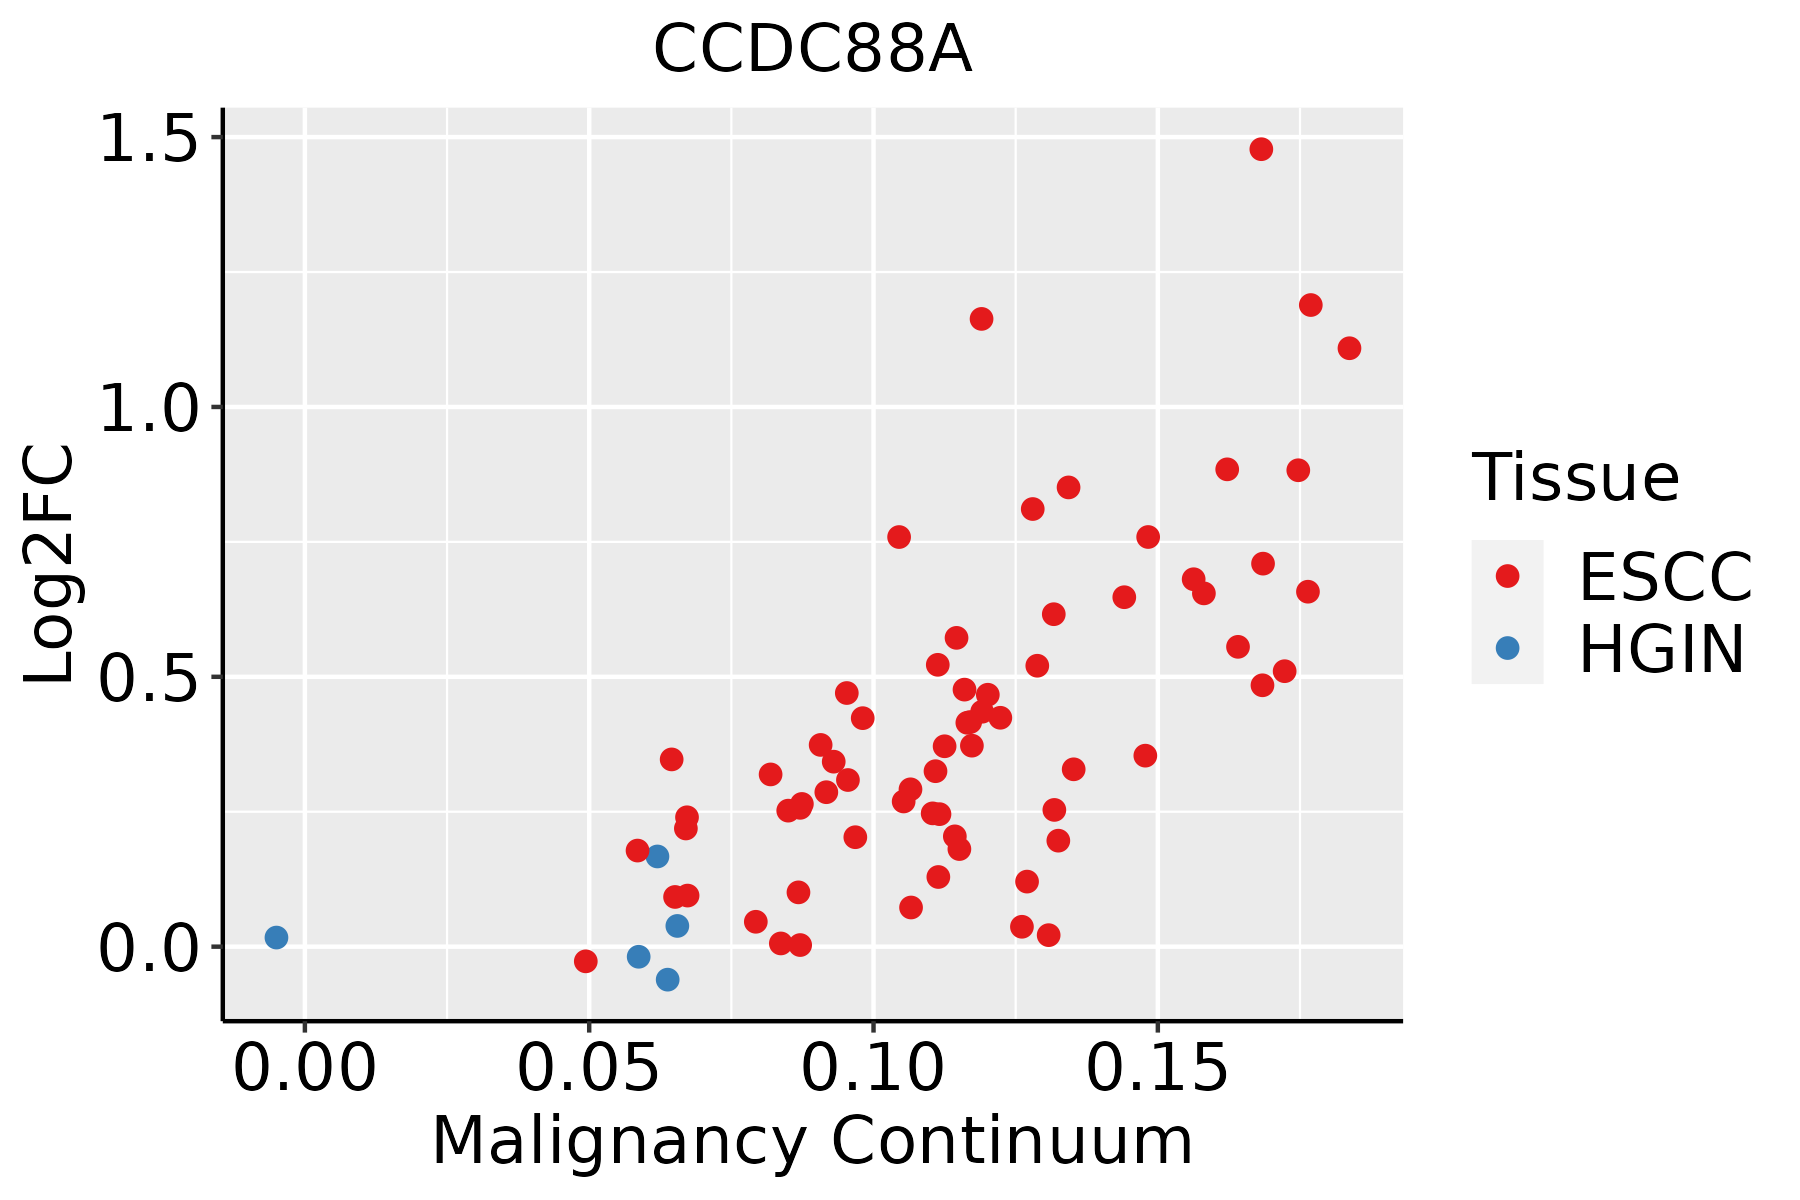
ESCC: Esophageal squamous cell carcinoma
HGIN: High-grade intraepithelial neoplasias
LGIN: Low-grade intraepithelial neoplasias
LiverThe image shows the transcriptomic changes along malignancy continuum.log2FC in expression of this searched gene in stem-like cells from each diseased tissue sample relative to stem-like cells in normal samples in each tissue plotted against the malignancy continuum. Samples are colored based on if they are from different disease stage.
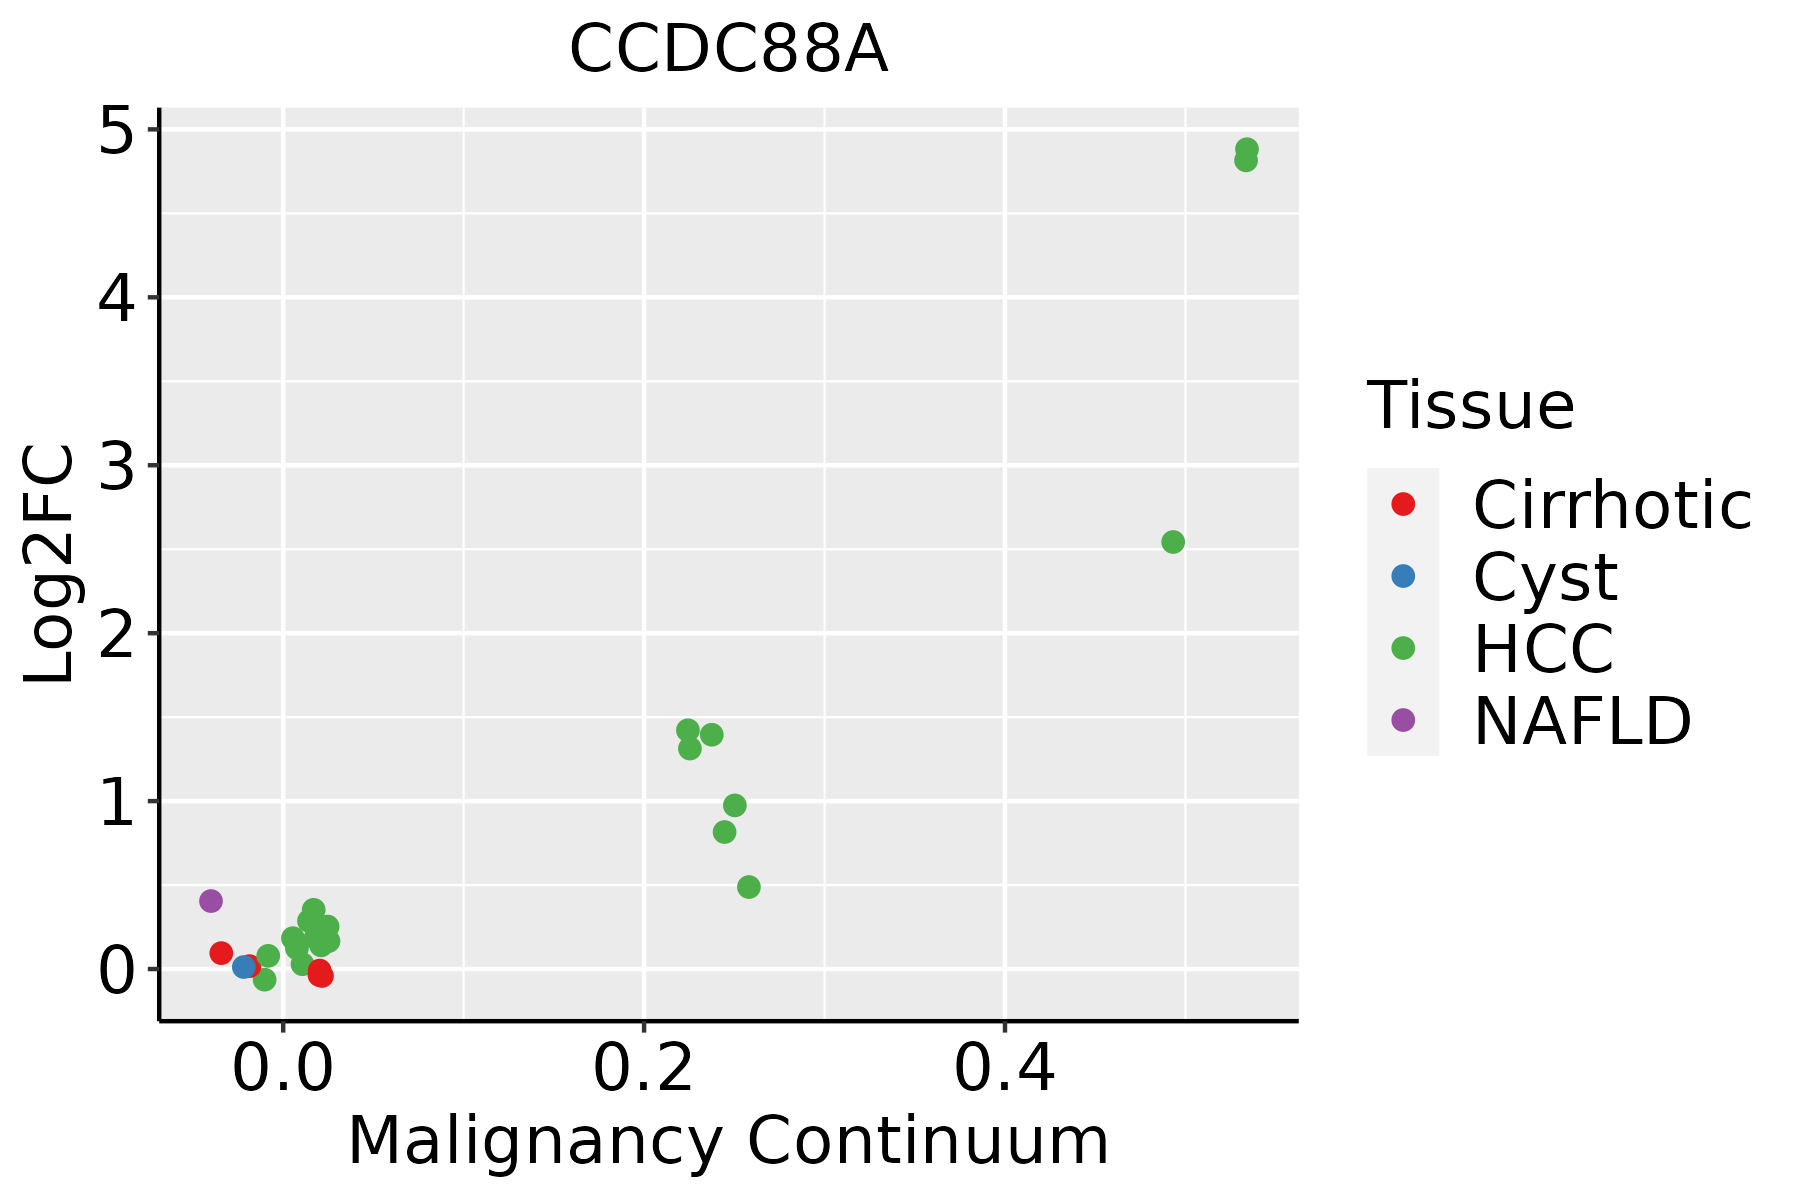
HCC: Hepatocellular carcinoma
NAFLD: Non-alcoholic fatty liver disease
Oral CavityThe image shows the transcriptomic changes along malignancy continuum.log2FC in expression of this searched gene in stem-like cells from each diseased tissue sample relative to stem-like cells in normal samples in each tissue plotted against the malignancy continuum. Samples are colored based on if they are from different disease stage.
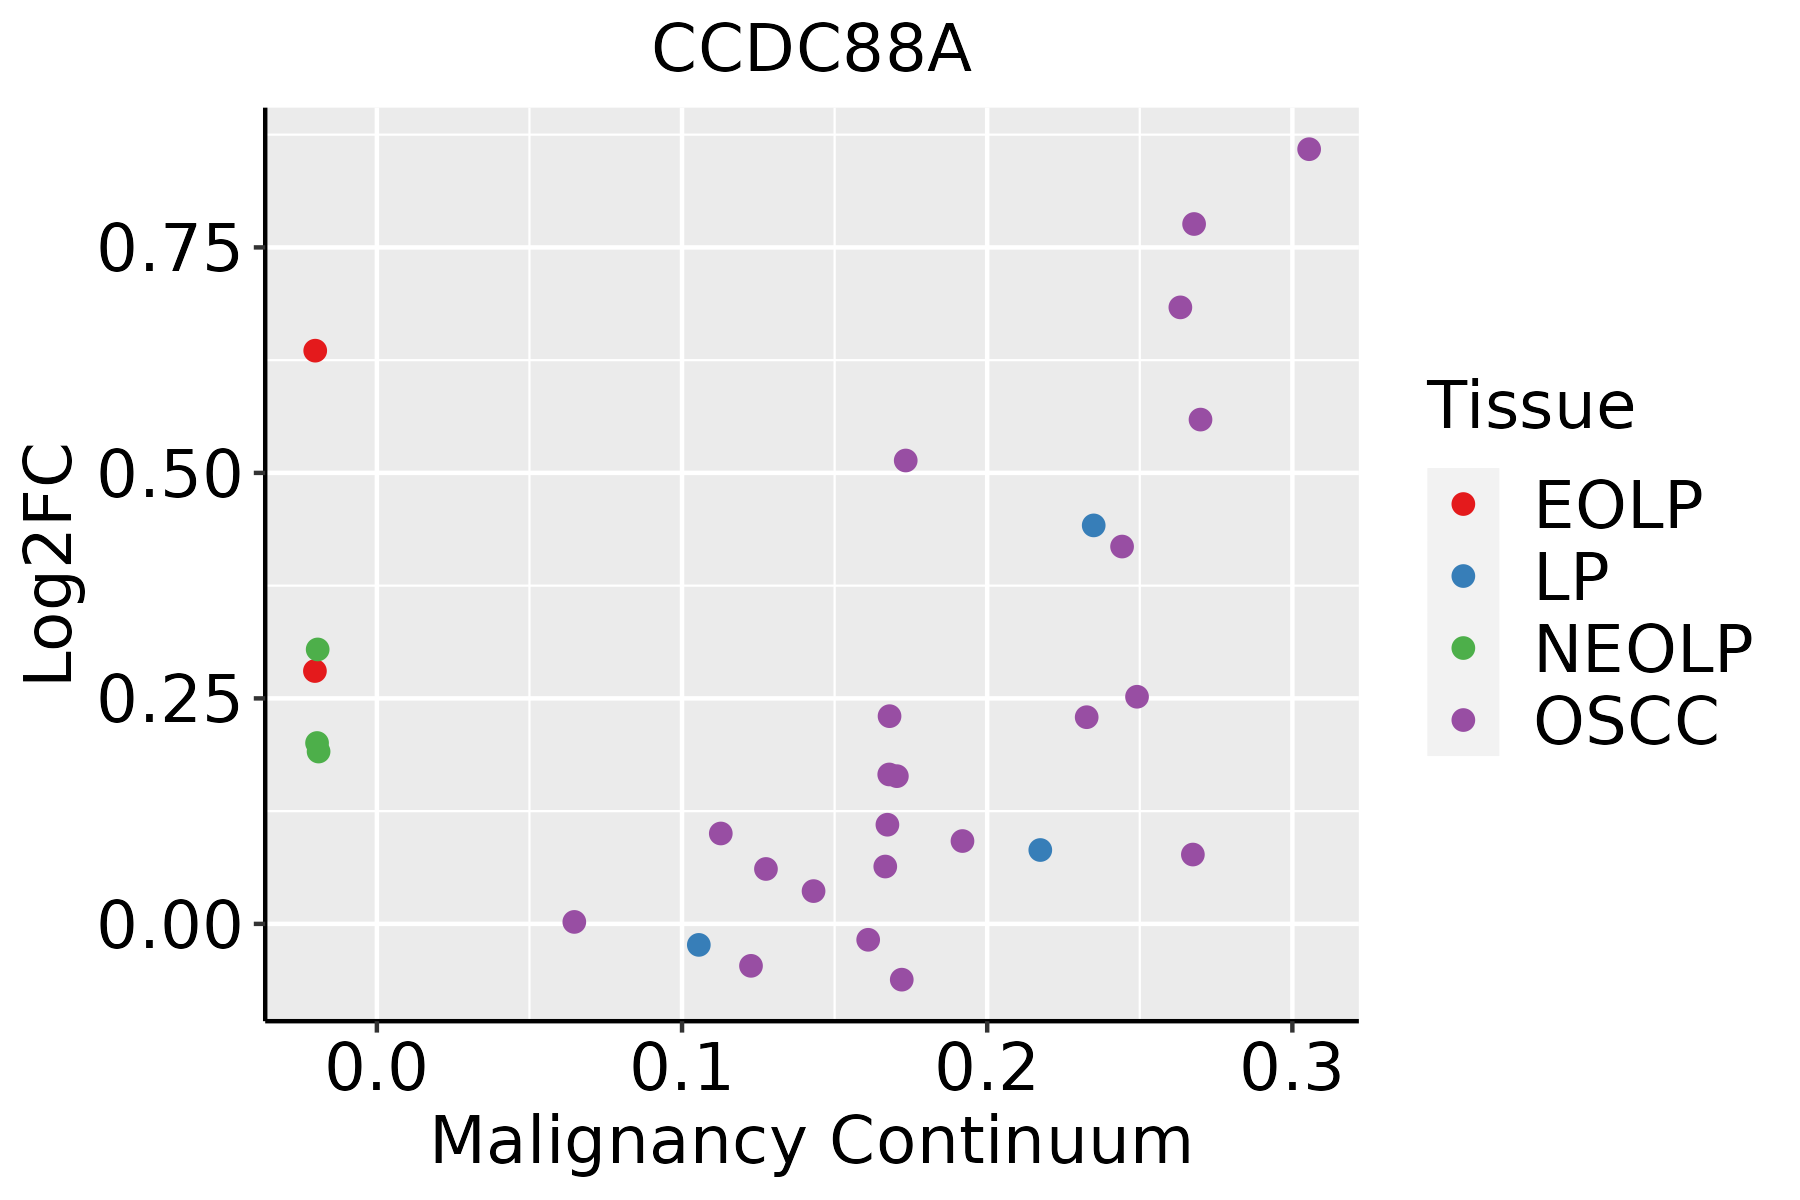
EOLP: Erosive Oral lichen planus
LP: leukoplakia
NEOLP: Non-erosive oral lichen planus
OSCC: Oral squamous cell carcinoma
ProstateThe image shows the transcriptomic changes along malignancy continuum.log2FC in expression of this searched gene in stem-like cells from each diseased tissue sample relative to stem-like cells in normal samples in each tissue plotted against the malignancy continuum. Samples are colored based on if they are from different disease stage.
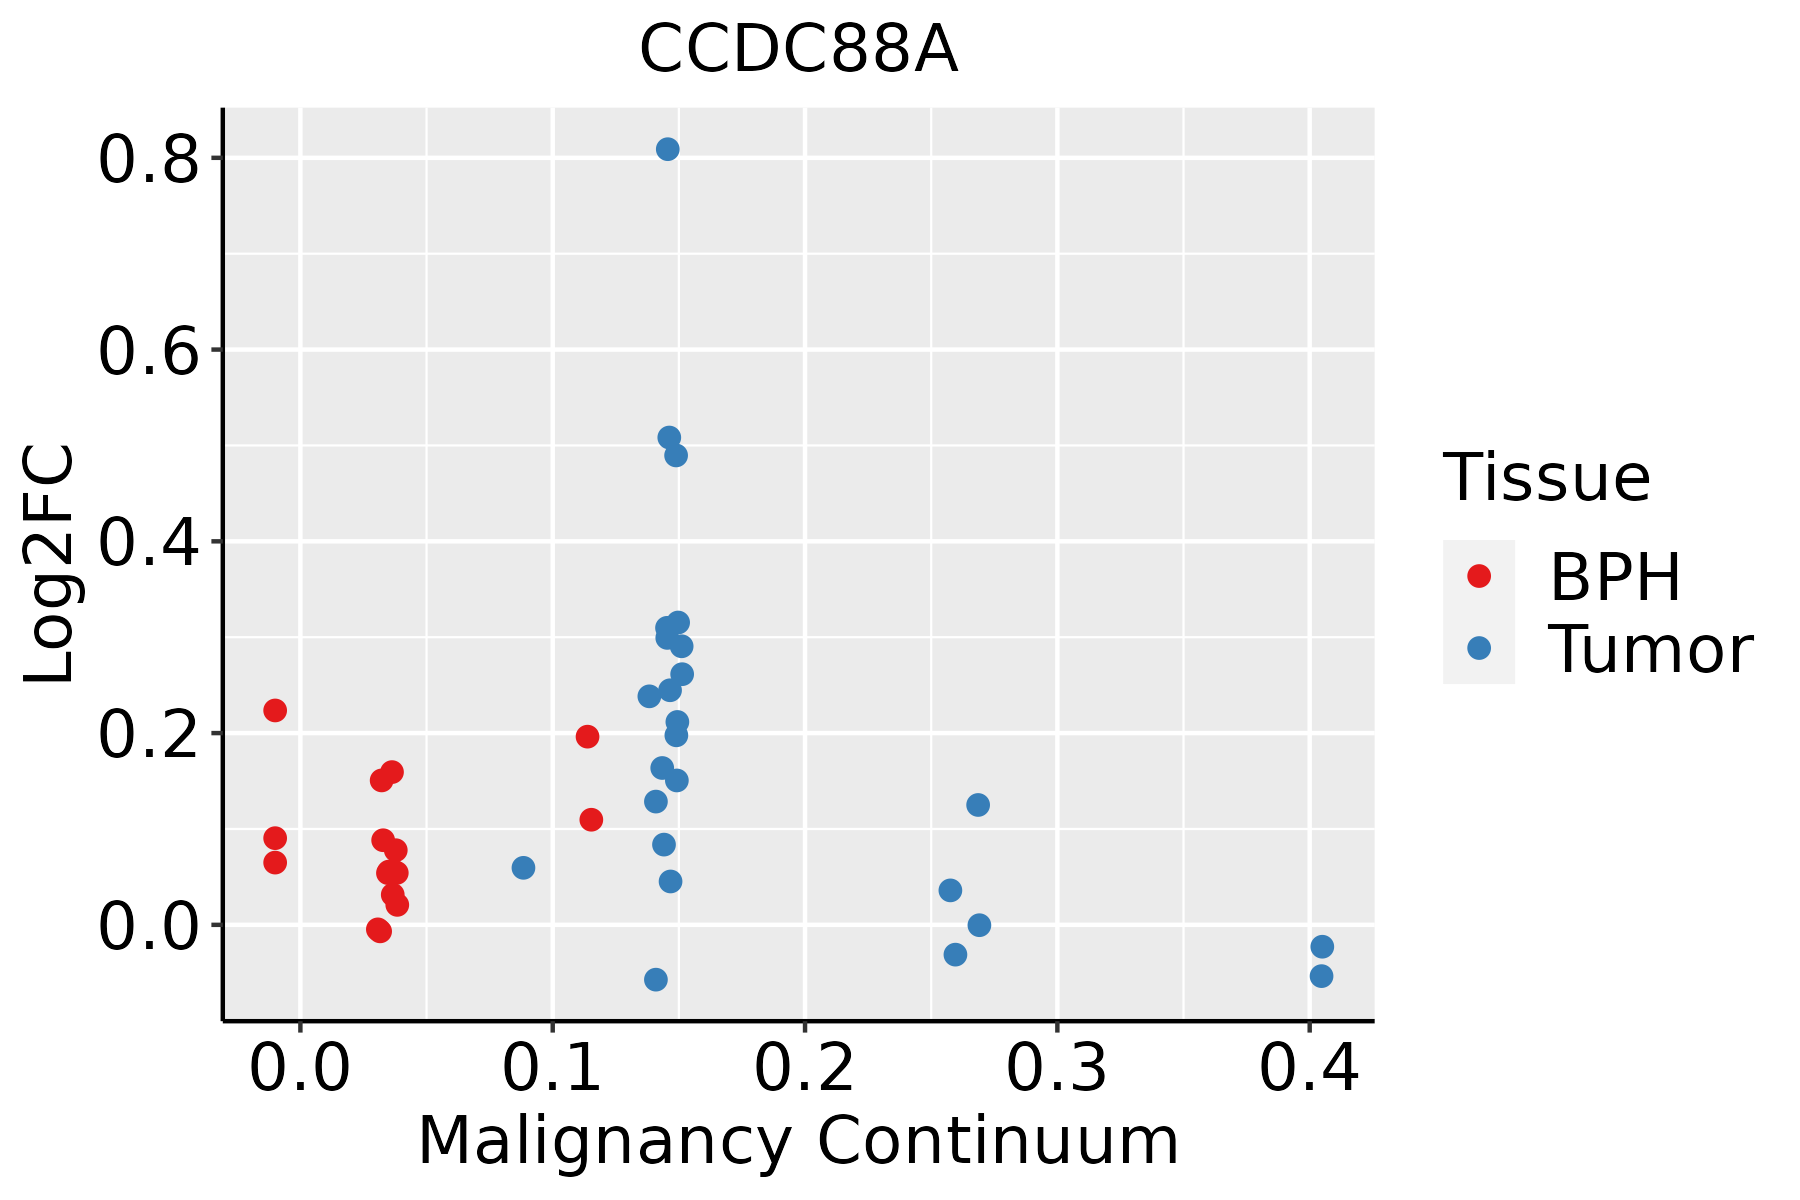
BPH: Benign Prostatic Hyperplasia
ThyroidThe image shows the transcriptomic changes along malignancy continuum.log2FC in expression of this searched gene in stem-like cells from each diseased tissue sample relative to stem-like cells in normal samples in each tissue plotted against the malignancy continuum. Samples are colored based on if they are from different disease stage.ATC: Anaplastic thyroid cancer
HT: Hashimoto's thyroiditis
PTC: Papillary thyroid cancer
∗log2FC in expression of this searched gene in stem-like cells from each diseased tissue sample relative to stem-like cells in normal samples in each tissue plotted against the malignancy continuum. Samples are colored based on if they are from different disease stage.

Top

Malignant transformation related pathway analysis

check buttonFind out the enriched GO biological processes and KEGG pathways involved in transition from healthy to precancer to cancer
check button Figure of enriched GO biological processes.
TissueDisease StageEnriched GO biological Processes
ColorectumADGO analysis - Figure of enriched GO biological processes: Top 15 enriched GO BP terms are showed in the bar plot of each disease state in each tissue. Each row represents a significant GO biological process which is colored according to the -log10(p.adjust).
ColorectumSERGO analysis - Figure of enriched GO biological processes: Top 15 enriched GO BP terms are showed in the bar plot of each disease state in each tissue. Each row represents a significant GO biological process which is colored according to the -log10(p.adjust).
ColorectumMSSGO analysis - Figure of enriched GO biological processes: Top 15 enriched GO BP terms are showed in the bar plot of each disease state in each tissue. Each row represents a significant GO biological process which is colored according to the -log10(p.adjust).
ColorectumMSI-HGO analysis - Figure of enriched GO biological processes: Top 15 enriched GO BP terms are showed in the bar plot of each disease state in each tissue. Each row represents a significant GO biological process which is colored according to the -log10(p.adjust).
ColorectumFAPGO analysis - Figure of enriched GO biological processes: Top 15 enriched GO BP terms are showed in the bar plot of each disease state in each tissue. Each row represents a significant GO biological process which is colored according to the -log10(p.adjust).
∗Top 15 enriched GO BP terms are showed in the bar plot of each disease state in each tissue. Each row represents a significant GO biological process which is colored according to the -log10(p.adjust).
Page: 1 2 3 4 5 6 7 8 9 

check button Enriched GO biological processes.
GO IDTissueDisease StageDescriptionGene RatioBg Ratiopvaluep.adjustCount
GO:005123517ProstateTumormaintenance of location78/3246327/187231.56e-039.55e-0378
GO:003003213ProstateTumorlamellipodium assembly22/324672/187234.15e-032.08e-0222
GO:1903829113ThyroidPTCpositive regulation of cellular protein localization162/5968276/187232.40e-203.52e-18162
GO:1902903113ThyroidPTCregulation of supramolecular fiber organization202/5968383/187231.16e-171.15e-15202
GO:0007015112ThyroidPTCactin filament organization225/5968442/187233.76e-173.44e-15225
GO:0072659112ThyroidPTCprotein localization to plasma membrane153/5968284/187239.90e-156.50e-13153
GO:1990778111ThyroidPTCprotein localization to cell periphery172/5968333/187233.71e-142.30e-12172
GO:0032956113ThyroidPTCregulation of actin cytoskeleton organization182/5968358/187234.64e-142.79e-12182
GO:0032970113ThyroidPTCregulation of actin filament-based process197/5968397/187238.91e-144.89e-12197
GO:0110053112ThyroidPTCregulation of actin filament organization146/5968278/187235.87e-132.85e-11146
GO:0045185113ThyroidPTCmaintenance of protein location64/596894/187235.92e-132.85e-1164
GO:1902905113ThyroidPTCpositive regulation of supramolecular fiber organization114/5968209/187238.48e-123.57e-10114
GO:005149526ThyroidPTCpositive regulation of cytoskeleton organization121/5968226/187231.04e-114.27e-10121
GO:0031346110ThyroidPTCpositive regulation of cell projection organization173/5968353/187231.09e-114.40e-10173
GO:0032507112ThyroidPTCmaintenance of protein location in cell47/596865/187232.54e-119.66e-1047
GO:0030705111ThyroidPTCcytoskeleton-dependent intracellular transport104/5968195/187233.87e-101.24e-08104
GO:0045860111ThyroidPTCpositive regulation of protein kinase activity176/5968386/187238.89e-092.17e-07176
GO:0051017112ThyroidPTCactin filament bundle assembly83/5968157/187233.73e-088.18e-0783
GO:0061572112ThyroidPTCactin filament bundle organization84/5968161/187236.75e-081.40e-0684
GO:0010975110ThyroidPTCregulation of neuron projection development194/5968445/187231.05e-072.08e-06194
Page: 1 2 3 4 5 6 7 8 9 10 11 12 13 14 15 16 17 18 19 

check button Enriched KEGG pathways.
Pathway IDTissueDisease StageDescriptionGene RatioBg Ratiopvaluep.adjustqvalueCount
Page: 1 

Top

Cell-cell communication analysis

check buttonIdentification of potential cell-cell interactions between two cell types and their ligand-receptor pairs for different disease states
LigandReceptorLRpairPathwayTissueDisease Stage
Page: 1 

Top

Single-cell gene regulatory network inference analysis

check buttonFind out the significant the regulons (TFs) and the target genes of each regulon across cell types for different disease states
TFCell TypeTissueDisease StageTarget GeneRSSRegulon Activity
∗The dot plots of a searched regulon are shown for all cell subpopulations in each disease state of each tissue based on the regulon specific score inferred using pySCENIC and by calculating the average expression.
Page: 1 

Top

Somatic mutation of malignant transformation related genes

check buttonAnnotation of somatic variants for genes involved in malignant transformation
Hugo SymbolVariant ClassVariant ClassificationdbSNP RSHGVScHGVSpHGVSp ShortSWISSPROTBIOTYPESIFTPolyPhenTumor Sample BarcodeTissueHistologySexAgeStageTherapy TypesDrugsOutcome
CCDC88ASNVMissense_Mutationc.353C>Gp.Thr118Argp.T118RQ3V6T2protein_codingdeleterious(0)possibly_damaging(0.809)TCGA-A1-A0SO-01Breastbreast invasive carcinomaFemale>=65I/IIChemotherapySD
CCDC88ASNVMissense_Mutationc.1198N>Gp.Met400Valp.M400VQ3V6T2protein_codingtolerated(0.11)benign(0.029)TCGA-A8-A09Z-01Breastbreast invasive carcinomaFemale>=65I/IIUnknownUnknownSD
CCDC88ASNVMissense_Mutationc.5200N>Cp.Val1734Leup.V1734LQ3V6T2protein_codingtolerated(0.35)benign(0.001)TCGA-AC-A23H-01Breastbreast invasive carcinomaFemale>=65I/IIUnknownUnknownPD
CCDC88ASNVMissense_Mutationc.4197N>Ap.Met1399Ilep.M1399IQ3V6T2protein_codingtolerated(0.07)benign(0.311)TCGA-AC-A23H-01Breastbreast invasive carcinomaFemale>=65I/IIUnknownUnknownPD
CCDC88ASNVMissense_Mutationc.427N>Ap.Glu143Lysp.E143KQ3V6T2protein_codingdeleterious(0.04)probably_damaging(0.997)TCGA-AC-A23H-01Breastbreast invasive carcinomaFemale>=65I/IIUnknownUnknownPD
CCDC88ASNVMissense_Mutationc.255N>Cp.Gln85Hisp.Q85HQ3V6T2protein_codingtolerated(0.72)benign(0.052)TCGA-AC-A23H-01Breastbreast invasive carcinomaFemale>=65I/IIUnknownUnknownPD
CCDC88ASNVMissense_Mutationnovelc.802N>Ap.Glu268Lysp.E268KQ3V6T2protein_codingdeleterious(0)probably_damaging(0.94)TCGA-AC-A3W5-01Breastbreast invasive carcinomaFemale>=65I/IIChemotherapydocetaxelCR
CCDC88ASNVMissense_Mutationnovelc.3964N>Cp.Glu1322Glnp.E1322QQ3V6T2protein_codingdeleterious(0.01)probably_damaging(0.981)TCGA-AC-A3W6-01Breastbreast invasive carcinomaFemale>=65III/IVUnknownUnknownSD
CCDC88ASNVMissense_Mutationnovelc.5256N>Gp.Phe1752Leup.F1752LQ3V6T2protein_codingtolerated(0.54)benign(0)TCGA-AN-A046-01Breastbreast invasive carcinomaFemale>=65I/IIUnknownUnknownSD
CCDC88ASNVMissense_Mutationc.1774N>Ap.Leu592Ilep.L592IQ3V6T2protein_codingdeleterious(0)probably_damaging(0.997)TCGA-AN-A046-01Breastbreast invasive carcinomaFemale>=65I/IIUnknownUnknownSD
Page: 1 2 3 4 5 6 7 8 9 10 11 12 13 14 15 16 17 18 19 20 21 22 

Top

Related drugs of malignant transformation related genes

check buttonIdentification of chemicals and drugs interact with genes involved in malignant transfromation
(DGIdb 4.0)
Entrez IDSymbolCategoryInteraction TypesDrug Claim NameDrug NamePMIDs
Page: 1